Fig. 2.44 shows the velocity-time graph of a particle moving in a straight line.
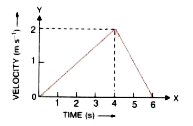
(i) State the nature of motion of particle.
(ii) Find the displacement of particle at t = 6 s.
(iii) Does the particle change its direction of motion ?
(iv) Compare the distance travelled by the particle from 0 to 4 s and from 4 s to 6 s.
(v) Find the acceleration from 0 to 4 s and retardation from 4 s to 6 s.
(i) Uniformly accelerated from 0 to 4 s and then uniformly retarded from 4 s to 6 s. (ii) 6 m
(iii) No, (iv) 2 : 1(v) acceleration = 0.5 m s−1,
retardation = 1 m s−2.
Topper's Solved these Questions
- MOTION IN ONE DIMENSION BOOK - ICSECHAPTER - MOTION IN ONE DIMENSION EXERCISE - EXERCISE -2 (C)
3 Videos
- MOTION IN ONE DIMENSION BOOK - ICSECHAPTER - MOTION IN ONE DIMENSION EXERCISE - EXERCISE -2 (C) ( Multiple choice type :)
17 Videos
- MOTION IN ONE DIMENSION BOOK - ICSECHAPTER - MOTION IN ONE DIMENSION EXERCISE - EXERCISE -2 (B) ( Multiple choice type :)
3 Videos
- MEASUREMENTS AND EXPERIMENTATION BOOK - ICSECHAPTER - MEASUREMENTS AND EXPERIMENTATION EXERCISE - TOPIC 2 SIMPLE PENDULUM (4 Marks Questions )
1 Video
- PRESSURE IN FLUIDS AND ATMOSPHERIC PRESSUREBOOK - ICSECHAPTER - PRESSURE IN FLUIDS AND ATMOSPHERIC PRESSUREEXERCISE - Exercise -4(B)Numericals
5 Videos
Similar Questions
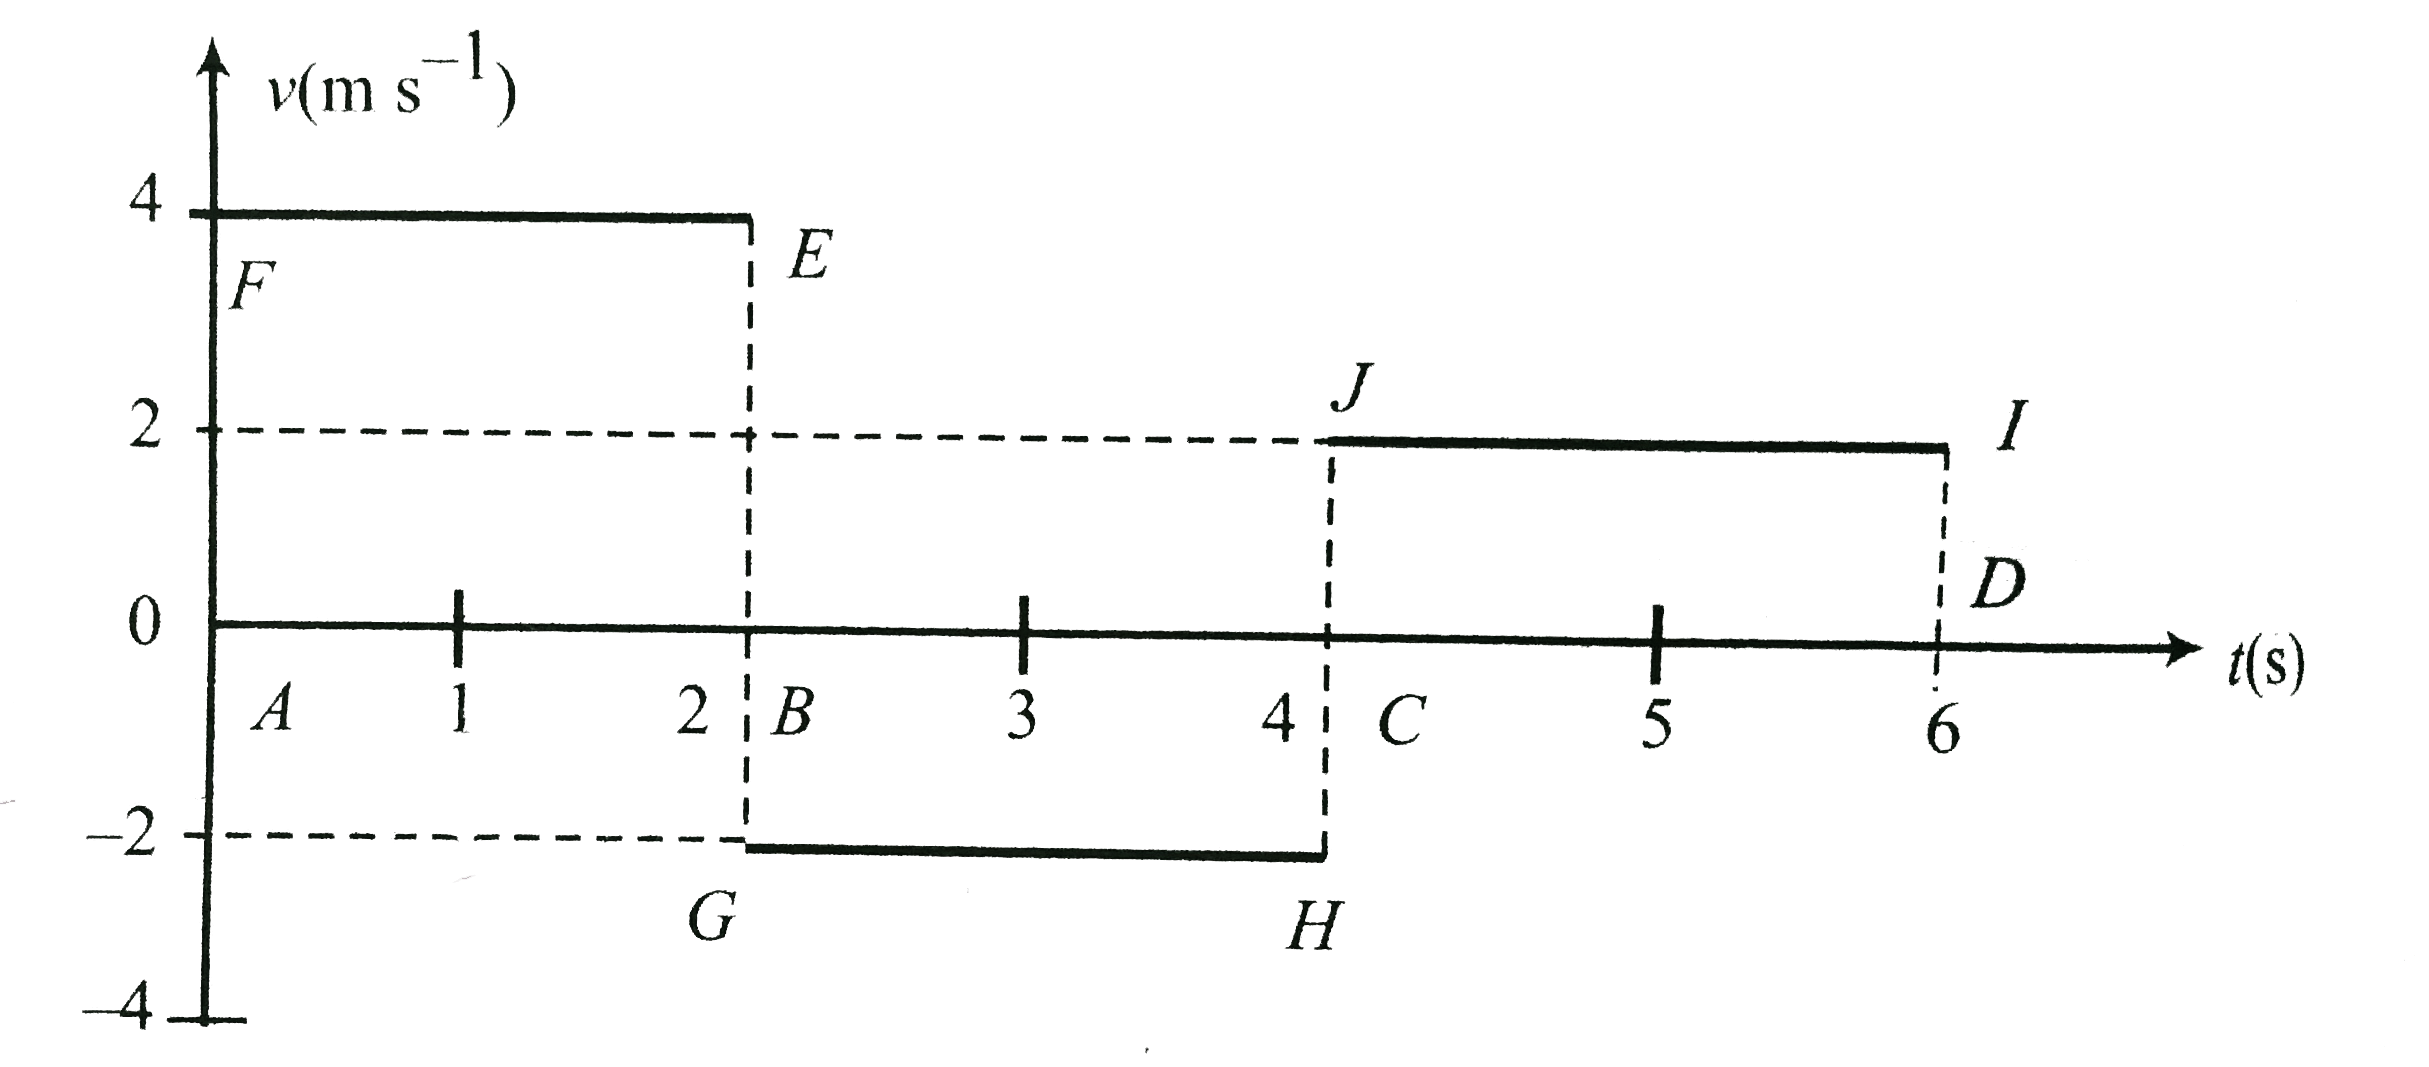
The velocity-time graph of a particle moving in a staight line is shown in the . Find the displacement and the distance trav elled by the particle in 6s.
 .
.
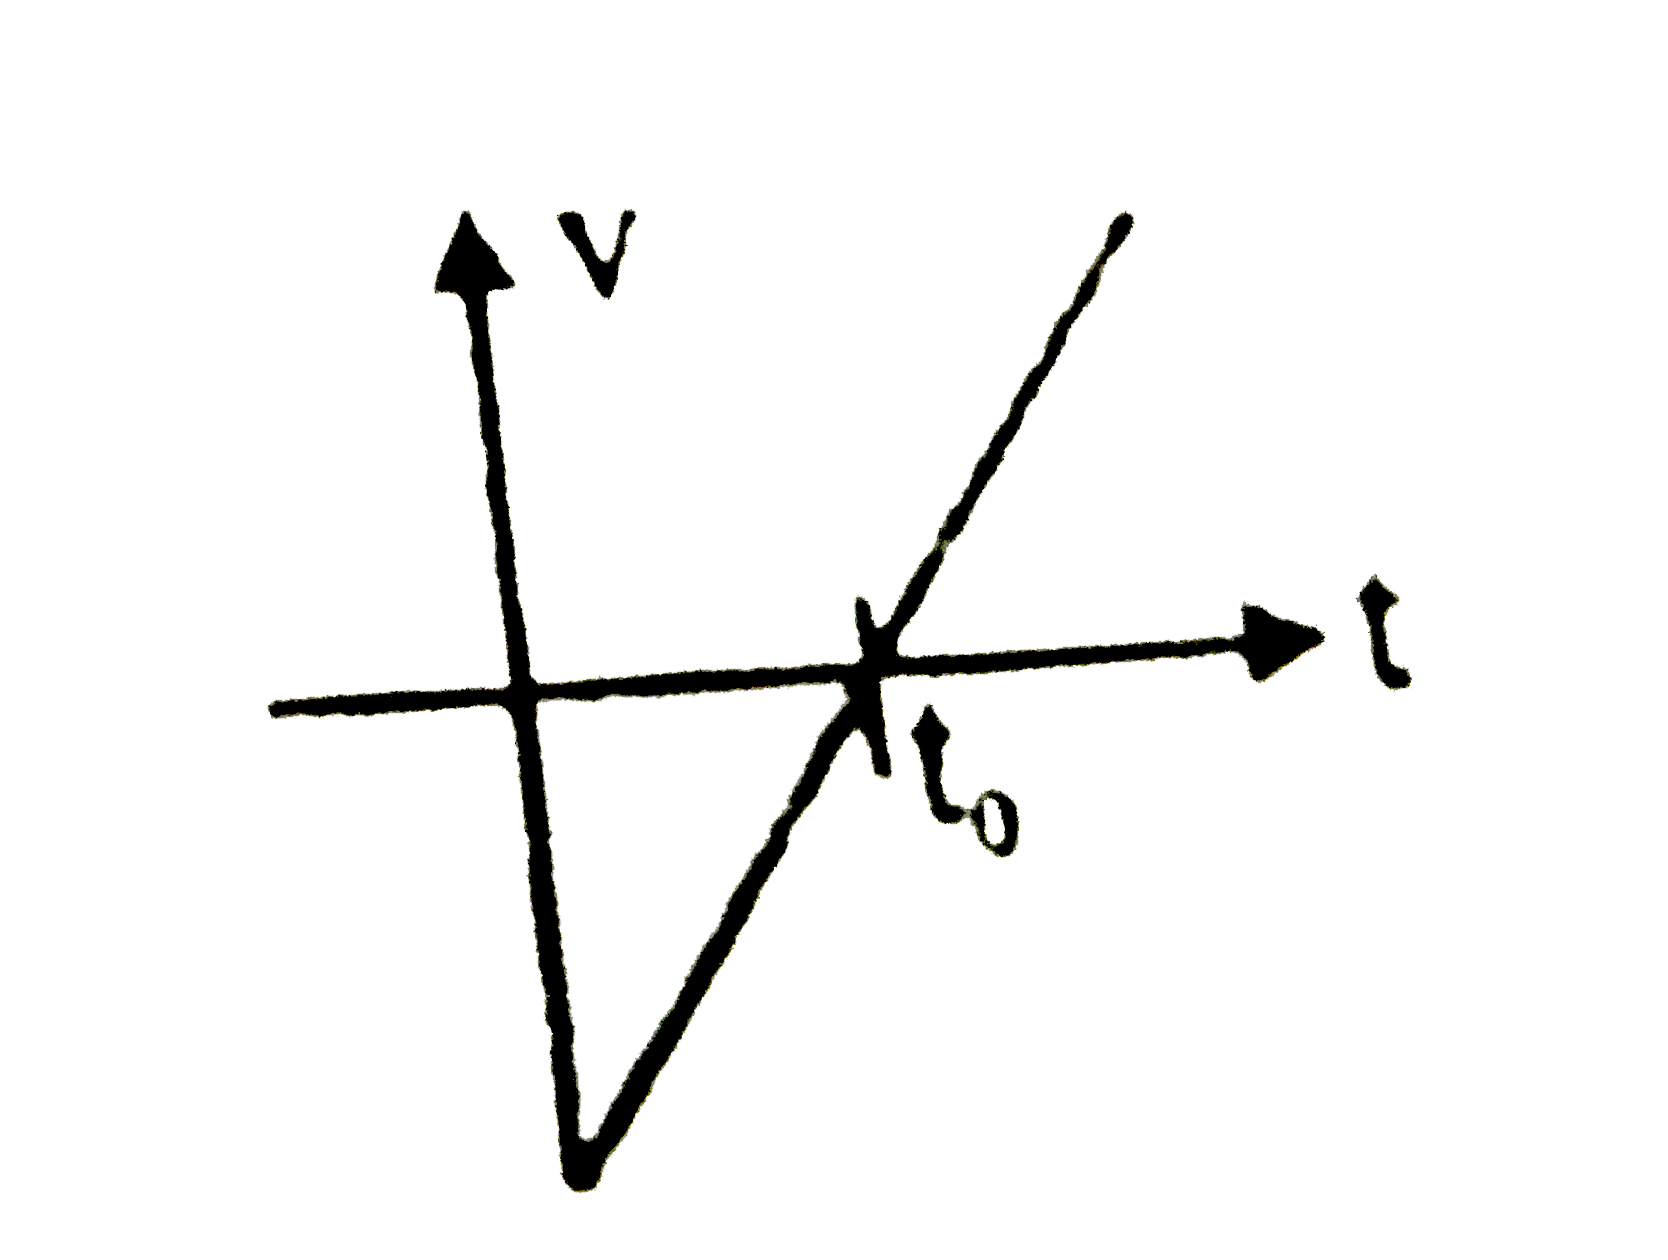
View SolutionThe velocity time graph of a particle moving in a straight line is given line is given in the figure. Then starting from t=0, the particle
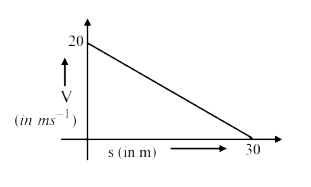
View SolutionThe velocity –position graph of a particle moving along a straight line is shown. Then acceleration of the particle at s = 15 m is :
View SolutionThe fig. shows the v−t graph of a particle moving in straight line. Find the time when particle returns to the starting point.
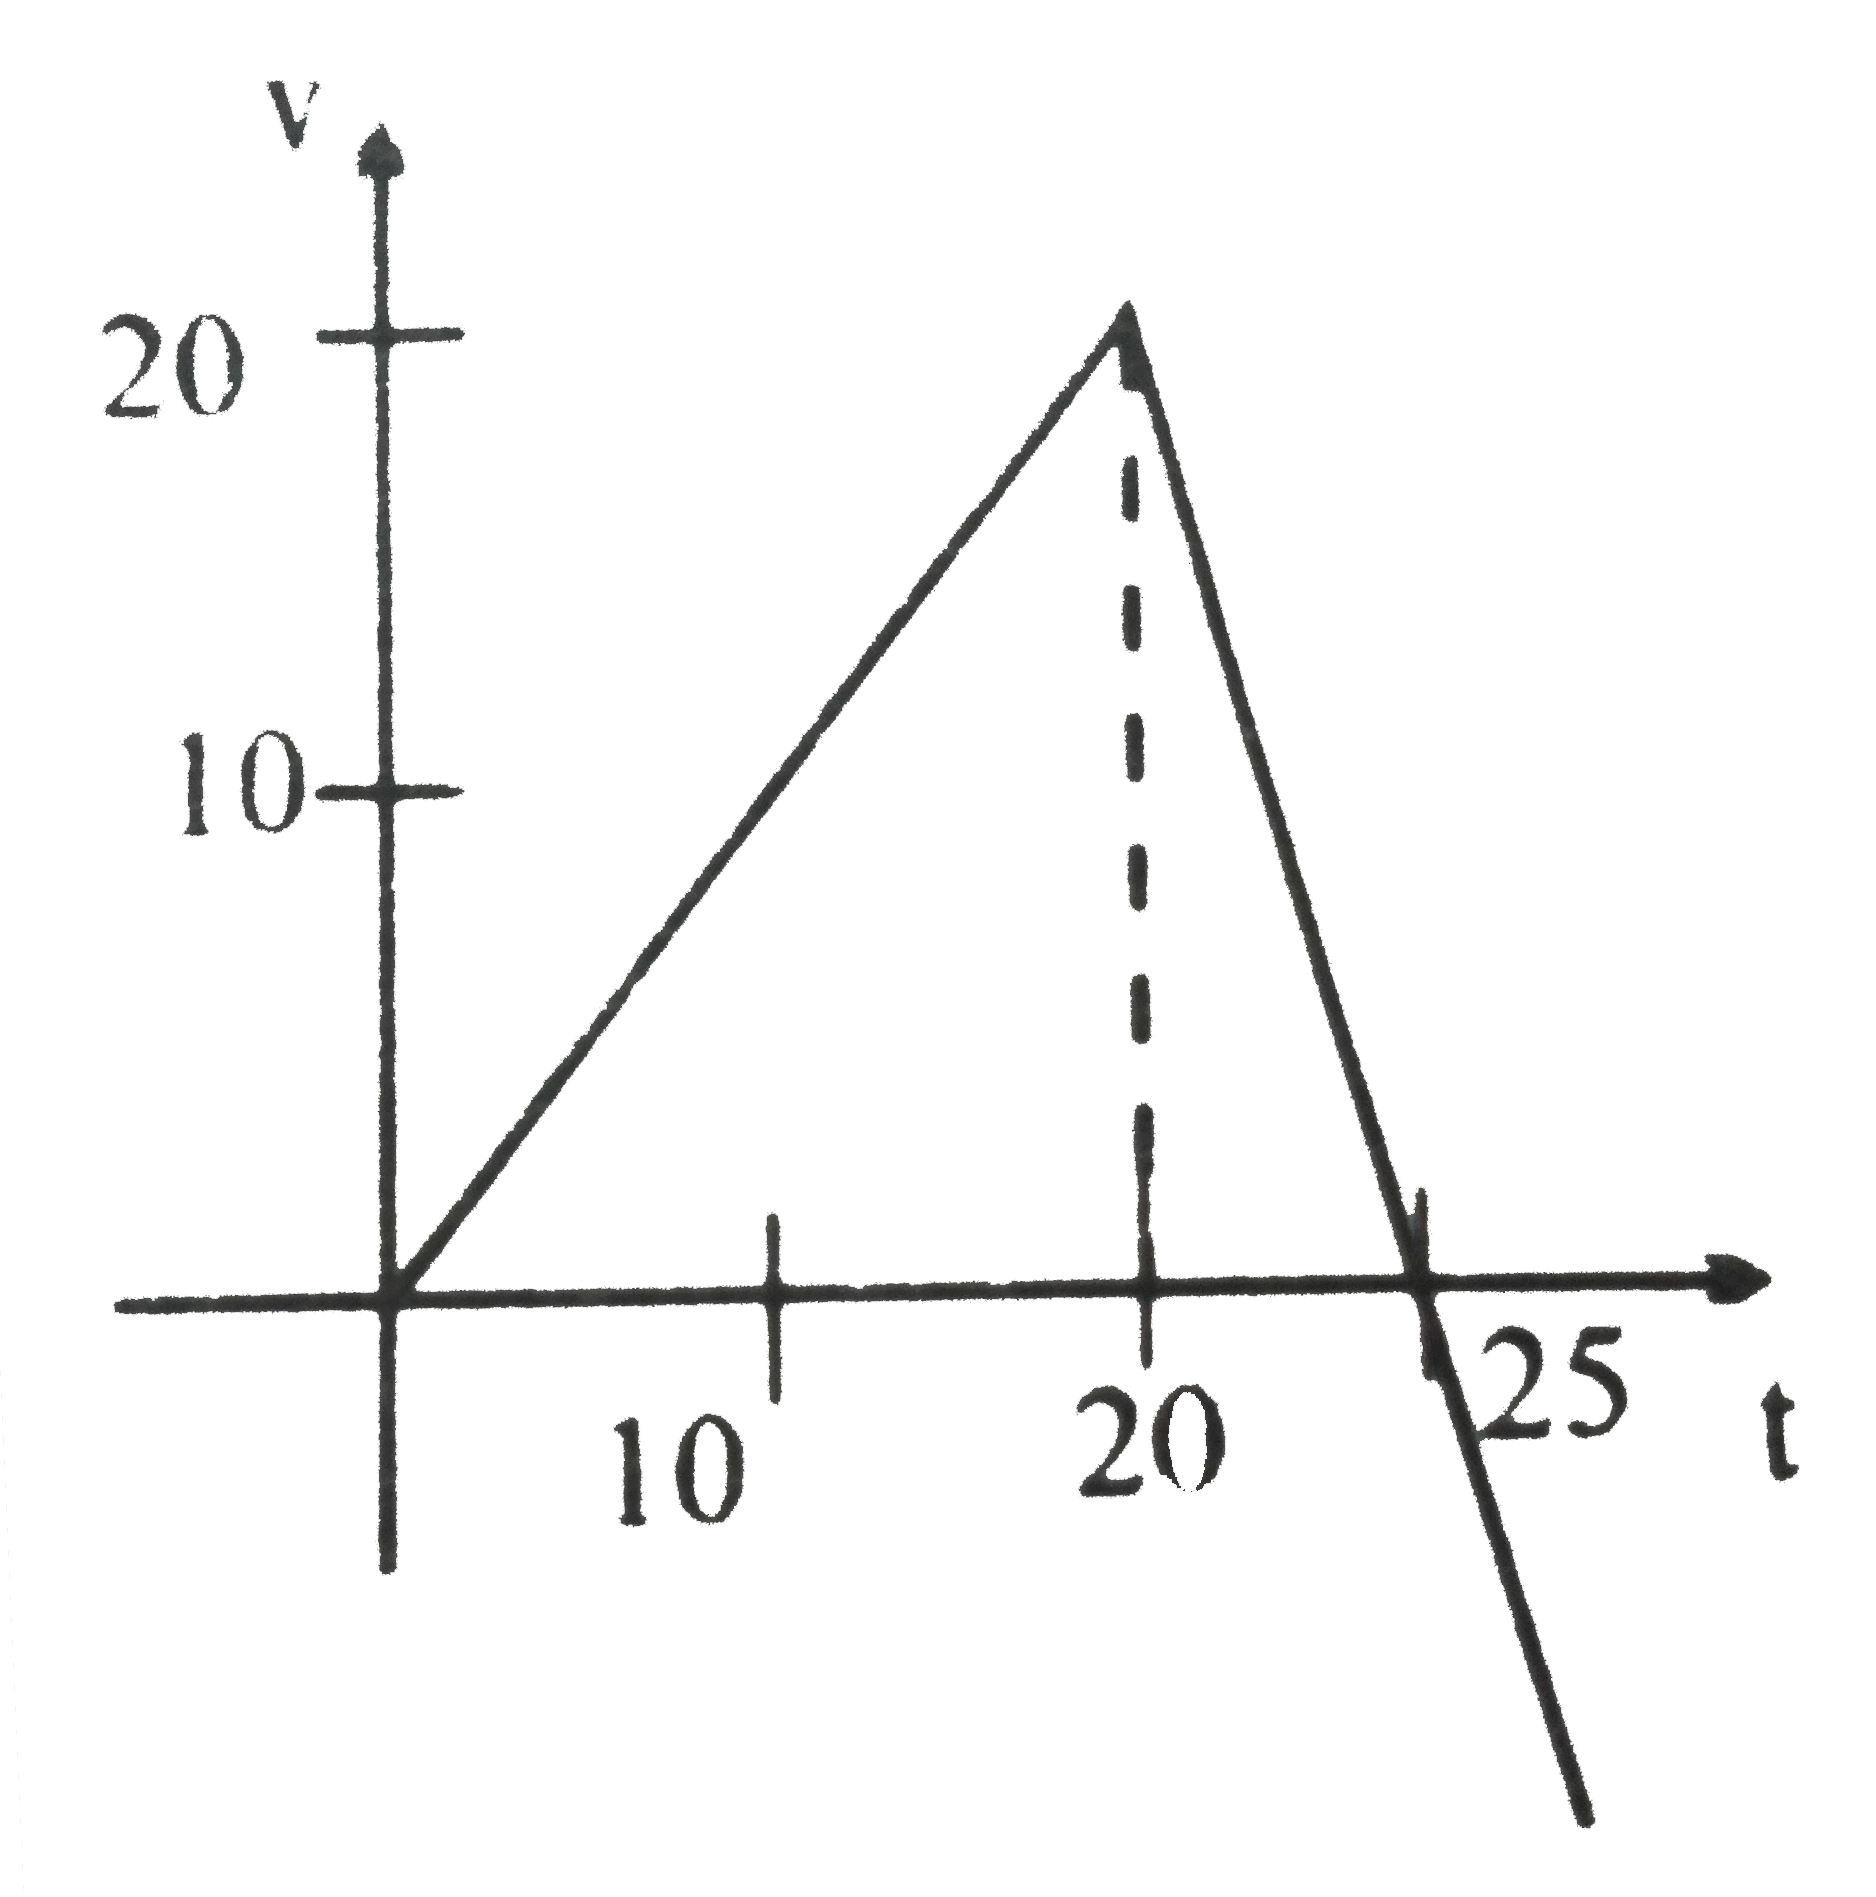
View SolutionVelocity-time graph of a particle moving in a straight line is shown in figure. Plot the corresponding displacement-time graph of the particle if at time t=0, displacement s=0.
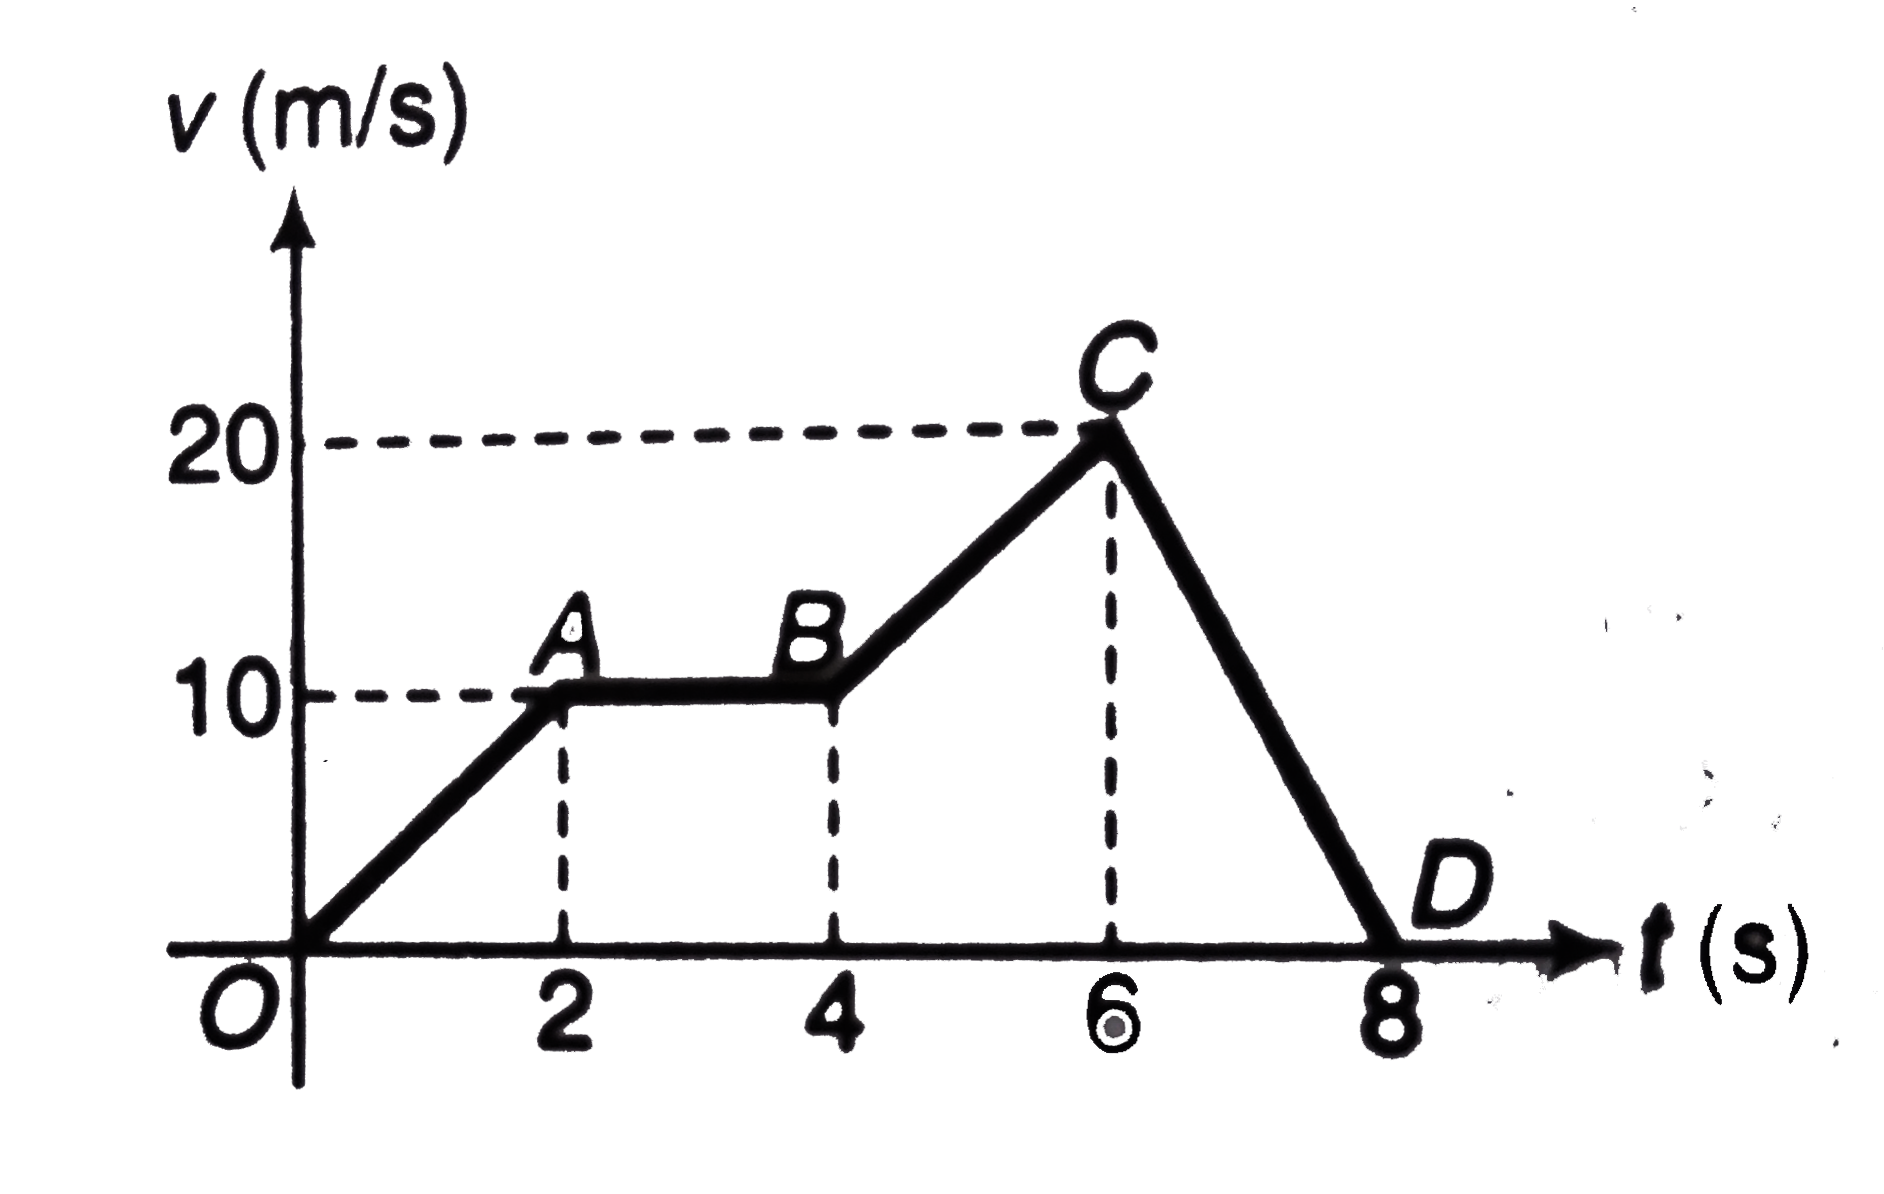
View SolutionVelocity-time graph of a particle moving in a straight line is shown in figure. Plot the corresponding displacement-time graph of the particle if at time t=0, displacement s=0.

View SolutionThe diagram shows the displacement - time graph for a particle moving in a straight line. The distance (in m) coverted by the particle in the time interval t=0 to t=5s is
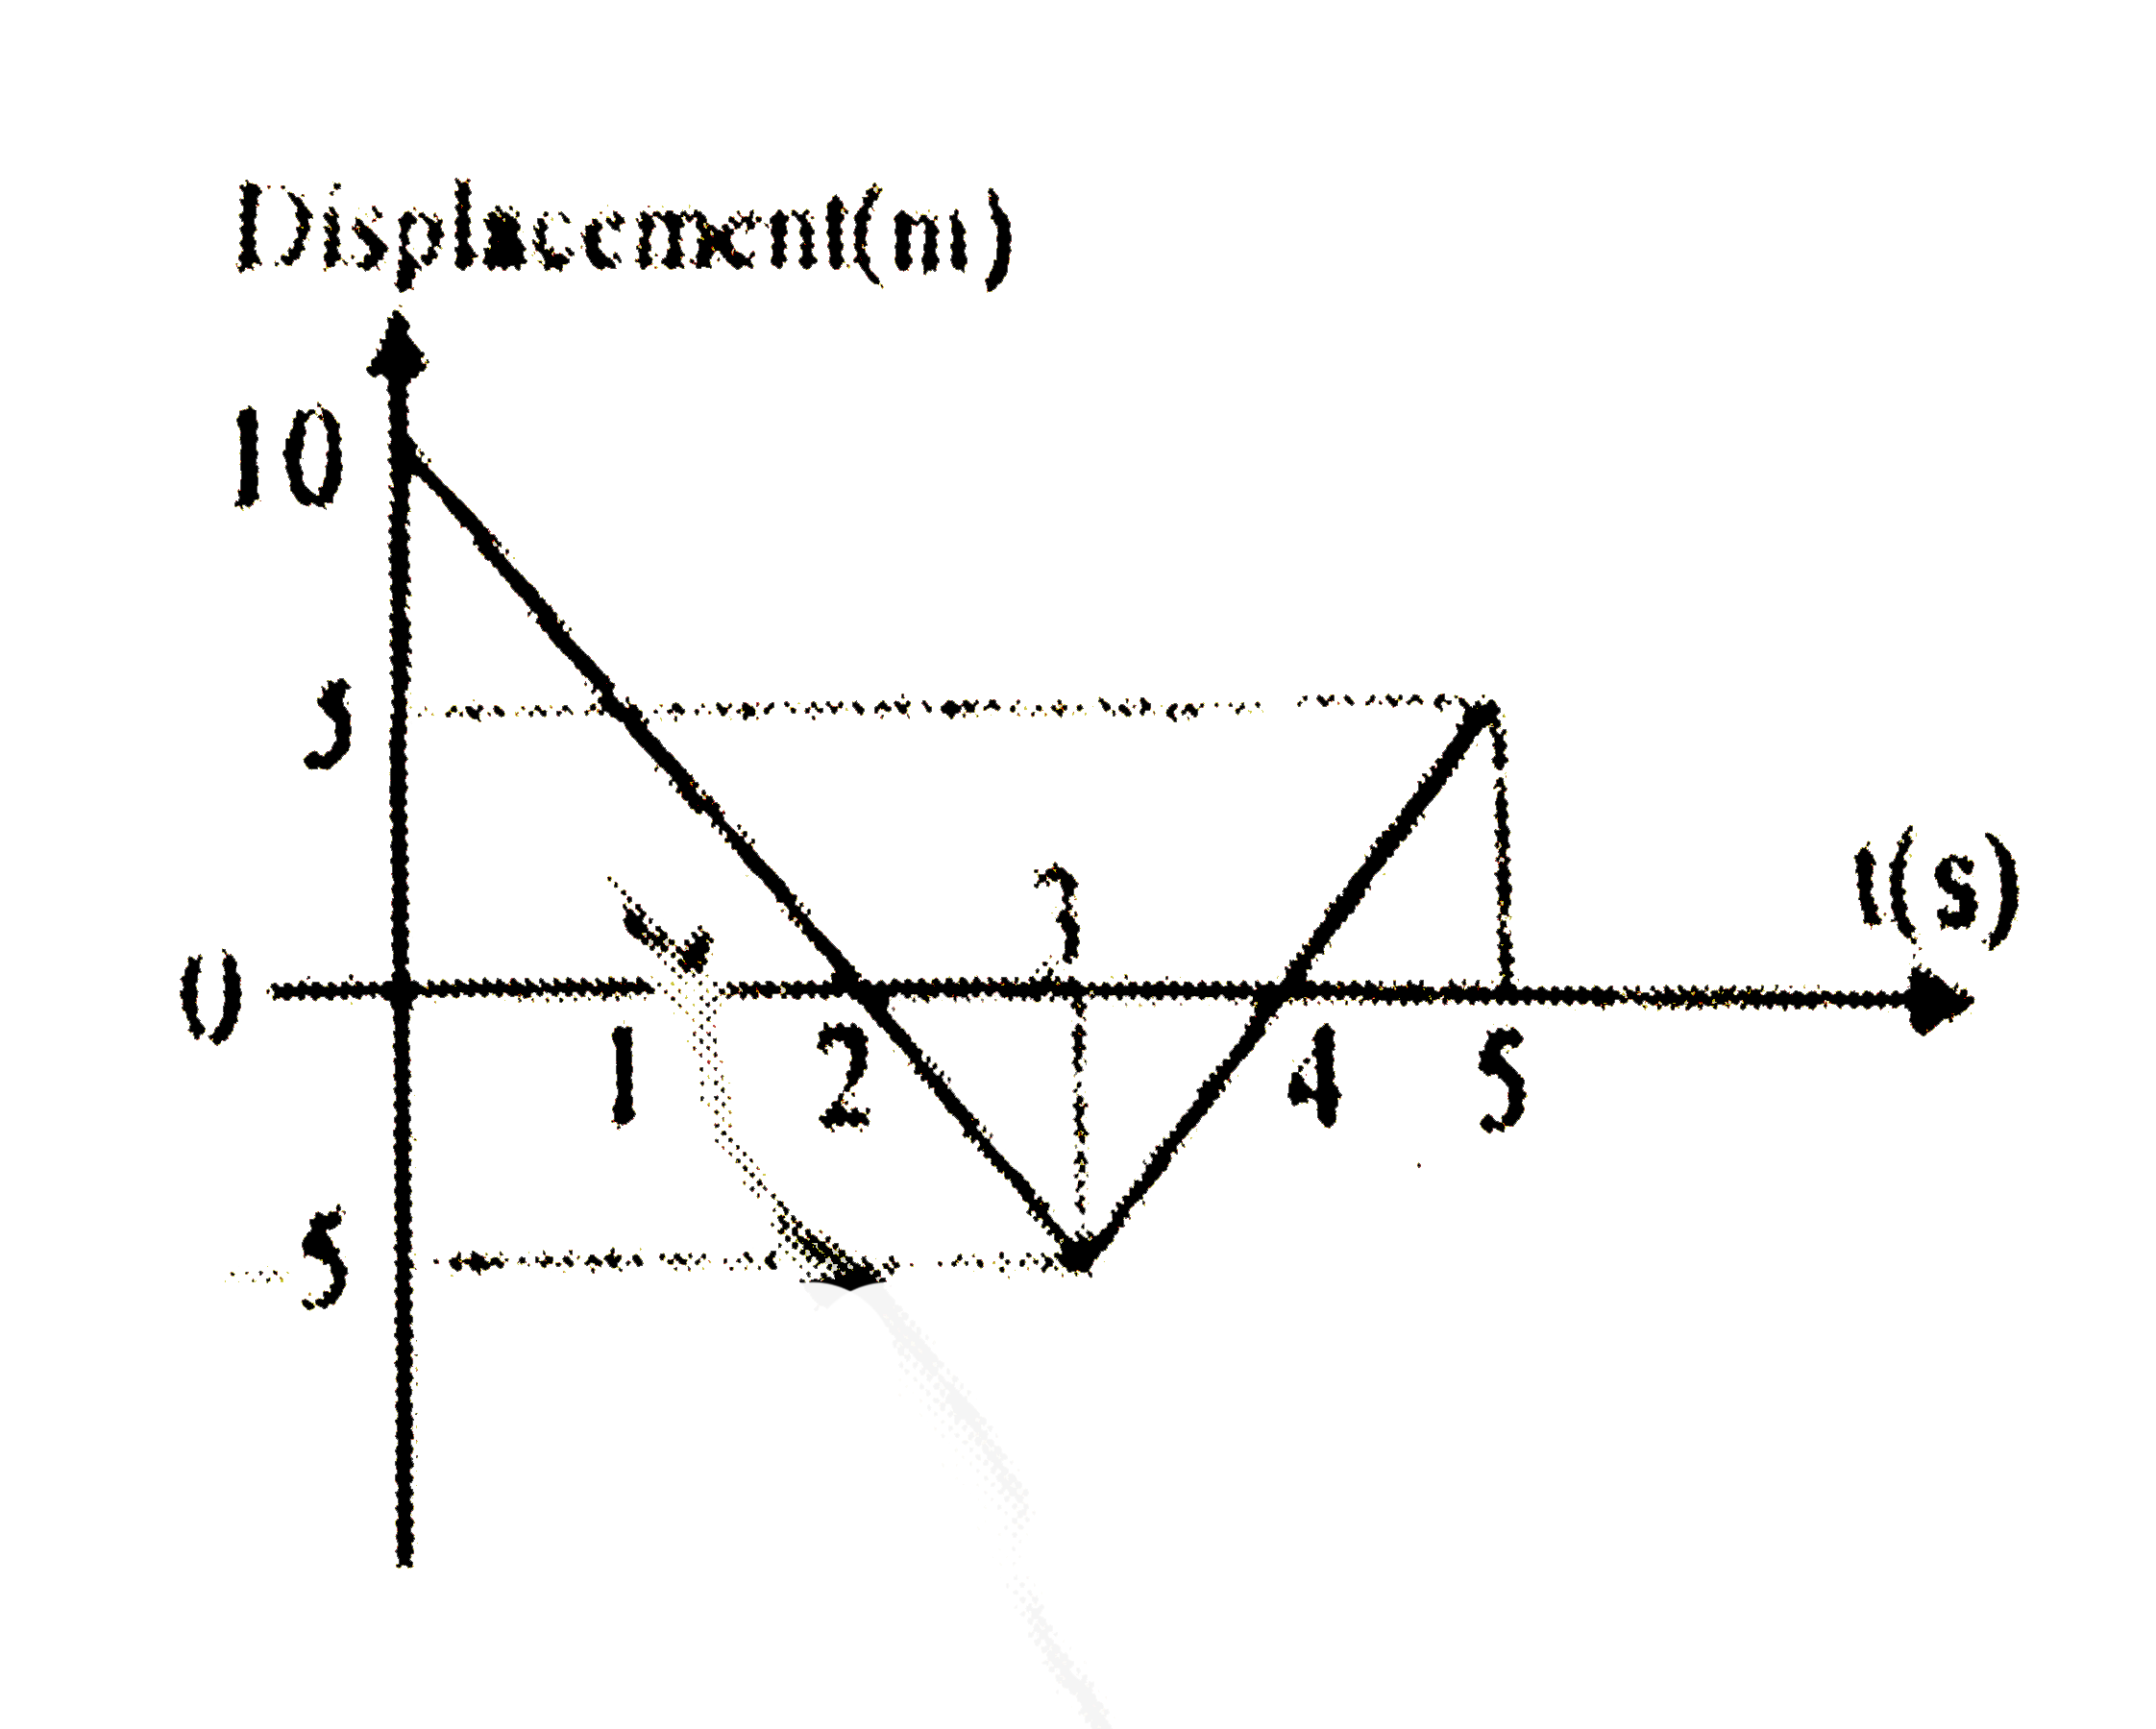
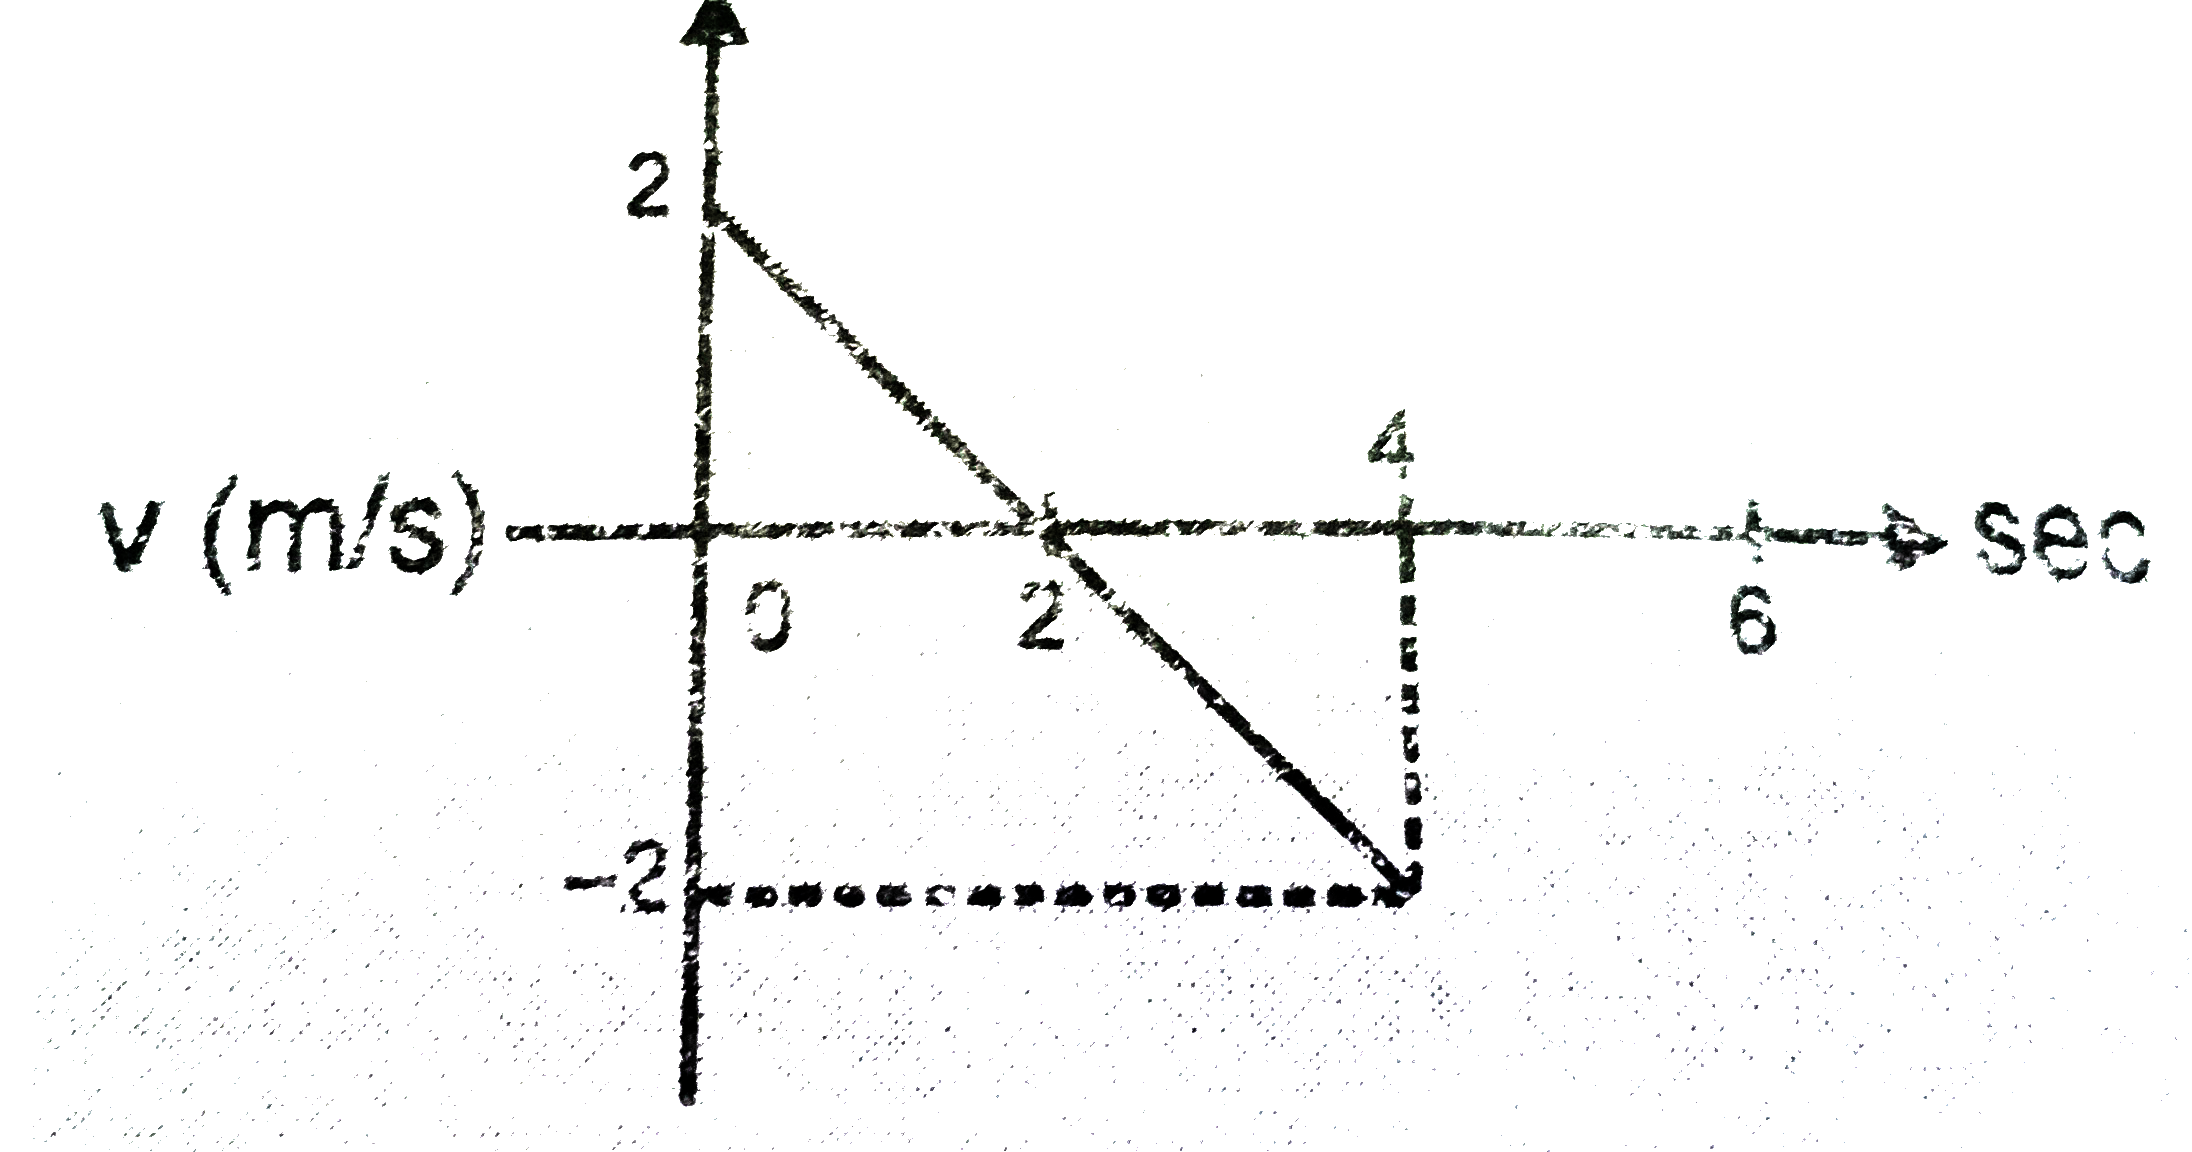
View SolutionVelocity time graph for a particle moving in a line is given.
Calculate the displacement of the particle and distance travelled in first 4 seconds.
View SolutionThe velocity and time graph for a particle moving in a straight line s shown in the figure. Then, the average velocity between t=4 s and t=6 s is _____
View SolutionFigure shows the velocity time graph for a particle travelling along a straight line. The magnitude of average velocity (in m/s) of particle during the time interval from t=0 to t=6s is 10α. Find the value of α.
View Solution
