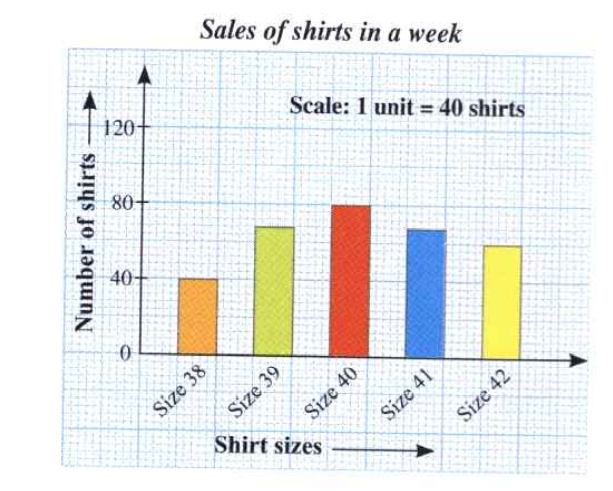
Read the following graph and answer the following question.
What is the mode is this data?
To find the mode of the data represented in the graph, follow these steps:
Step 1: Understand the Graph
- The graph shows the number of books for the years 1989 to 1993.
- The x-axis represents the years, while the y-axis represents the number of books.
- The scale indicates that 1 centimeter equals 100 books.
Step 2: Extract Data Points
- From the graph, we can extract the following data points:
- 1989: Approximately 200 books
- 1990: Approximately 450 books
- 1991: Approximately 300 books
- 1992: Approximately 200 books
- 1993: Approximately 600 books
Step 3: Identify the Mode
- The mode is defined as the value that appears most frequently in a data set.
- In this case, we look for the year with the highest number of books.
- From the data points:
- 1989: 200 books
- 1990: 450 books
- 1991: 300 books
- 1992: 200 books
- 1993: 600 books
- The highest value is 600 books in 1993.
Step 4: Conclusion
- Therefore, the mode of this data is the year 1993, as it has the highest number of books.
Final Answer:
The mode of this data is 1993.
---
- The graph shows the number of books for the years 1989 to 1993.
- The x-axis represents the years, while the y-axis represents the number of books.
- The scale indicates that 1 centimeter equals 100 books.
- From the graph, we can extract the following data points:
- 1989: Approximately 200 books
- 1990: Approximately 450 books
- 1991: Approximately 300 books
- 1992: Approximately 200 books
- 1993: Approximately 600 books
- The mode is defined as the value that appears most frequently in a data set.
- In this case, we look for the year with the highest number of books.
- From the data points:
- 1989: 200 books
- 1990: 450 books
- 1991: 300 books
- 1992: 200 books
- 1993: 600 books
- The highest value is 600 books in 1993.
- Therefore, the mode of this data is the year 1993, as it has the highest number of books.
The mode of this data is 1993.
Topper's Solved these Questions
- DATA HANDLING AND MEASURES OF CENTRAL TENDENCYBOOK - ICSECHAPTER - DATA HANDLING AND MEASURES OF CENTRAL TENDENCYEXERCISE - EXERCIES 18.1
37 Videos
- DATA HANDLING AND MEASURES OF CENTRAL TENDENCYBOOK - ICSECHAPTER - DATA HANDLING AND MEASURES OF CENTRAL TENDENCYEXERCISE - EXERCIES 18.2
16 Videos
- CONSTRUCTIONS BOOK - ICSECHAPTER - CONSTRUCTIONS EXERCISE - REVISION EXERCISE
12 Videos
- DATA HANDLING BOOK - ICSECHAPTER - DATA HANDLING EXERCISE - EXERCISE 24D
13 Videos
Similar Questions
Read the following graph and answer the following question.
What are the different sizes of shirts that are sold?

View SolutionRead the following graph and answer the following question.
Find the ratio of the number of shirts of size 38 sold to the number of shirts of size 42 sold.

View SolutionRead the following bar graph and answer the following questions: What information is given by the bar graph? In which year the export is minimum ? In which year the import is maximum ? In which year the difference of the values of export and import is maximum?
View SolutionRead the following bar graph (Figure) and answer the following questions: What is the information given by the bar graph? State each of the following whether true or false. The number of government companies in 1957 is that of 1982 is 1:9. The number of government companies have decreased over the year 1957 to 1983
View SolutionAnswer the following questions :
What is fermentation ?
View SolutionRead the following bar graph and answer the following questions: What information is given by the bar graph? Which state is the largest producer of rice? Which state is the largest producer of wheat? Which state has total production of rice and wheat as its maximum? Which state has the total production of wheat and rice minimum?
View SolutionRead the following bar graph shown in Figure and answer the following questions: What is the information given by the bar graph? In which month was the sale of the book maximum? In which month was the sale of the book minimum? What is the total sale of the book during these five months?
View SolutionRead the following bar graph shown in Figure and answer the following questions: What is the information given by the bar graph? In which month was the sale of the book maximum? In which month was the sale of the book minimum? What is the total sale of the book during these five months?
View SolutionRead the following bar graph (Figure) and answer the following questions: What information is given by the bar graph? What was the production of cement in the year 1980-81? What is the minimum and maximum productions of cement and corresponding years?
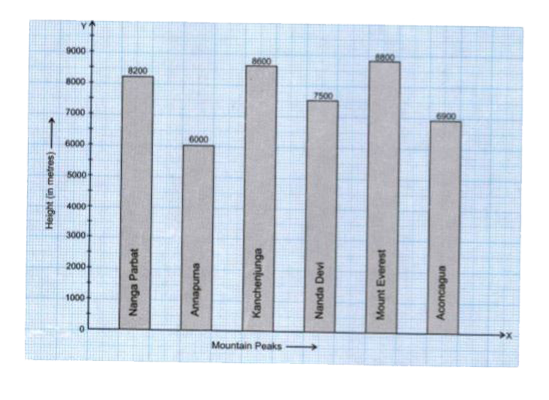
View SolutionGiven below is a bar graph showing the heights of six mountain peaks.

Read the above bar diagram and answer the following questions :
What is the highest mountain peak?
View Solution
