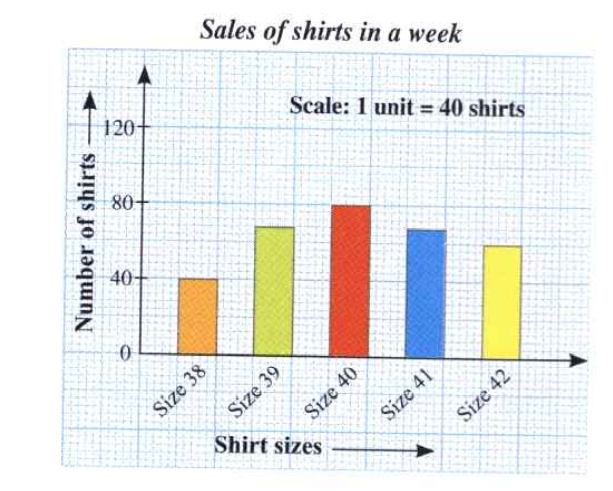
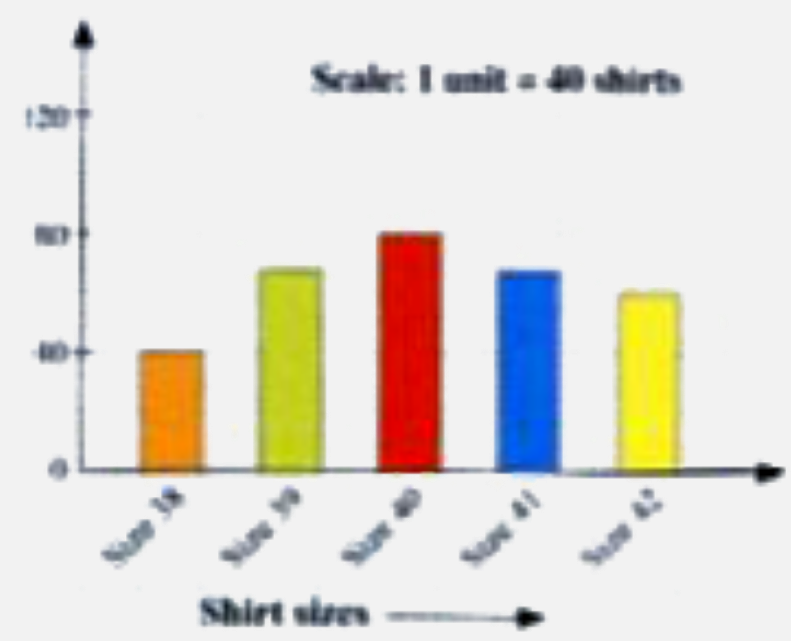
Read the following graph and answer the following question.
Which shirt size sells the minimum?
To determine which shirt size sells the minimum, we will analyze the data presented in the graph step by step.
Step 1: Identify the Shirt Sizes
First, we need to identify the different shirt sizes represented on the graph. Typically, these sizes include Extra Small (XS), Small (S), Medium (M), and Large (L).
Hint: Look for labels on the x-axis of the graph that indicate the shirt sizes.
Step 2: Examine the Sales Data
Next, we will examine the sales data for each shirt size. The y-axis of the graph represents the number of shirts sold. We will look at the height of the bars corresponding to each shirt size.
Hint: Compare the heights of the bars for each shirt size to see which one is the shortest.
Step 3: Compare the Number of Shirts Sold
Now, we will compare the number of shirts sold for each size:
- Extra Small (XS): Approximately 5-10 shirts sold.
- Small (S): More than 40 shirts sold.
- Medium (M): Close to 150 shirts sold.
- Large (L): Between 60 to 80 shirts sold (around 70 shirts).
Hint: Write down the approximate numbers for each size to make comparison easier.
Step 4: Identify the Minimum
From the data analyzed, we can see that the Extra Small (XS) size has the lowest sales figures, with only about 5-10 shirts sold.
Hint: Look for the size with the least number of shirts sold when comparing the figures.
Conclusion
The shirt size that sells the minimum is Extra Small (XS).
Final Answer: Extra Small (XS) sells the minimum.
First, we need to identify the different shirt sizes represented on the graph. Typically, these sizes include Extra Small (XS), Small (S), Medium (M), and Large (L).
Next, we will examine the sales data for each shirt size. The y-axis of the graph represents the number of shirts sold. We will look at the height of the bars corresponding to each shirt size.
Now, we will compare the number of shirts sold for each size:
- Extra Small (XS): Approximately 5-10 shirts sold.
- Small (S): More than 40 shirts sold.
- Medium (M): Close to 150 shirts sold.
- Large (L): Between 60 to 80 shirts sold (around 70 shirts).
From the data analyzed, we can see that the Extra Small (XS) size has the lowest sales figures, with only about 5-10 shirts sold.
The shirt size that sells the minimum is Extra Small (XS).
Topper's Solved these Questions
- DATA HANDLING AND MEASURES OF CENTRAL TENDENCYBOOK - ICSECHAPTER - DATA HANDLING AND MEASURES OF CENTRAL TENDENCYEXERCISE - EXERCIES 18.1
37 Videos
- DATA HANDLING AND MEASURES OF CENTRAL TENDENCYBOOK - ICSECHAPTER - DATA HANDLING AND MEASURES OF CENTRAL TENDENCYEXERCISE - EXERCIES 18.2
16 Videos
- CONSTRUCTIONS BOOK - ICSECHAPTER - CONSTRUCTIONS EXERCISE - REVISION EXERCISE
12 Videos
- DATA HANDLING BOOK - ICSECHAPTER - DATA HANDLING EXERCISE - EXERCISE 24D
13 Videos
Similar Questions
Read the following graph and answer the following question.
What are the different sizes of shirts that are sold?

View SolutionRead the following graph and answer the following question.
Find the ratio of the number of shirts of size 38 sold to the number of shirts of size 42 sold.

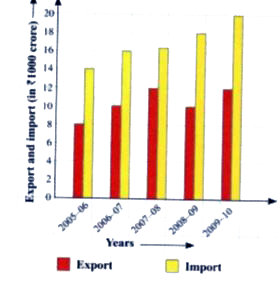
View SolutionRead the following bar graph and answer the following questions: What information is given by the bar graph? In which year the export is minimum ? In which year the import is maximum ? In which year the difference of the values of export and import is maximum?
View SolutionRead the following bar graph and answer the following questions: What information is given by the bar graph? Which state is the largest producer of rice? Which state is the largest producer of wheat? Which state has total production of rice and wheat as its maximum? Which state has the total production of wheat and rice minimum?
View SolutionRead the following bar graph (Figure) and answer the following questions: What is the information given by the bar graph? State each of the following whether true or false. The number of government companies in 1957 is that of 1982 is 1:9. The number of government companies have decreased over the year 1957 to 1983
View SolutionRead the following bar graph shown in Figure and answer the following questions: What is the information given by the bar graph? In which month was the sale of the book maximum? In which month was the sale of the book minimum? What is the total sale of the book during these five months?
View SolutionRead the following bar graph shown in Figure and answer the following questions: What is the information given by the bar graph? In which month was the sale of the book maximum? In which month was the sale of the book minimum? What is the total sale of the book during these five months?
View SolutionThe following graph gives the minimum and maximum temperatures of various cities on a specific day. Read the graph and answer the following questions
Name the city which has the minimum difference between its minimum and maximum temperatures.

View SolutionRead the following bar graph (Figure) and answer the following questions: What information is given by the bar graph? What was the production of cement in the year 1980-81? What is the minimum and maximum productions of cement and corresponding years?
View SolutionRead the bar graph and answer the following questions.
In which year the difference of the values of export and import is maximum?

View Solution
