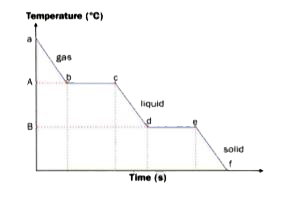
Look at the change of state diagram from gas to solid given here carefully, and answer the following questions.
a. During freezing, certain amount of heat is given out without any change in temperature. Which part of the graph shows this change?
b. During condensation, certain amount of heat is given out without any change in temperature. Which part of the graph shows this change?
c. Which point on the graph corresponds to
İ. condensation point? ii. freezing point?
d. What do ab and cd on the graph represent?

Step by step video & image solution for Look at the change of state diagram from gas to solid given here carefully, and answer the following questions. a. During freezing, certain amount of heat is given out without any change in temperature. Which part of the graph shows this change? b. During condensation, certain amount of heat is given out without any change in temperature. Which part of the graph shows this change? c. Which point on the graph corresponds to İ. condensation point? ii. freezing point? d. What do ab and cd on the graph represent? by Physics experts to help you in doubts & scoring excellent marks in Class 8 exams.
Updated on:21/07/2023Similar Questions
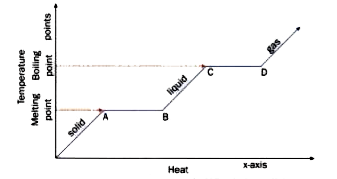
Observe the graph given below and answer the following questions:

During melting of a solid, certain amount of heat is absorbed without any change in temperature. Which part of the graph shows this change?
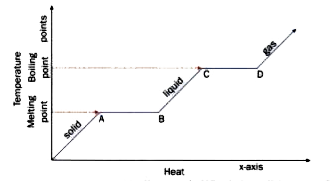
View SolutionObserve the graph given below and answer the following questions:

During vaporization of a liquid, certain amount of heat is absorbed without any change in temperature. Which part of the graph shows this change?
View Solution
Knowledge Check
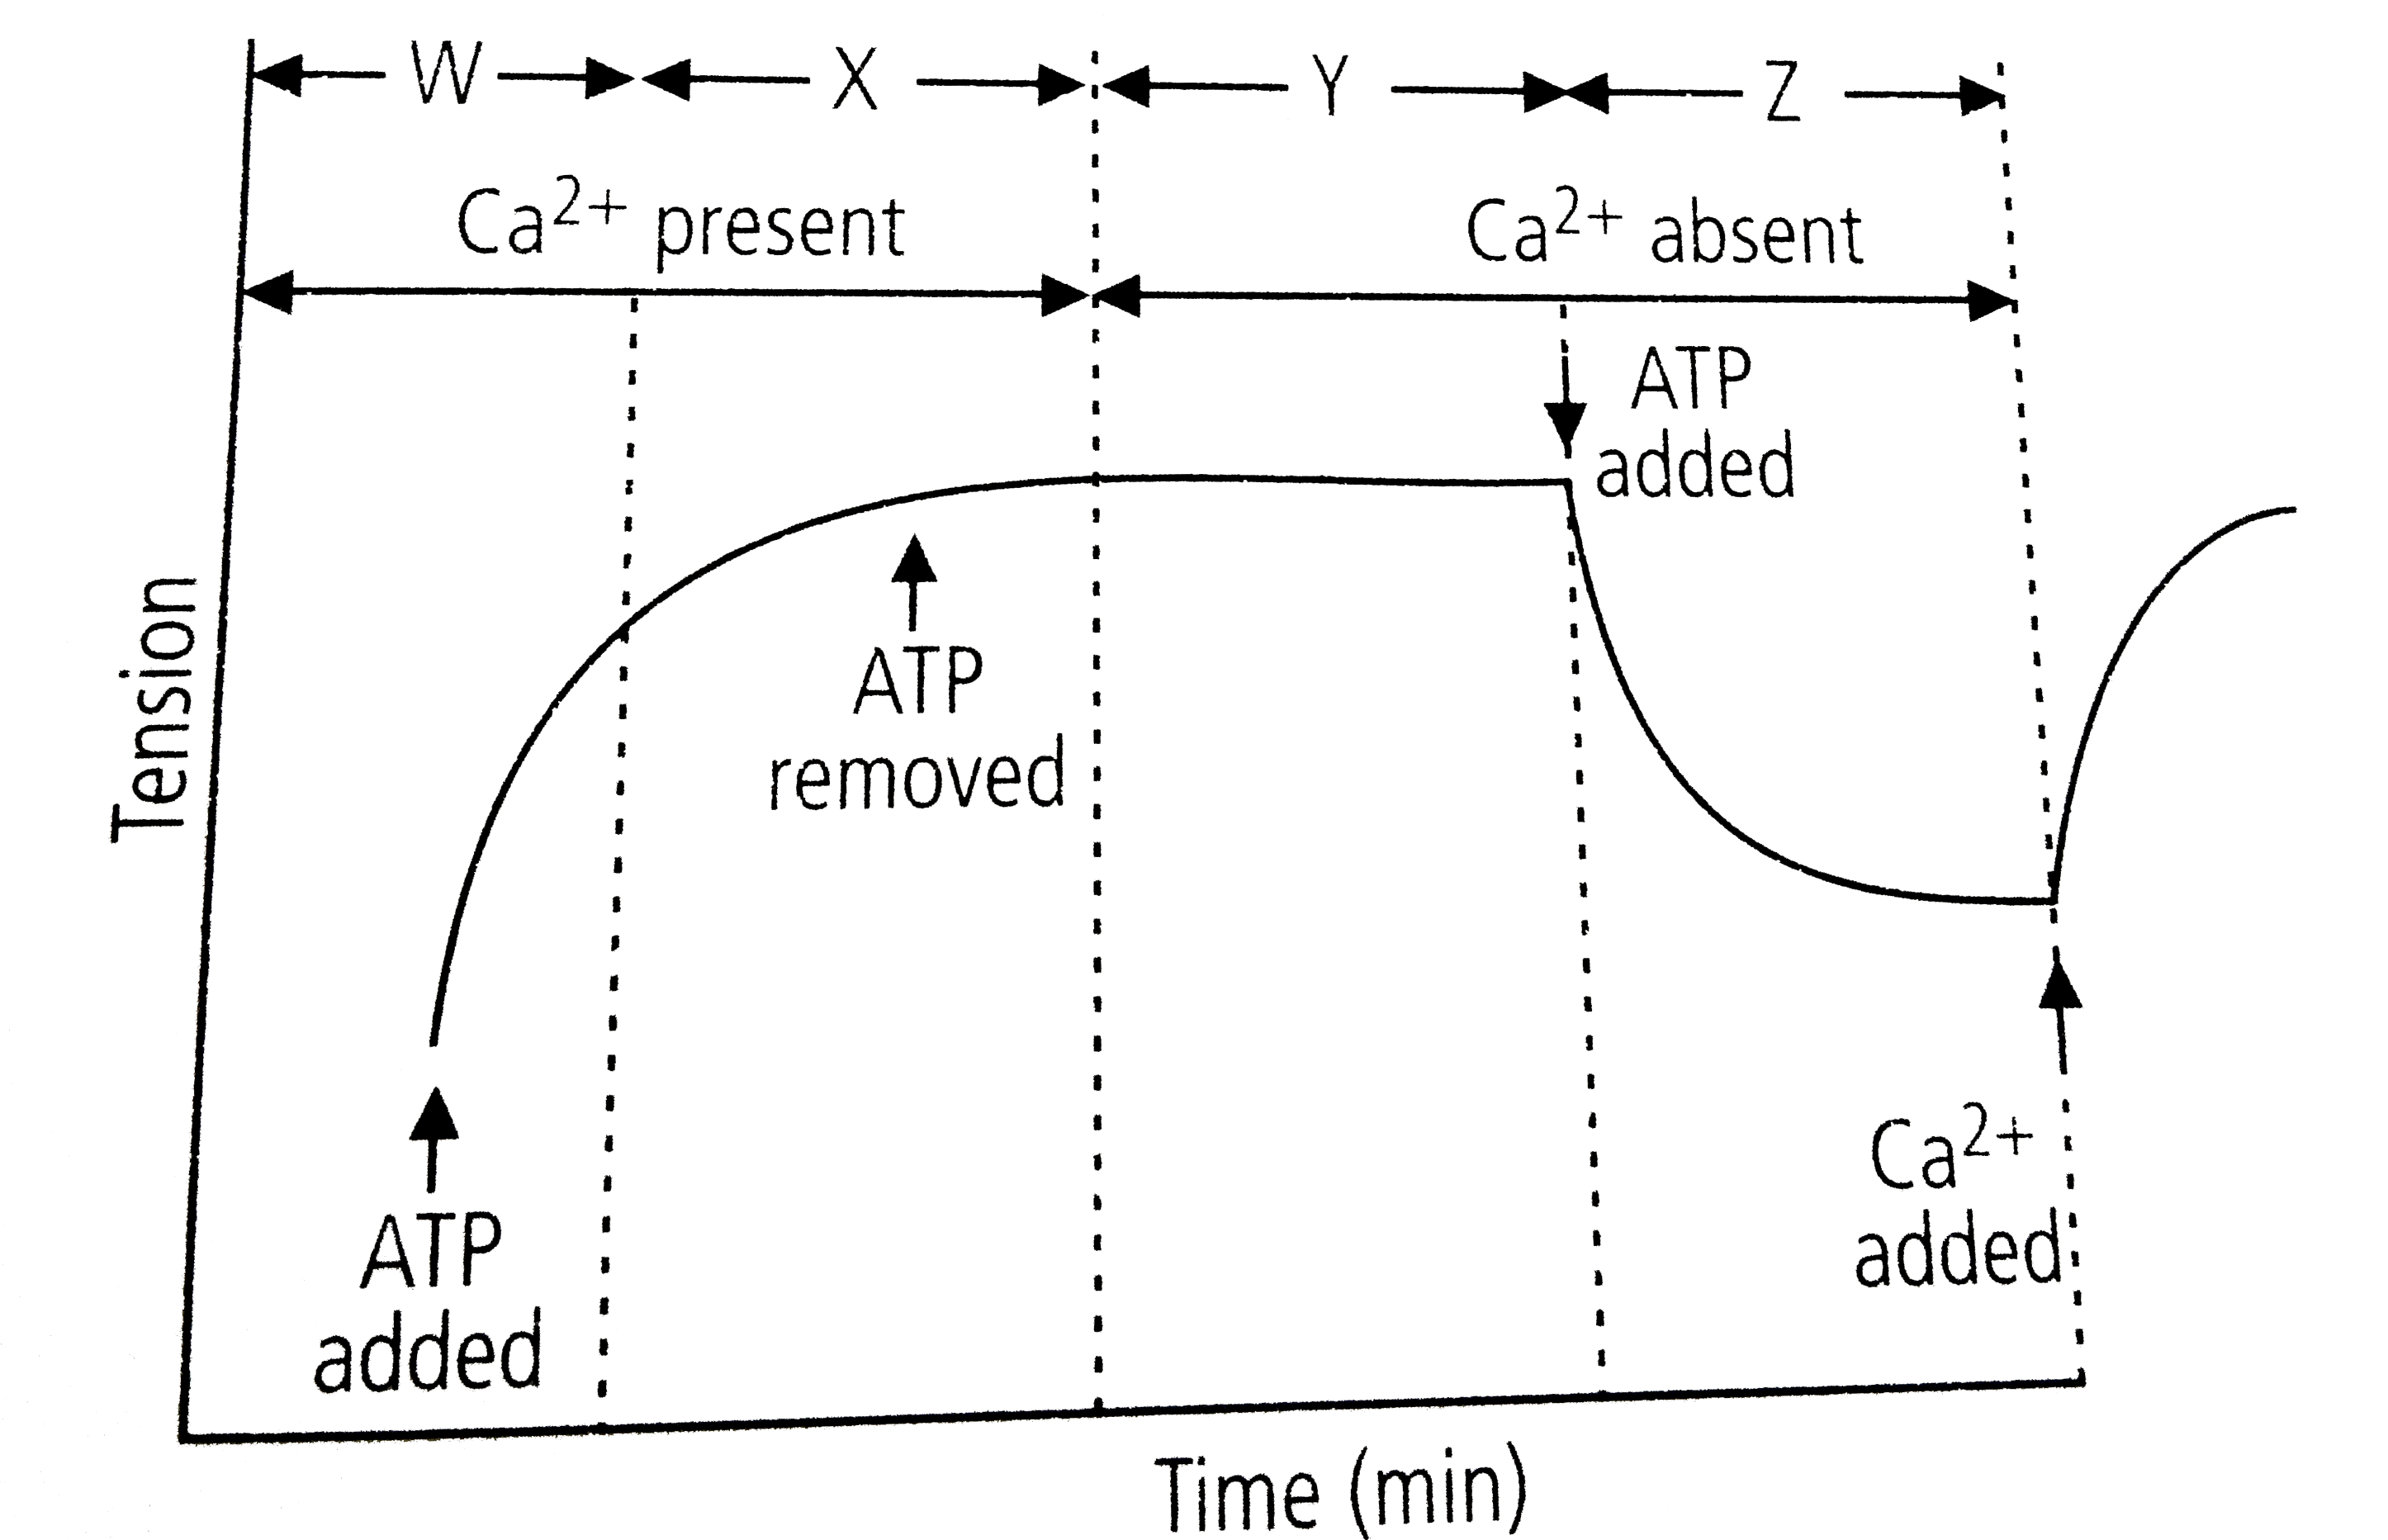
Refer to the given graph carefully and answer the following question.

Which of the labelled parts on the graph represents rigor mortis?AXBWCZDYSolutions which distil without any change in composition and temperature are called:
AIdealBSuper saturatedCAzeotropic mixtureDIsotonic
The change of state from liquid to solid by the release of heat ………..
View SolutionLook at the given figure and answer the following questions:

What change in temperature is seen when this change takes place?
View SolutionLook at the given figure and answer the following questions:

What is the quantity of heat absorbed by the ice to change its state?
View SolutionChange in state when enough heat is given to a solid.
View SolutionSolution distilled without change in composition at a temperature is called
View SolutionLook at the given figure and answer the following questions:

When ice changes into water, which phenomenon takes place?
View Solution