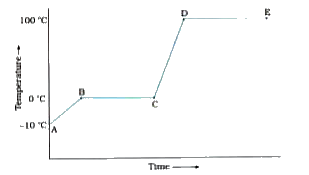
Study temperature -time graph given below:

The graph shows heating of ice form −10∘C to water at 100∘C. Identify the part of the graph which represents the change of state on heating. During change of state where does the absorbed heat energy go?
Text Solution
Parts BC and DE of the graph represents the change of state on heating.
The heat energy supplied during the change of state is used to overcome the force of attraction between the particles or matter. This heat is known as latent heat. [The heat energy is stored in water at0∘C in the form of latent heat of fusion and is stored in steam at100∘C in the form of latent heat of vaporisation.]
|
Topper's Solved these Questions
- MATTER IN OUR SURROUNDINGSBOOK - KUMAR PRAKASHANCHAPTER - MATTER IN OUR SURROUNDINGSEXERCISE - VALUE BASED QUESTIONS WITH ANSWER
2 Videos
- IS MATTER AROUND US PUREBOOK - KUMAR PRAKASHANCHAPTER - IS MATTER AROUND US PUREEXERCISE - QUESTIONS BASED ON PRACTICAL SKILLS WITH ANSWERS (ANSWER THE FOLLOWING AS ASKED)
8 Videos
- QUESTION PAPER 01BOOK - KUMAR PRAKASHANCHAPTER - QUESTION PAPER 01EXERCISE - SECTION - A
1 Video
Similar Questions
Knowledge Check
The graph given below represents the interconversion of ice to water vapour. Identify the point in the curve which indicates the boiling point of water.
 ABBACCDD
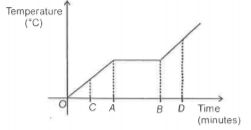
For the following temperature-time graph, in which region the state of material changes
 AOCBABCBODCA
In which of the following reaction does the heat change represent the heat of formation of water ?
A2H2(g)+O2(g)→2H2O(l),ΔH=−116kcalBH2(g)+12O2(g)→H2O(l),ΔH=−58kcalCH+(aq.)+OH−(aq.)→2H2O(l),ΔH=−13.7kcalDC2H2(g)+212O2(g)→2CO2(g)+H2O(l),ΔH=−310kcal
A given mass of water is cooled from 10∘C to 0∘C. State the volume changes observed. Represent these changes on a temperature volume graph.
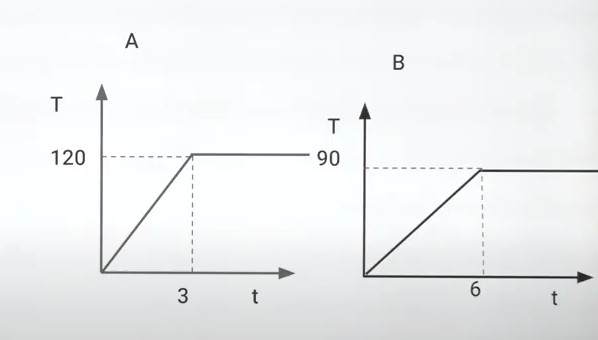
View SolutionTemperature vs. time graphs are given below for 2 substances. Compare specific heat capacity

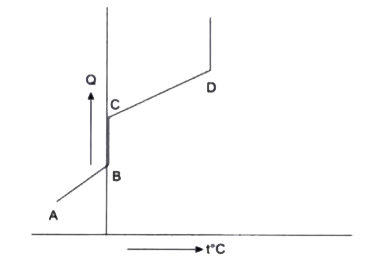
View SolutionWhy does the heat supplied to a substance during its change of state not cause any rise in its temperature?
View SolutionState the volume changes observed when a givenmass of water is heated from 0∘C to 10∘C. Sketch a temperature volume graph to show the behaviour.
View SolutionIn which of the following reaction does the heat change represent the heat of formation of water ?
View Solution
