You are given the following data, obtain the regression equation and estimate the yield of crops when the rainfall is 29cm. Given that coefficient of correlation between yield and rainfall= 0.52

The correct Answer is:x= 29cm, y= 517.97kg
Step by step video & image solution for You are given the following data, obtain the regression equation and estimate the yield of crops when the rainfall is 29cm. Given that coefficient of correlation between yield and rainfall= 0.52 by Maths experts to help you in doubts & scoring excellent marks in Class 12 exams.
Updated on:21/07/2023Topper's Solved these Questions
Similar Questions
By using the data ¯x=25,¯y=30,byx=1.6andbxy=0.4 find
(a) The regression equation y on x.
(b) What is the most likely value of y when x=60?
(c ) What is the coefficient of correlation between x and y ?
View SolutionYou are given the following data:

Correlation coefficient between x and y=0.66. Find the equations of the lines of regression.
View Solution
Knowledge Check
If the regression equation of y x is given by x+ y =8 , then estimate the value of y when x is 3.5 .
A3B5.5C4.5DNone of theseIf the regression equation of y on x is −2x+5y=14 and the regression equation of x on y is given by mx−y+10=0. If the coefficient of correlation between x and y is 1√10, then the value of m is
A6B4C8D2
For 50 students of a class, regression equation of marks in statistics (x) on marks in Accountancy (y) in 3y−5x+180=0. The mean in Accoutancy is 44 and the variance of marks in statics is 9/16 of the varience of marks in Accountancy. Find the mean marks in Statistics and coefficient of correlation between marks in two subjects.
View SolutionThe rainfall and the output of wheat per acre for a firm are as follows:

Find the correlation coefficient between rainfall and wheat production.
View SolutionFind the equation of lines regression from the following data :

Correlation of coefficient =23
View SolutionGiven two regression lines 4x+3y+7=0and3x+4y+8=0, determine.
The coefficient of correlation
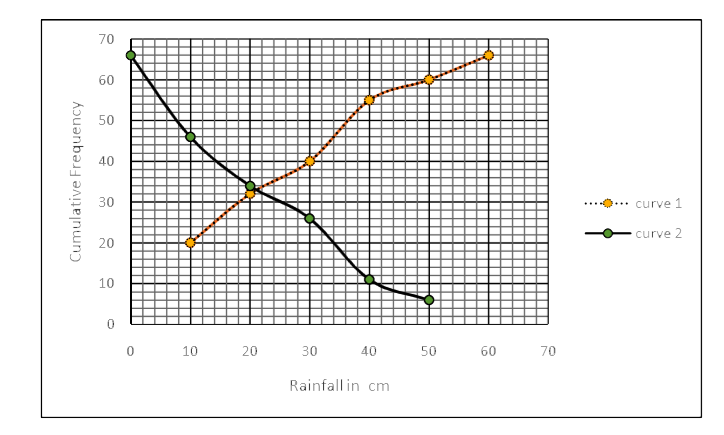
View SolutionA TV reporter was given a task to prepare a report on the rainfall of the city Dispur of India in a particular year. After collecting the data, he analyzed the data and prepared a report on the rainfall of the city. Using this report, he drew the following graph for a particular time period of 66 days

Based on the above graph, answer the following questions
(i) Identify less than type ogive and more than type ogive from the given graph.
(ii) Find the median rainfall of Dispur
(iii) Obtain the Mode of the data if mean rainfall is 23.4cm
View SolutionA mercury thermometer is to be made with glass tubing of internal bore 0.5 mm diameter and the distance between the fixed point is to be 20 cm. Estimate the volume of the bulb below the lower fixed point, given that the coefficient of cubical expansion of mercury is 0.00018/K. and the coefficient of linear expansion of glass is 0.000009/K.
View Solution
