Manoj appeared for ICSE examination 2018 and secured percentage of marks as shown in the following table :

Represent the above data by drawing a suitable bar graph.
Step by step video & image solution for Manoj appeared for ICSE examination 2018 and secured percentage of marks as shown in the following table : Represent the above data by drawing a suitable bar graph. by Maths experts to help you in doubts & scoring excellent marks in Class 8 exams.
Updated on:21/07/2023Topper's Solved these Questions
- DATA HANDLING BOOK - ICSECHAPTER - DATA HANDLING EXERCISE - EXERCISE 22 (A) ( Fill in the blanks : )
5 Videos
- CUBES AND CUBE - ROOTS BOOK - ICSECHAPTER - CUBES AND CUBE - ROOTS EXERCISE - EXERCISE 4(B)
39 Videos
- DIRECT AND INVERSE VARIATIONSBOOK - ICSECHAPTER - DIRECT AND INVERSE VARIATIONSEXERCISE - EXERCISE 10 (E)
19 Videos
Similar Questions
Knowledge Check
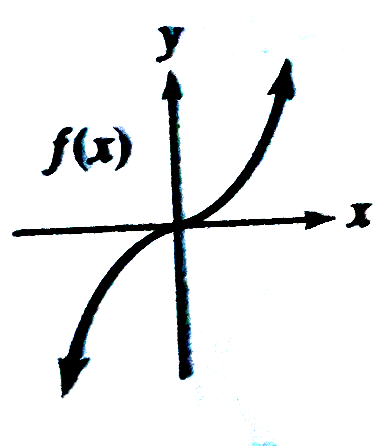
The graph of f(x) is shown above , Which of the following represents the graph of f(x-3) ?A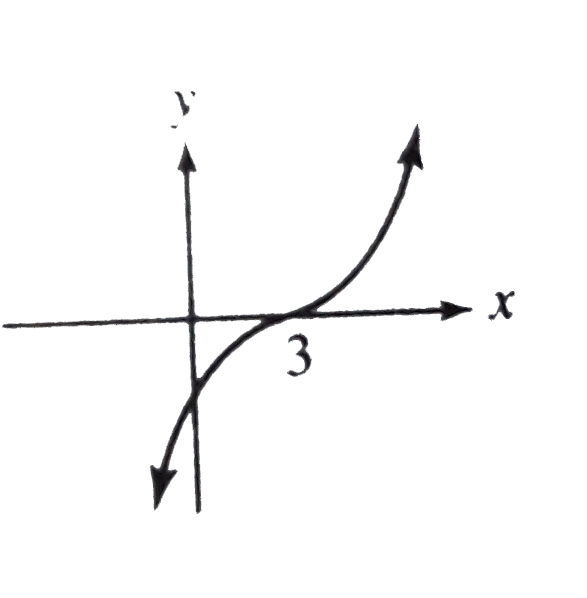 B
B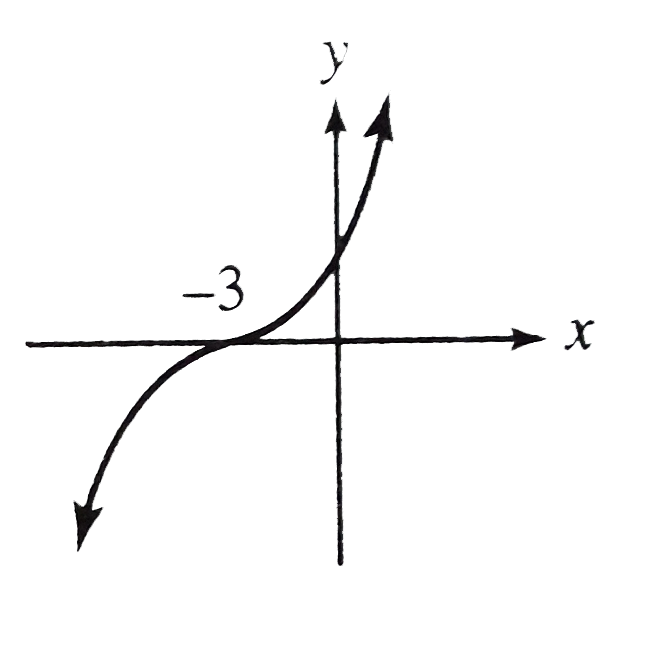 C
C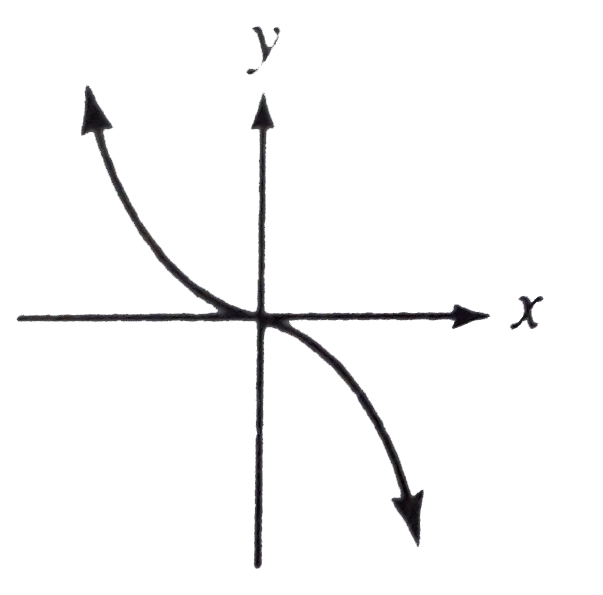 D
D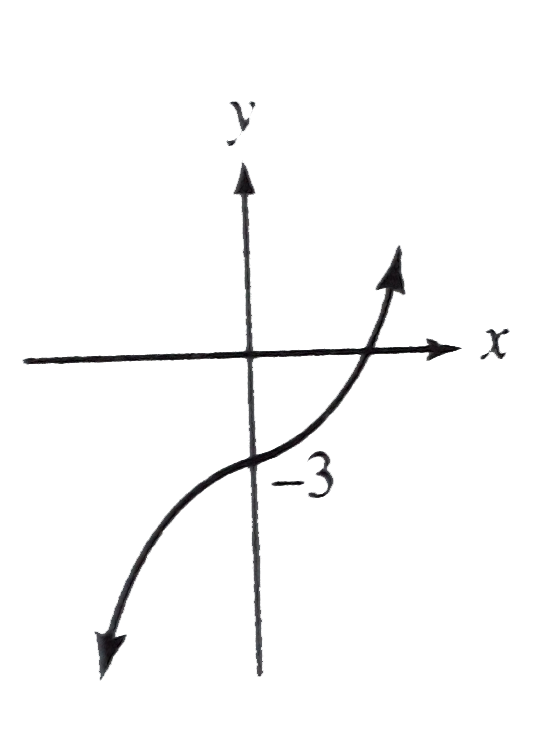
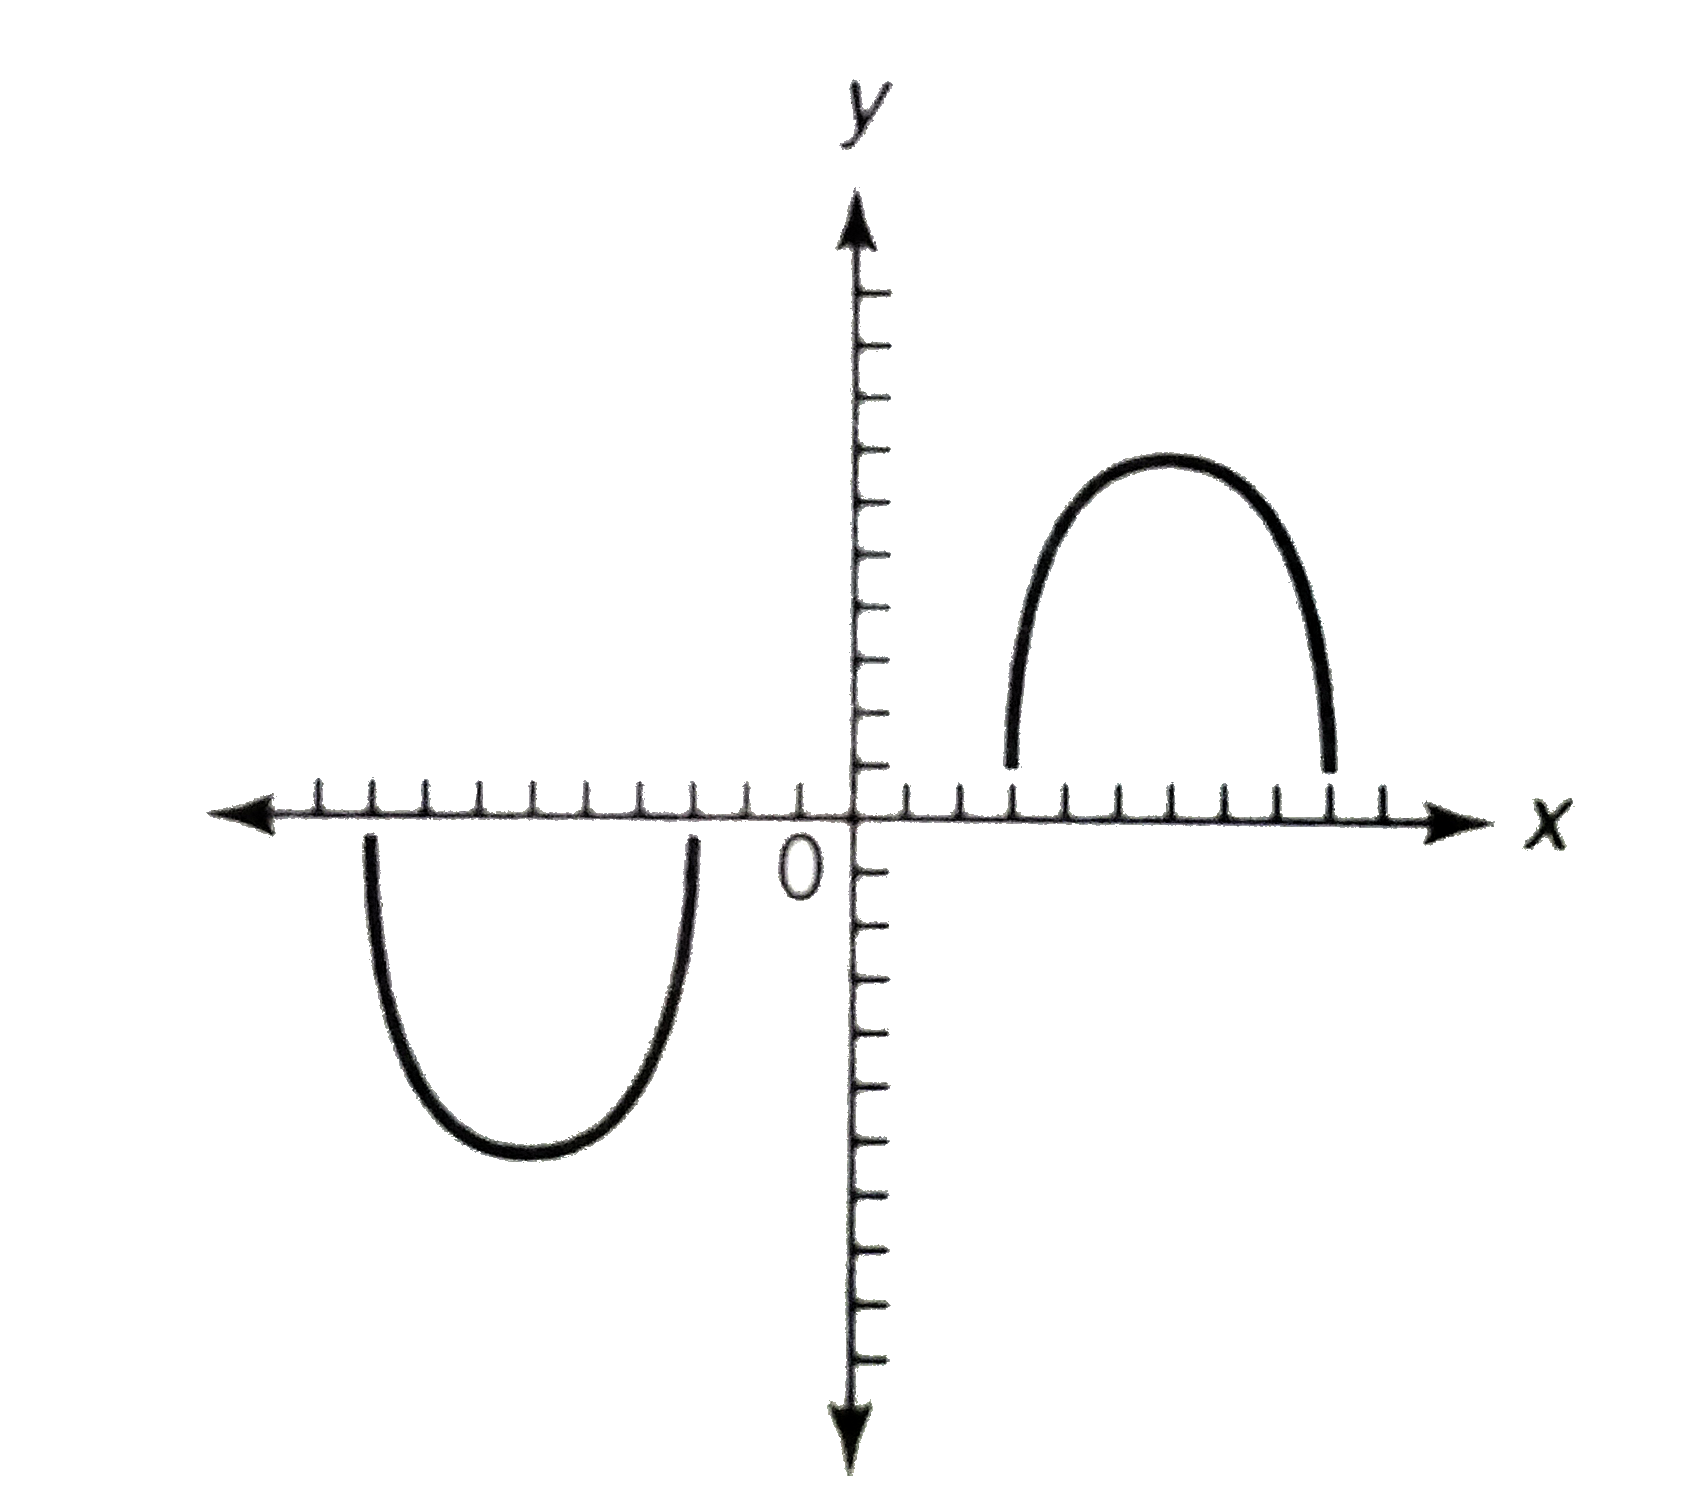
The graph of the function f is shown above. Which of the following could represent the graph of y=|f(x)|?A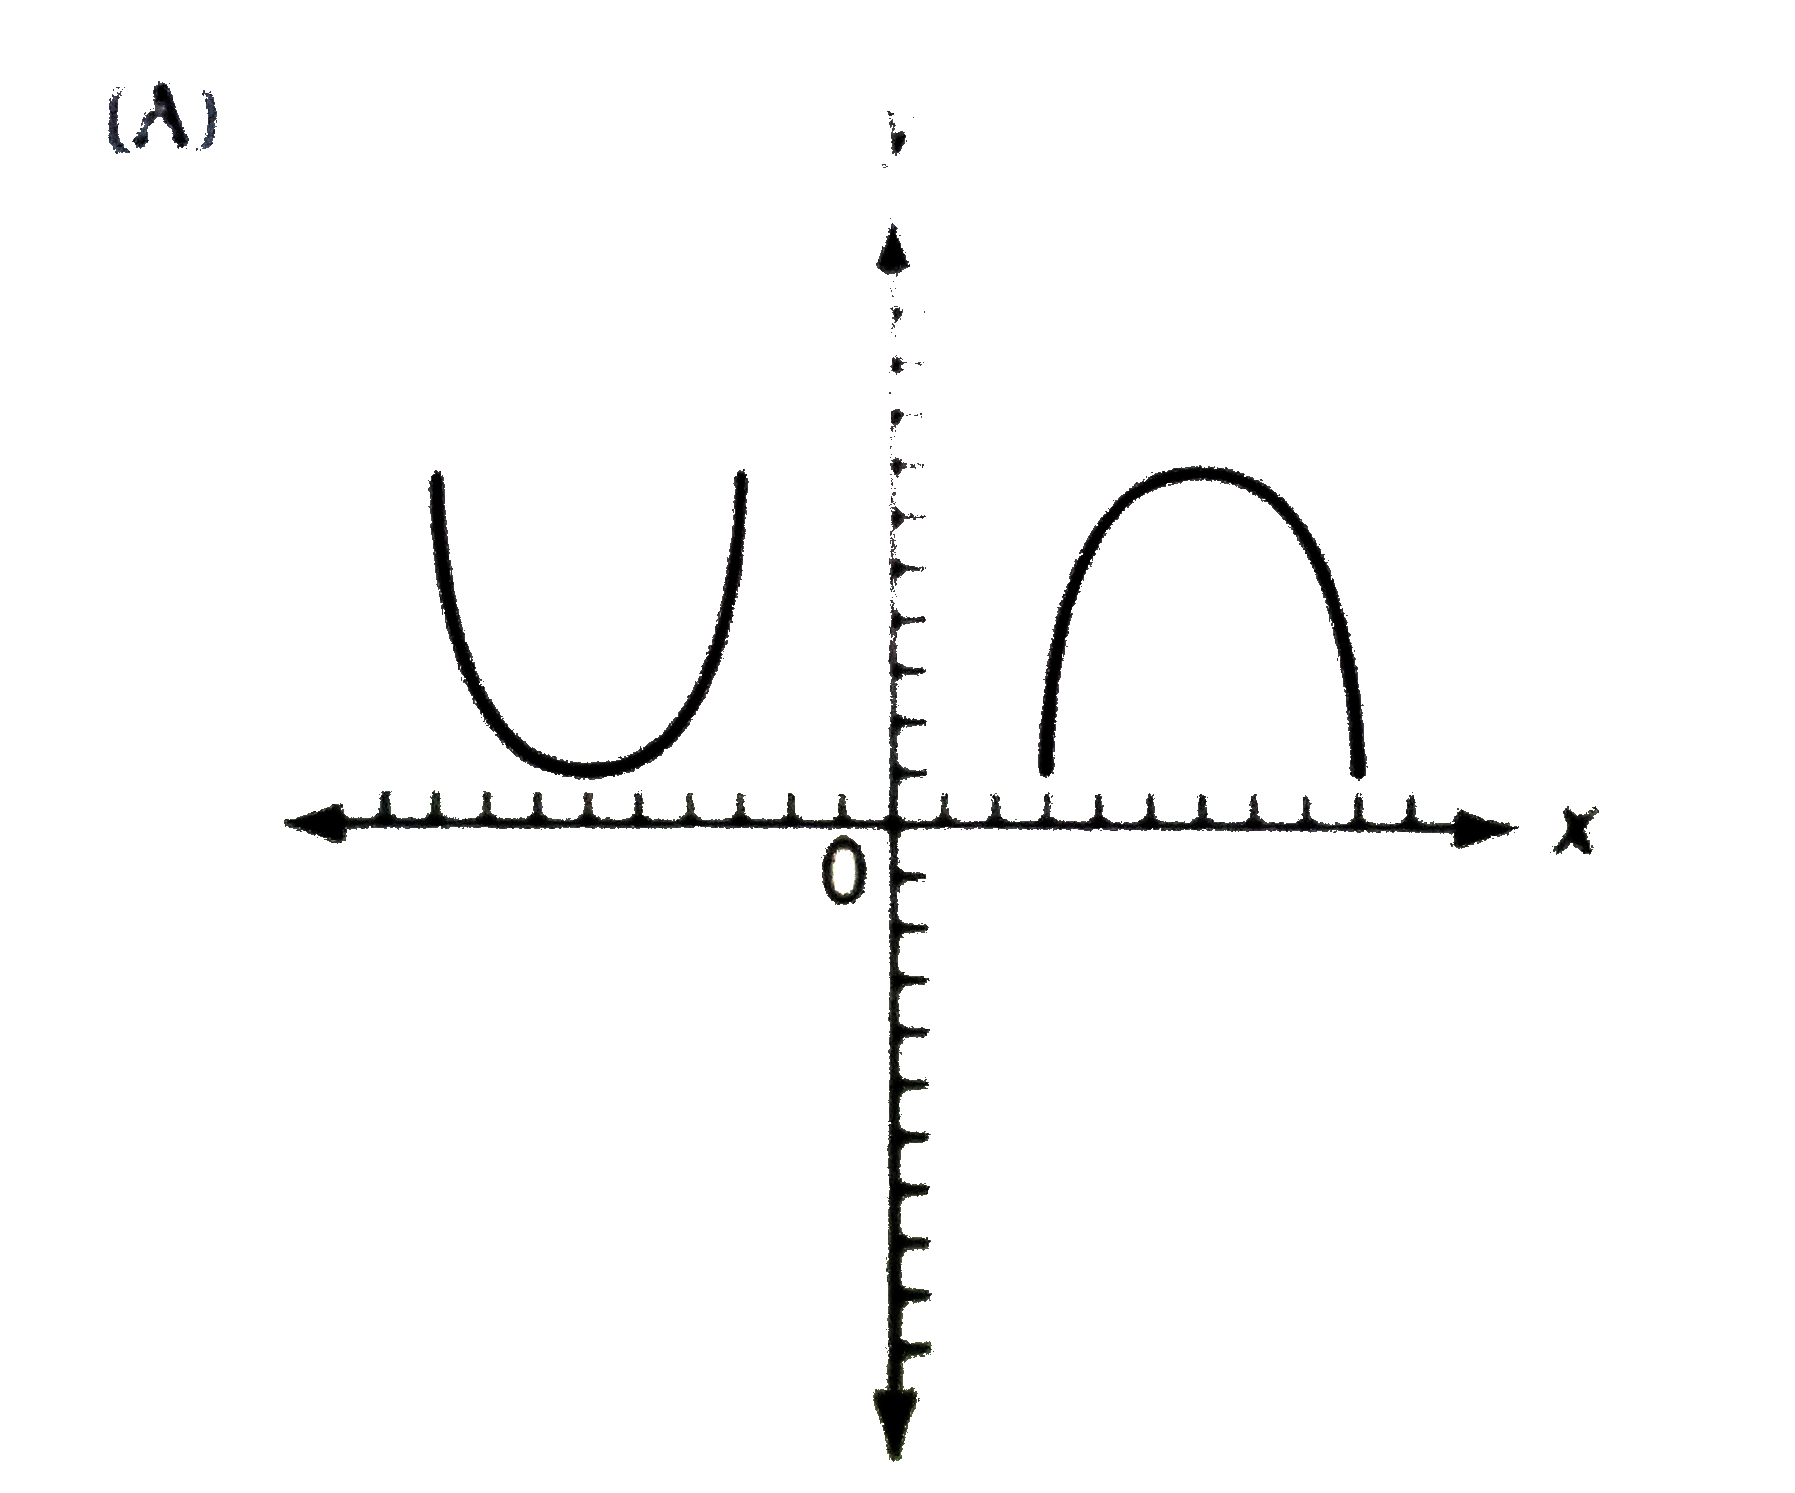 B
B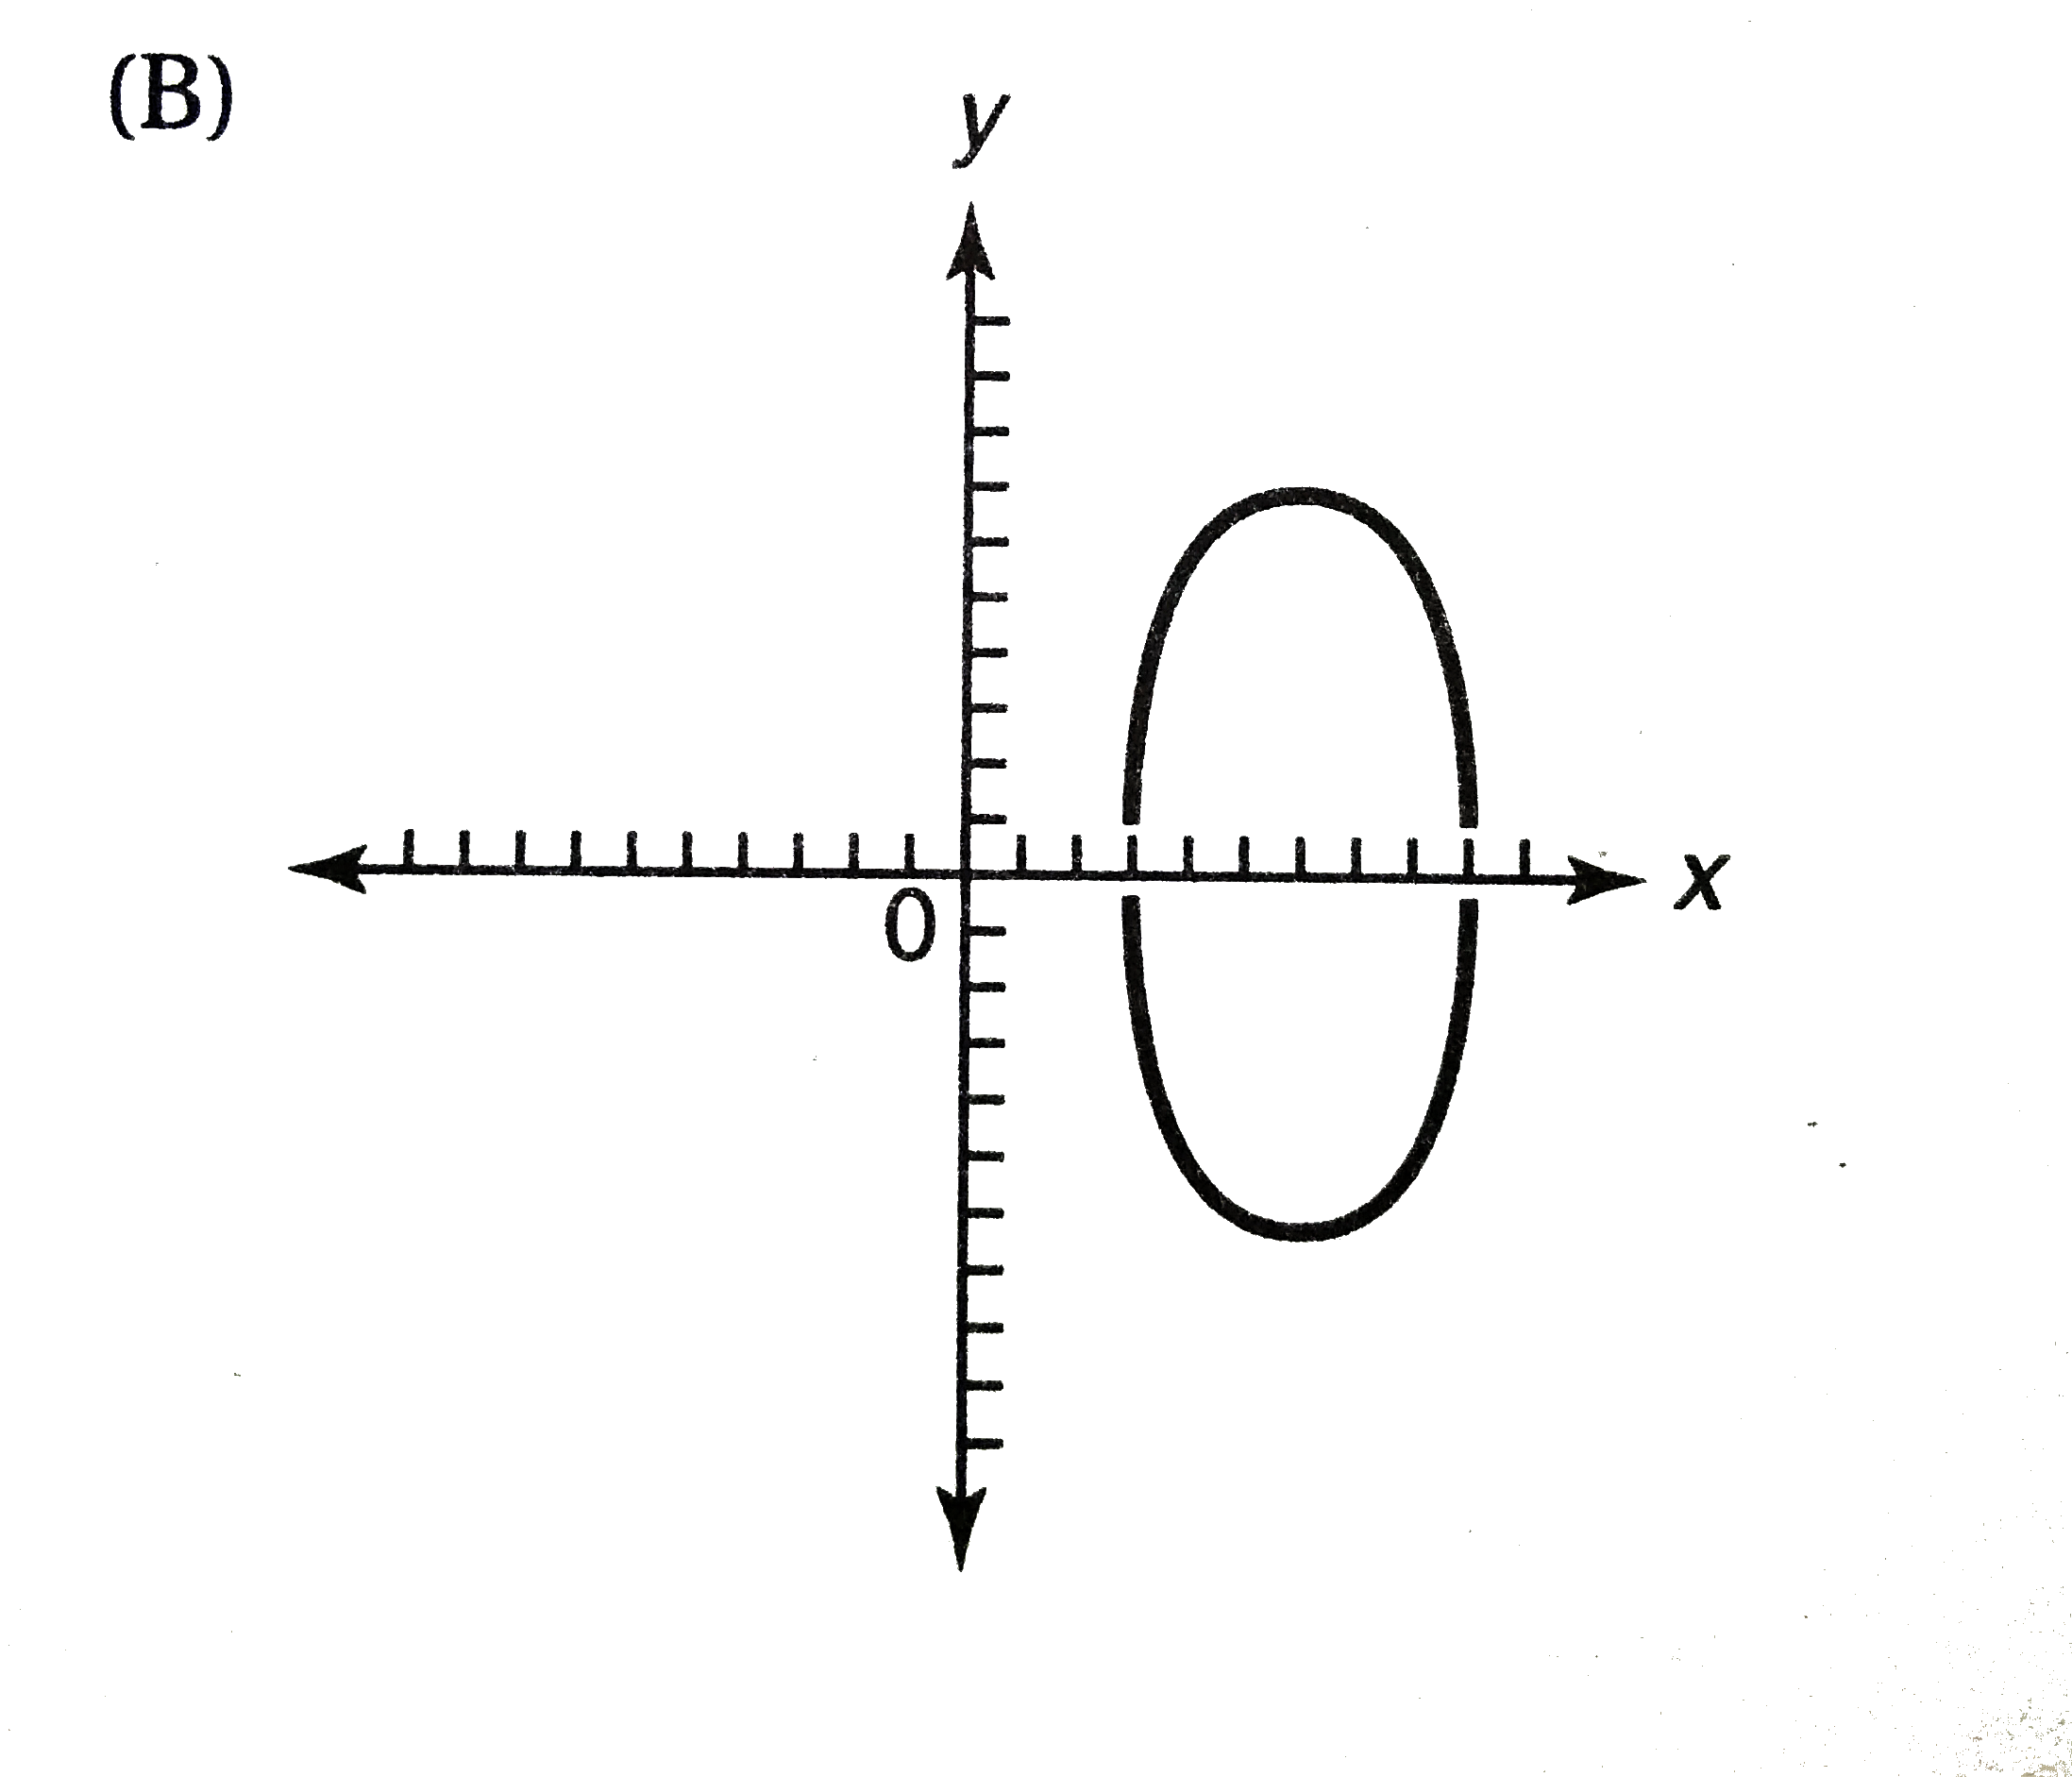 C
C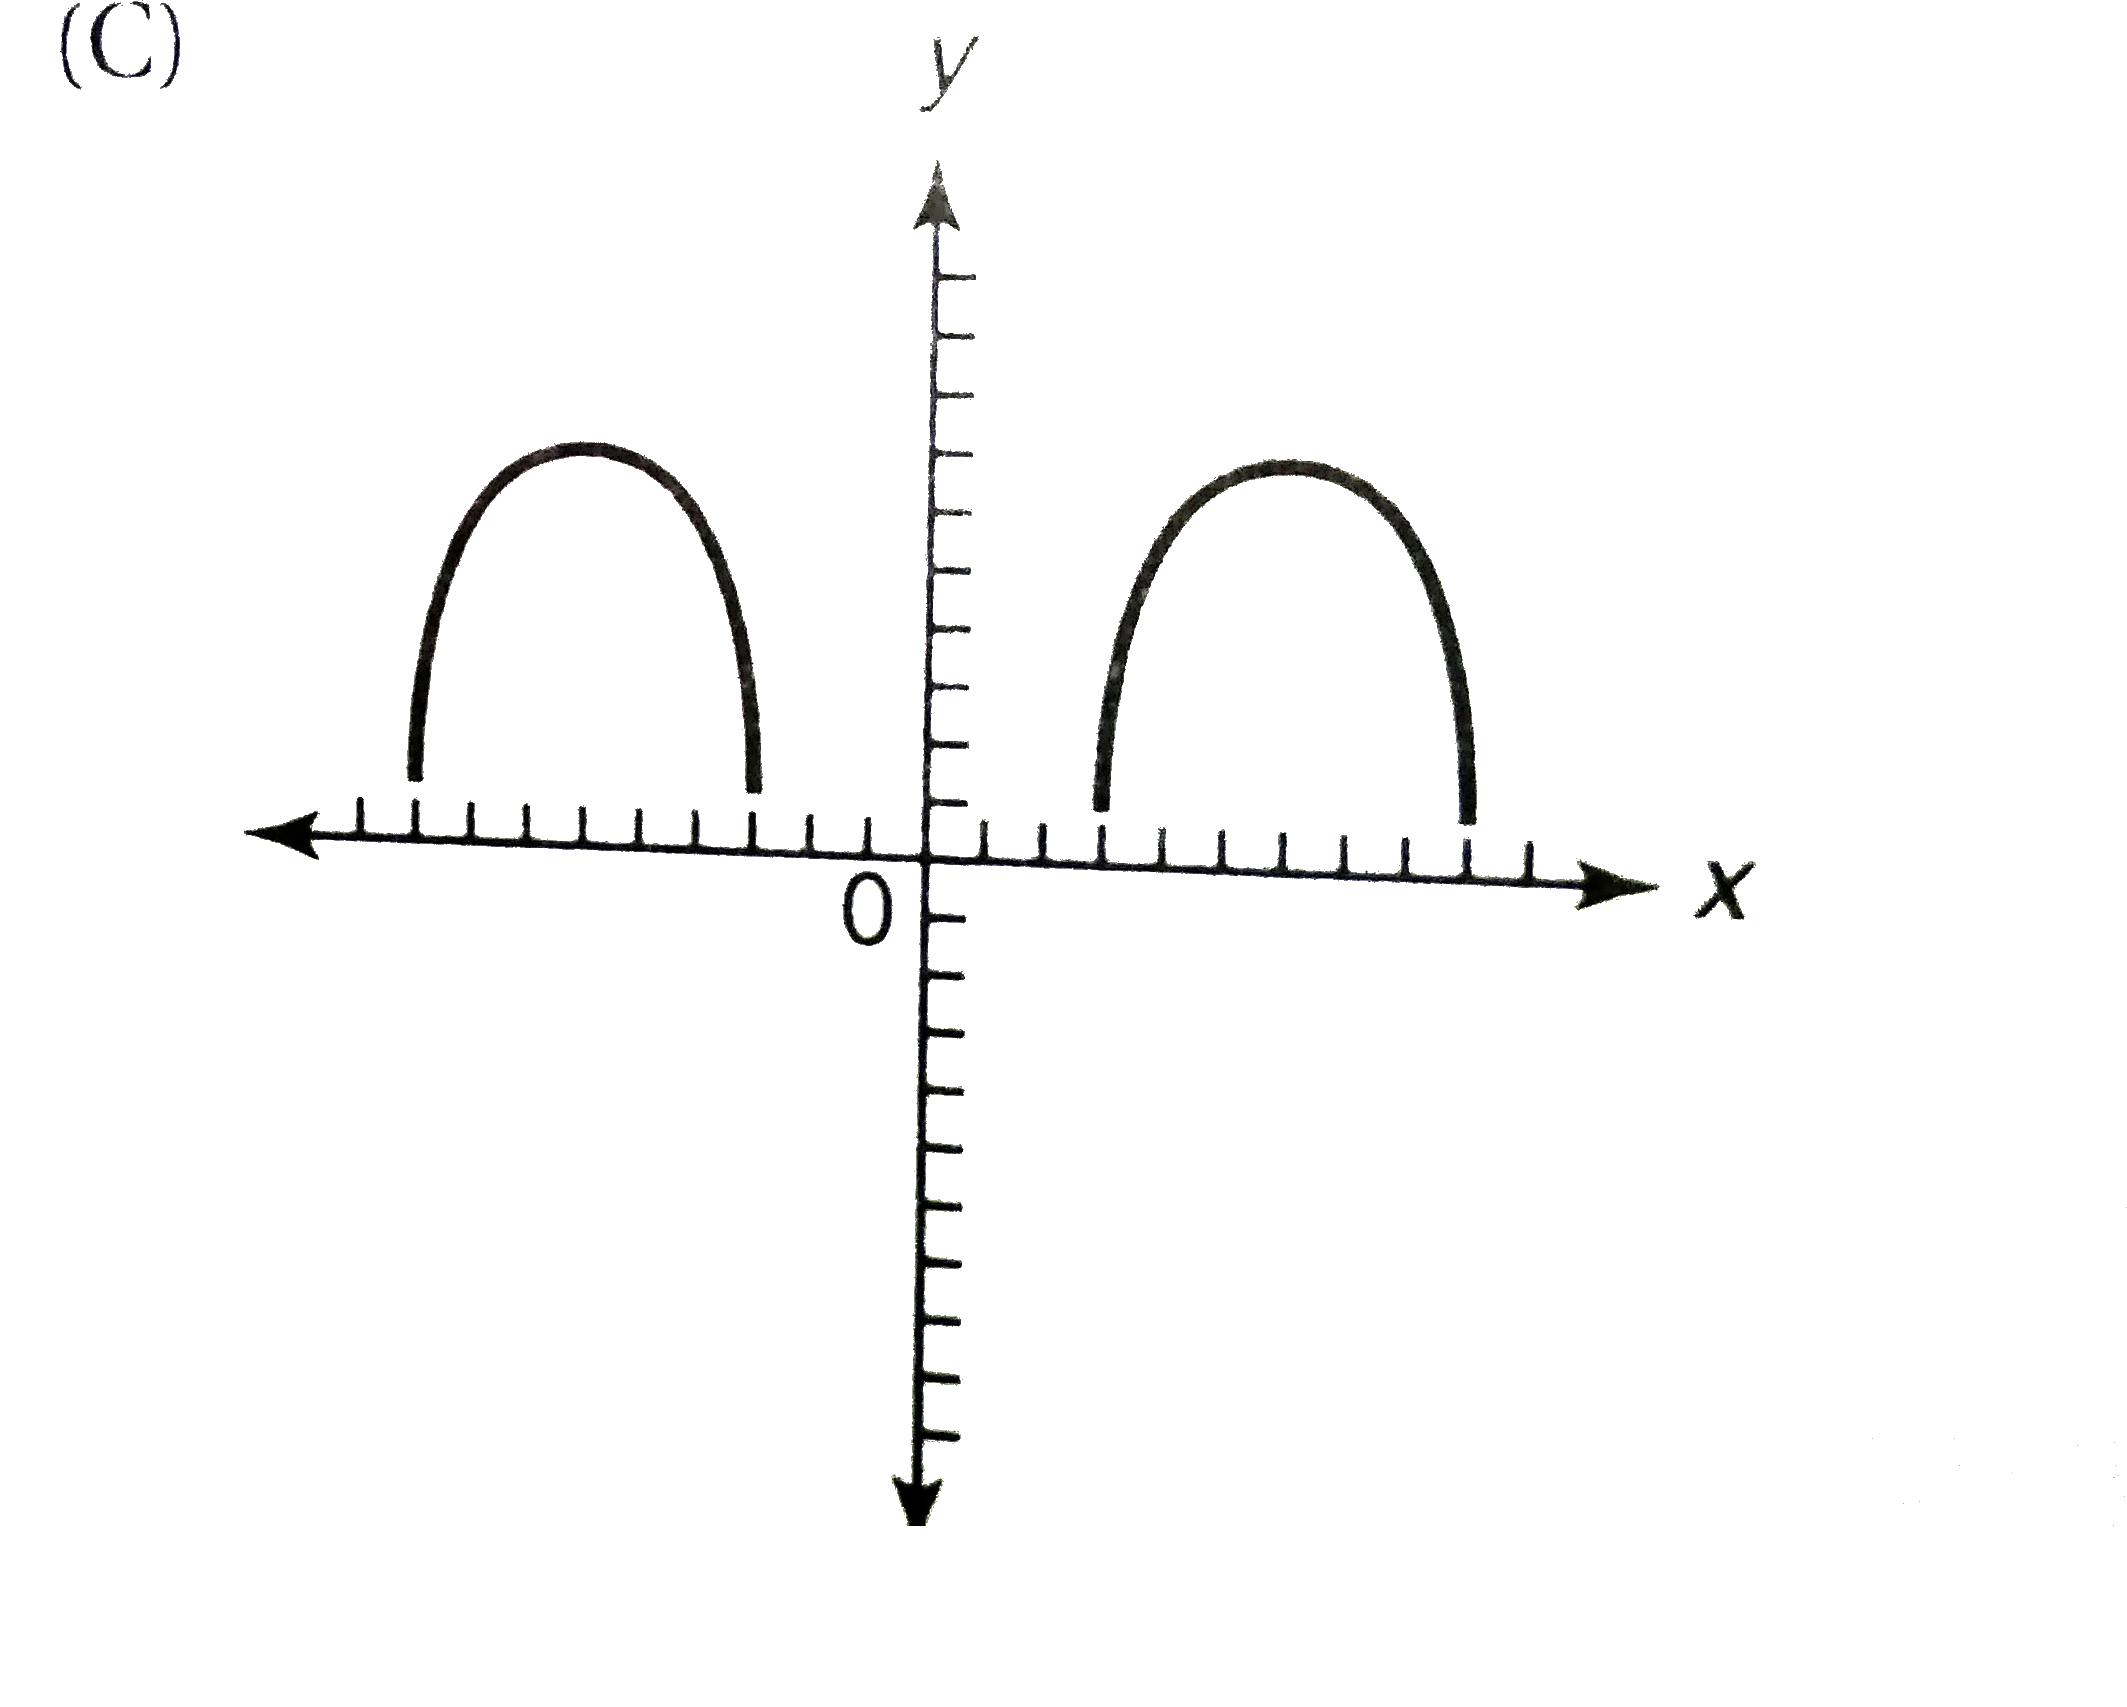 D
D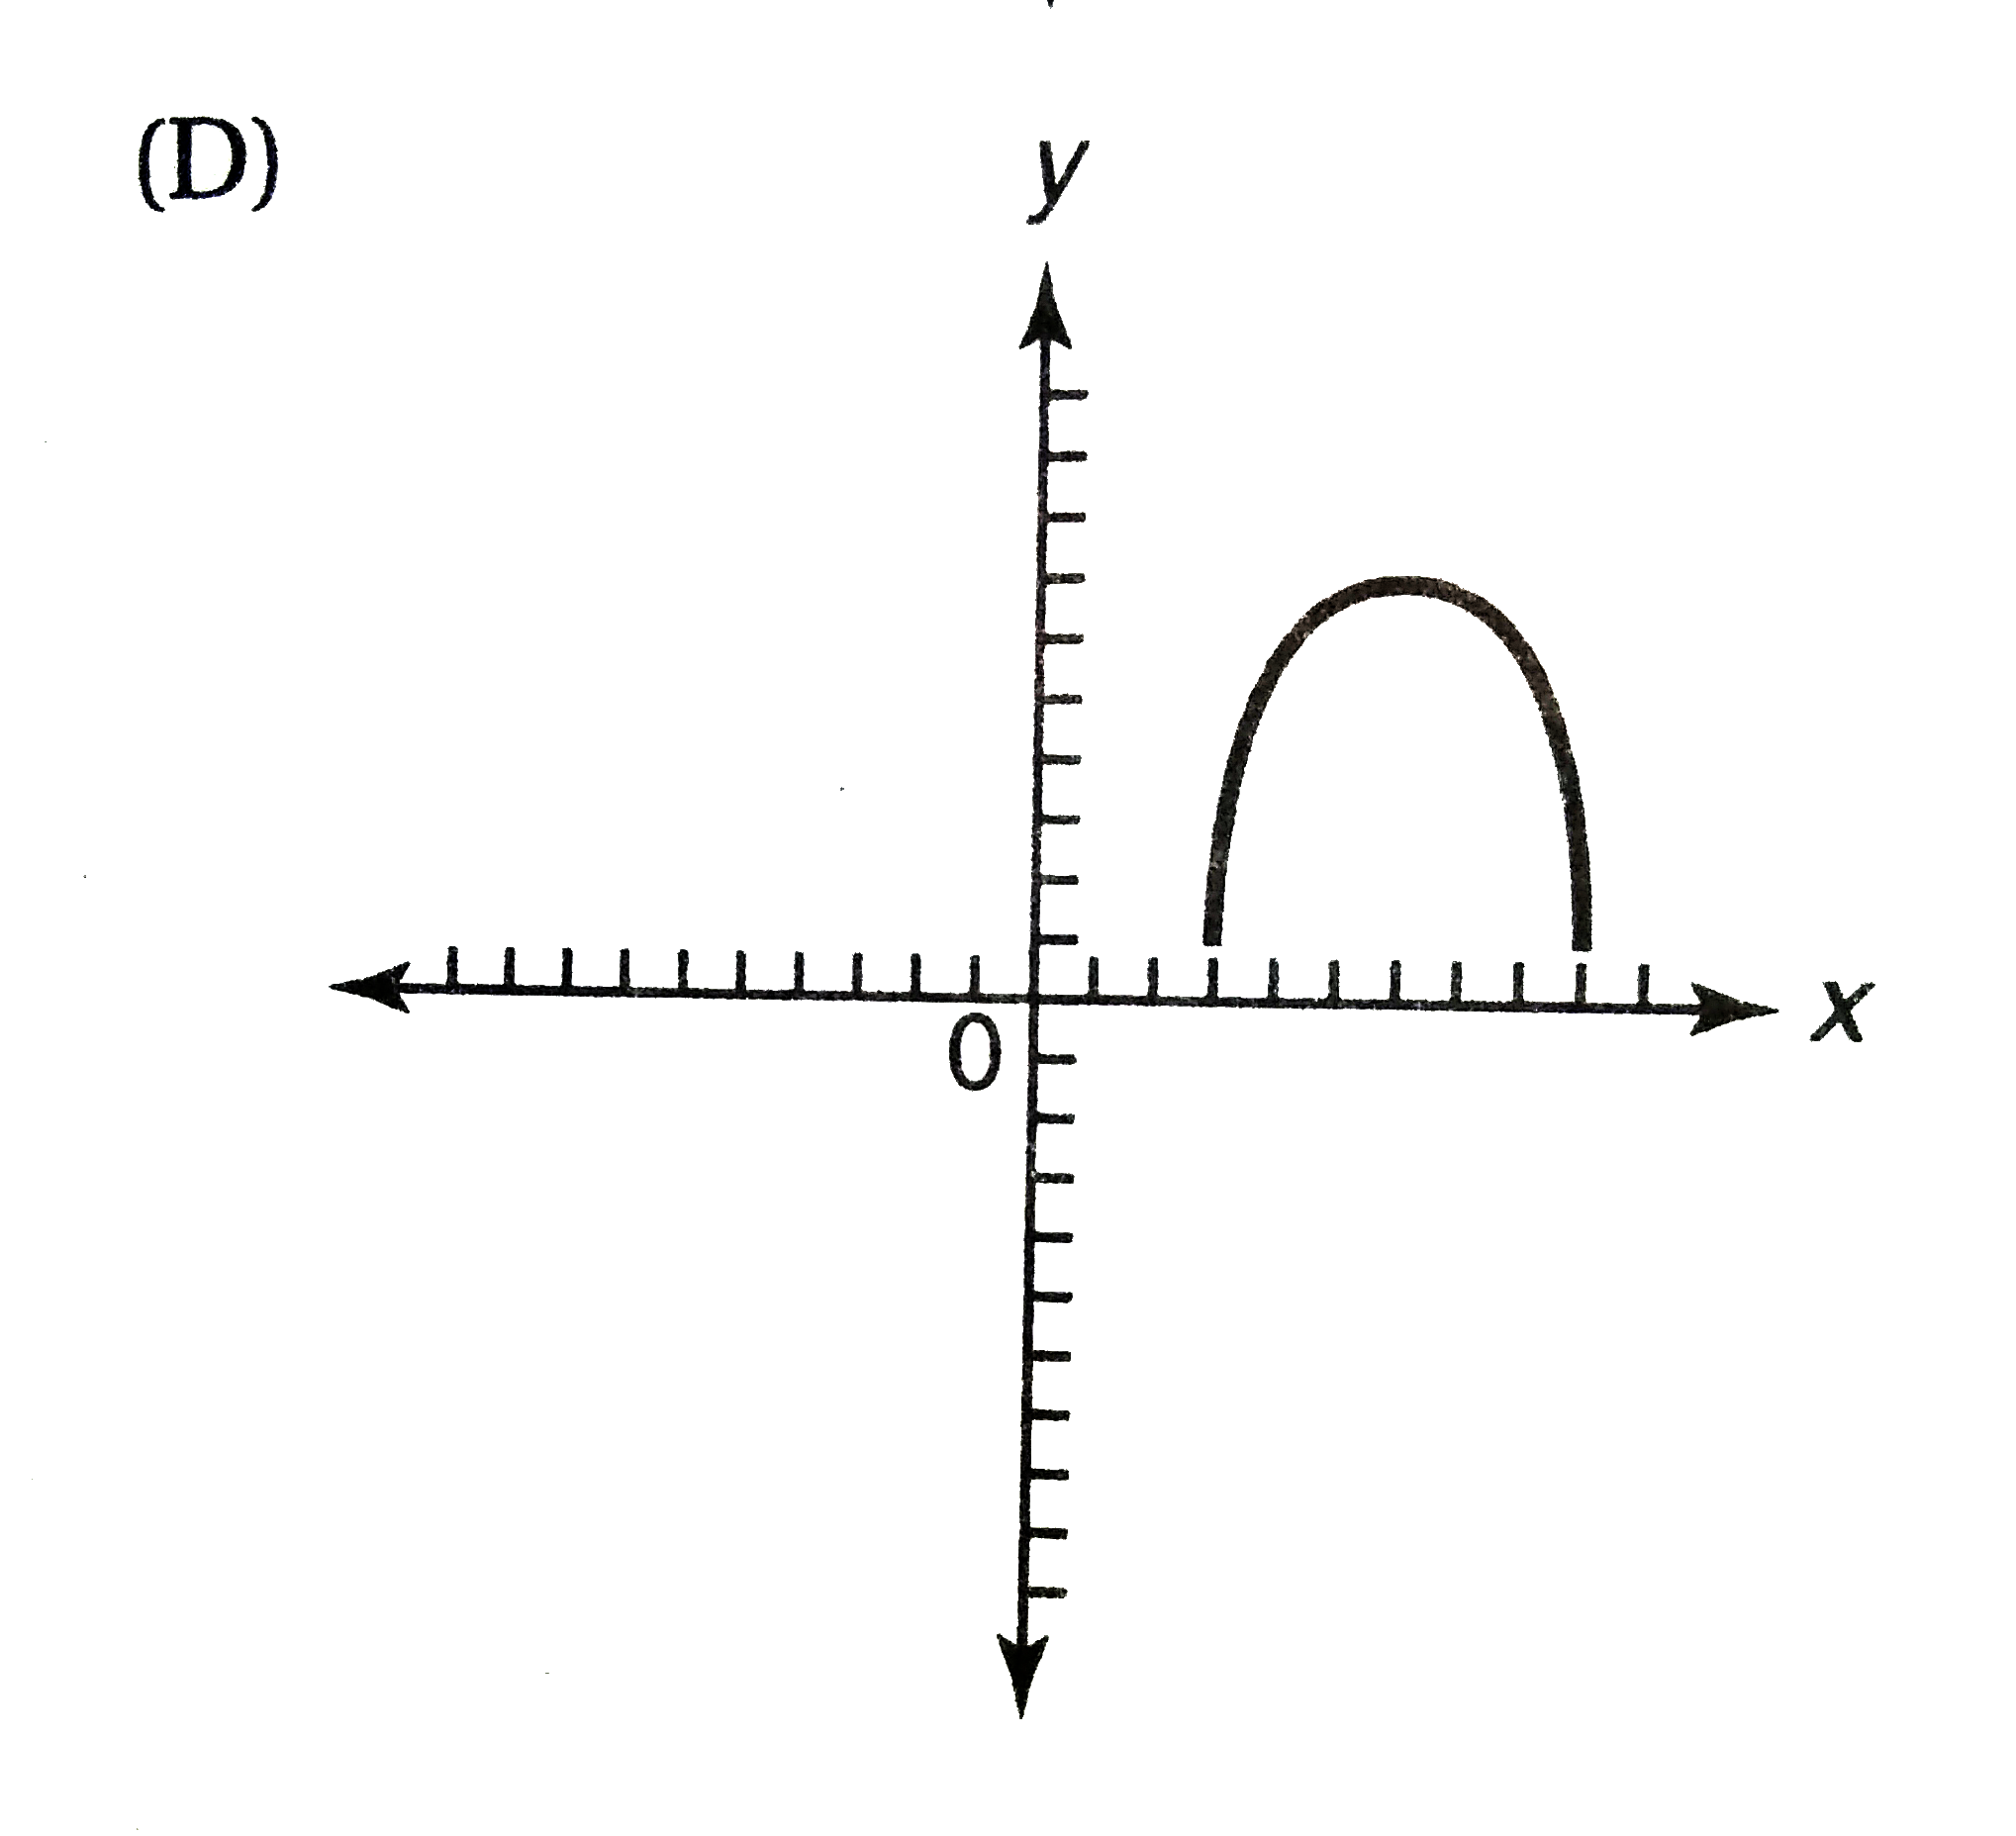
Mr. Kapoor compares the prices (in) of different items at two different shops A and B. Examine the following table carefully and represent the data by a double bar graph.

View SolutionFor the data given above in question number 7, draw a suitable pie-graph.

View SolutionStudents of a small school use different modes of travel to school as shown below:

Draw a suitable bar graph
View SolutionThe length of 40 leaves of a plant are measured correct to one millimetre, and the obtained data is represented in the following table: (i) Draw a histogram to represent the given data.(ii) Is there any other suitable graphical representation for the same data?(iii) Is it correct to conclude that the maximum number of leaves are 153 mm long?Why?
View SolutionThe following table shows the favourite sports of 250 students of a school. Represent the data by a bar graph.
View SolutionThe following table shown the market position of different brands of tea-leaves.

Draw a bar graph.
View Solution


