Mr. Kapoor compares the prices (in) of different items at two different shops A and B. Examine the following table carefully and represent the data by a double bar graph.

The correct Answer is:(##SELRKBICSEMATVIIIC22E02009_A01##)
Step by step video, text & image solution for Mr. Kapoor compares the prices (in) of different items at two different shops A and B. Examine the following table carefully and represent the data by a double bar graph. by Maths experts to help you in doubts & scoring excellent marks in Class 8 exams.
Updated on:21/07/2023Topper's Solved these Questions
- DATA HANDLING Book:ICSEChapter:DATA HANDLING Exercise:EXERCISE 22 (A) ( Fill in the blanks : )
Explore 5 Videos
- CUBES AND CUBE - ROOTS Book:ICSEChapter:CUBES AND CUBE - ROOTS Exercise:EXERCISE 4(B)
Explore 39 Videos
- DIRECT AND INVERSE VARIATIONSBook:ICSEChapter:DIRECT AND INVERSE VARIATIONSExercise:EXERCISE 10 (E)
Explore 19 Videos
Similar Questions
Knowledge Check

The Chart above shows the original and sale prices of a certain item at each of four different stores. Which of the following stores provides a discount of 20% or more on this item?
I. Store A
II. Store B
III. Store CAI onlyBIII onlyCI and II onlyDI and III only
The expenditure of a family of different heads in a month is given below

Draw a bar graph to represent the data above.
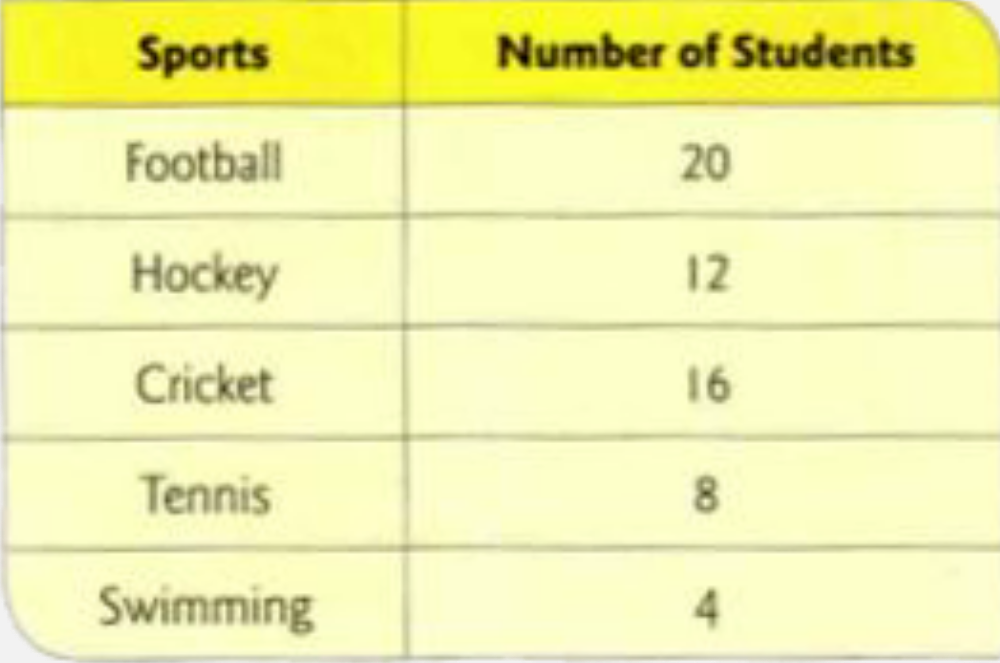
View SolutionThe following table shows the favourite sports of 250 students of a school. Represent the data by a bar graph.
View SolutionIf a and b are two different positive real numbers then which of the following statement is true?
View SolutionFollowing table represents the data collected from a group of children who were asked about their favourite sports. Represent the data as a bar graph.

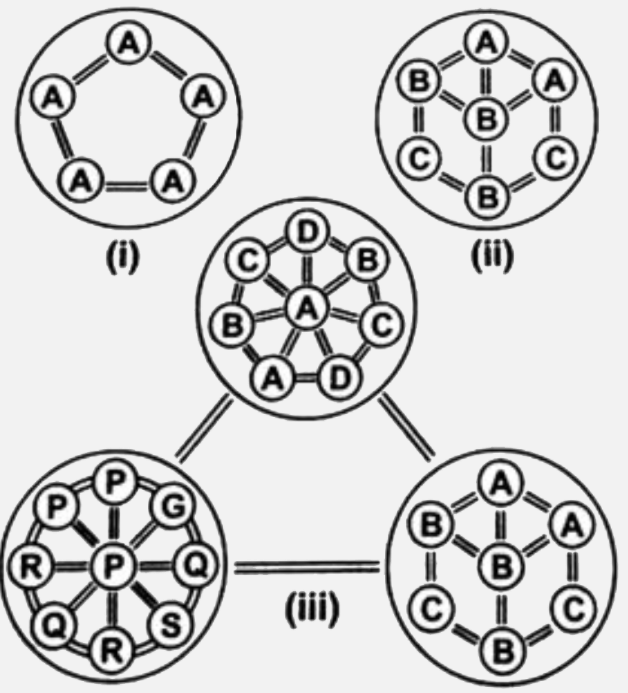
View SolutionDifferent species are represented by A, B ,C ,D ,G, P, Q ,R and S . Which of the following represents a community ?

View SolutionThe following table shown the market position of different brands of tea-leaves.

Draw a bar graph.
View SolutionThe percentage of marks obtained, in different subjects by Ashok Sharma (in an examination) are given below. Draw a bar graph to represent it.

View Solution

