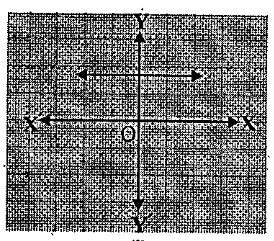
The graphs of y=P(x) are given below,for some polynomials P(x).Find the number of zeroes of P(x),in each case.
 Solution in Assamese
Step by step video & image solution for The graphs of y=P(x) are given below,for some polynomials P(x).Find the number of zeroes of P(x),in each case. by Maths experts to help you in doubts & scoring excellent marks in Class 10 exams.
Updated on:21/07/2023Topper's Solved these Questions
- POLYNOMIALSBOOK - R G PUBLICATIONCHAPTER - POLYNOMIALSEXERCISE - EXAMPLES
16 Videos
- PAIR OF LINEAR EQUATIONS IN TWO VARIABLESBOOK - R G PUBLICATIONCHAPTER - PAIR OF LINEAR EQUATIONS IN TWO VARIABLESEXERCISE - EXERCISE
84 Videos
- PROBABILITYBOOK - R G PUBLICATIONCHAPTER - PROBABILITYEXERCISE - EXERCISE
91 Videos
Similar Questions
Find the zeroes of the quadratic polynomial x2+7x+12 and verify the relation between the zeroes and its coefficients.
View SolutionForm the pair of linear equations in the following problems,and find their solution graphically.(i)10 students of class X took part in a Mathematics quiz.If the number of girls is 4 more than the number of boys,find the number of boys and girls who took part in the quiz.
View SolutionProbability of an event E + Probability of the event 'not E'=____.
View SolutionName the enzymes 'P' and 'Q' that are involved in the processes given below.
ltimg src="https://d10lpgp6xz60nq.cloudfront.net/physics_images/BIO_044_SQP_XII_E01_005_Q01.png" width="80%"gt
View SolutionDetermine the point of symmetry of a regular hexagon.
View SolutionMatch the following Column A to Column B

View SolutionMatch the following Column A to Column B

View SolutionMatch the following Column A to Column B

View SolutionFind the area of figure given below.

View SolutionFind the perimeter of the figure given below.

View SolutionFind the area of the figure given below.

View SolutionThe area of the shaded part in the figure given below is ______.

View SolutionThe inequation represented by the graph given below is :
View SolutionThe inequation that best describes the graph given below is _________
View SolutionThe inequation that best describes the following graph is _________
View SolutionIn Fig, find the value of x.
ltimg src="https://d10lpgp6xz60nq.cloudfront.net/physics_images/PS_MATH_IX_C12_S01_032_Q01.png" width="80%"gt
View Solution
