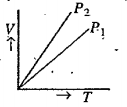
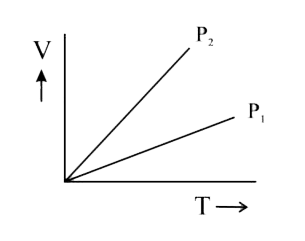
V versus T curves at constant pressure P1 and P2 for an ideal gas are shown in fig. Solution in Bengali
P1>P2
P1<P2
P1=P2
P1≥P2
Step by step video & image solution for V versus T curves at constant pressure P_1 and P_2 for an ideal gas are shown in fig. by Chemistry experts to help you in doubts & scoring excellent marks in Class 10 exams.
Updated on:21/07/2023Topper's Solved these Questions
Similar Questions
What is the value of normal temperature?
View SolutionWhat is the mass of 5 mole NH3.
View SolutionThe volume V versus temperature T graphs for a cetain amount of a perfect gas at two pressure p1andp2 are as shown in Fig. It follows from the graphs that p1 is greater than p2.
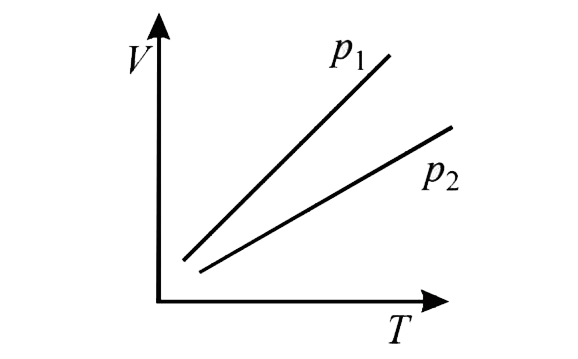
View SolutionPressure versus temperature graph of an ideal gas as shown in Fig. Corresponding density (rho) versus volume (V) graph will be
View SolutionFor an ideal gas V - T curves at constant pressure P_(1) & P_(2) are shown in figure, from the figure
View SolutionFor V versus T curves at constant pressure P1andP2 for and ideal gas shown in figure-
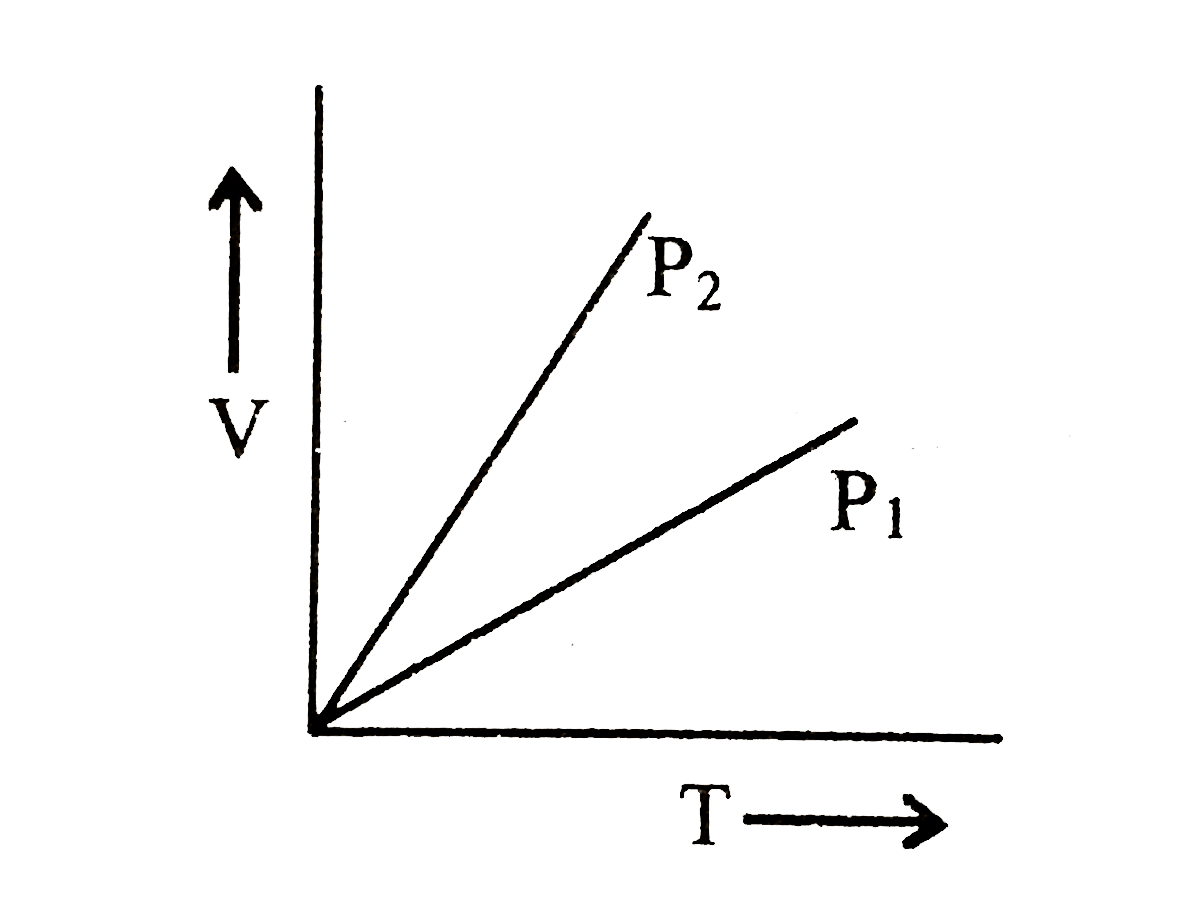
View SolutionV vs T curves at constant pressure P1 and P2 for an ideal gas are shown below
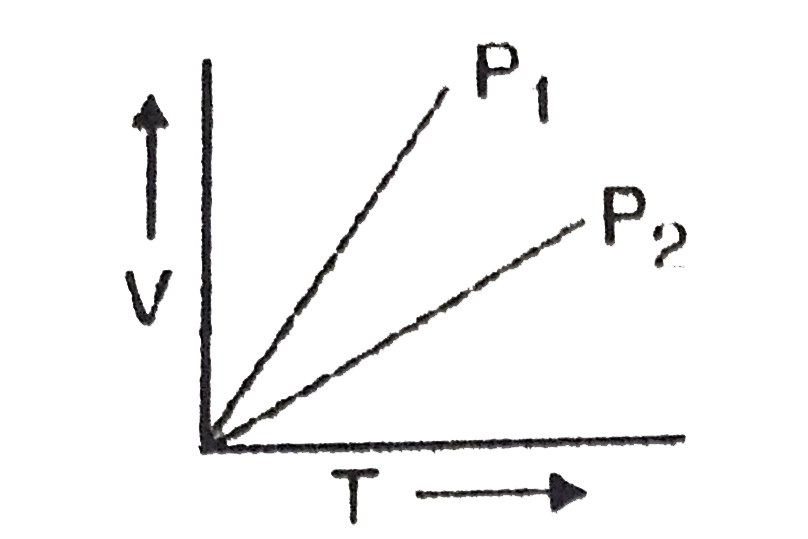
Which is correct ?
View SolutionIn V-T diagram shown in fig., what is the relation between P1andP2 ?
View SolutionFigure 6.18 shows the V-T graph for a fixed mass of an ideal gas at pressure p_1 and p_2 . Can you infer from the graph whether p_1 is greater than p_2 ?
View SolutionFor an ideal gas V−T curves at constant pressure P1 & P2 are shown in figure, from the figure
_E01_061_Q01.png)
View SolutionFor an ideal gas V-T curves as constant pressures P1&P2 are shown in figure - from the figure
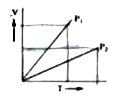
View Solutionएक गैस की मात्रा के लिए स्थिर दाब p1वP2 पर आयतन V व ताप T वक्रो को चित्र में दिखाया गया है। वक्रो से आप क्या निष्कर्ष निकालते है ?
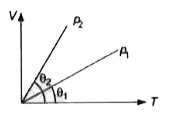
View SolutionPressure versus temperature graph of an ideal gas as shown in Fig.
Corresponding density (ρ) versus volume (V) graph will be
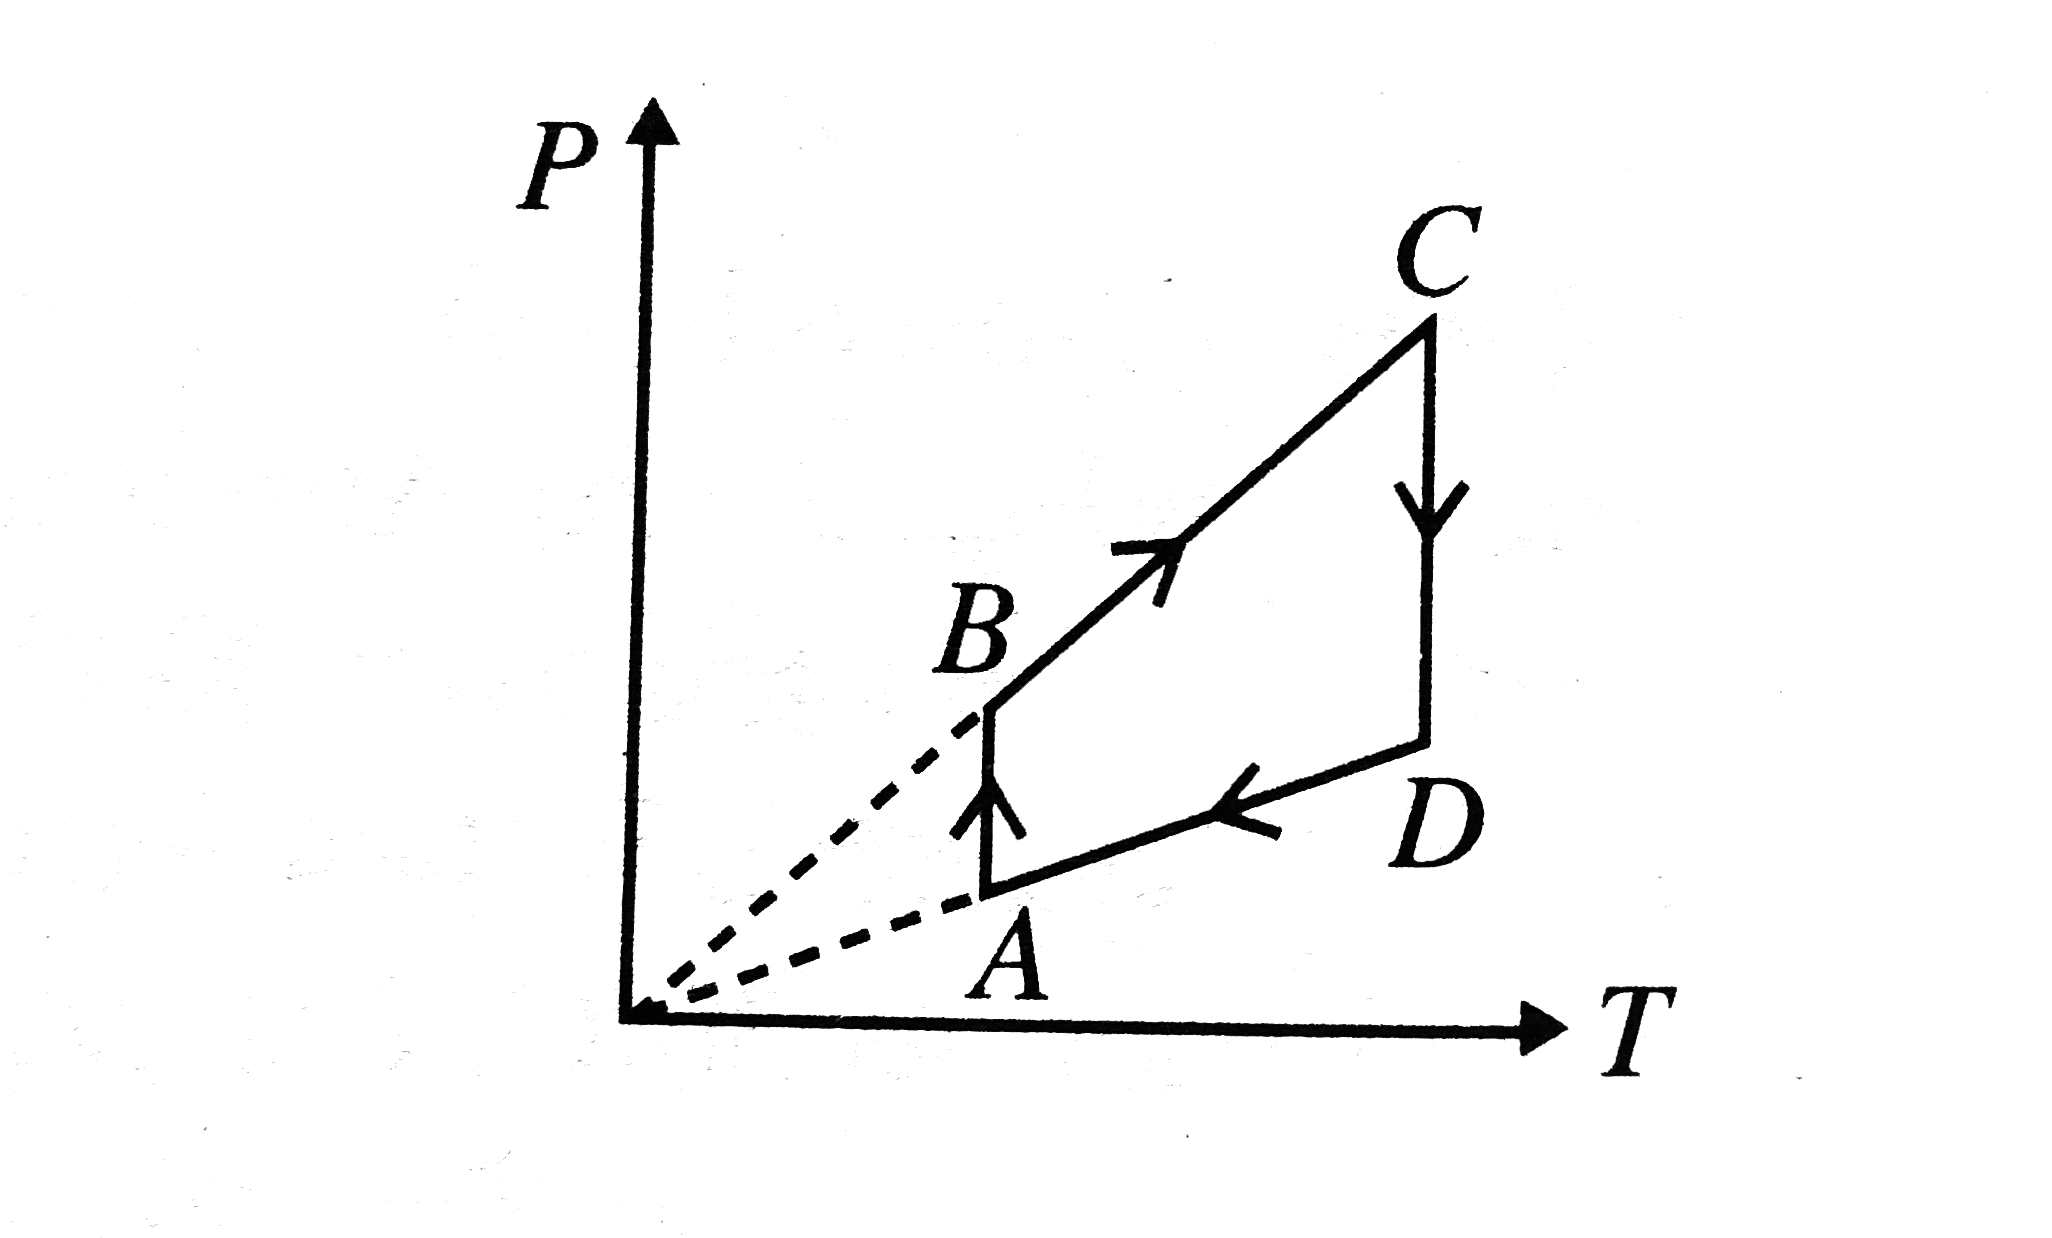
View SolutionThe volume V versus temperature T graphs for a certain amount of a perfect gas at two pressure p_1 and p_2 are as shown in Fig. Show that p_1 is less than p_2.
View SolutionFor V versus T curves at constant pressure P_(1) and P_(2) for an ideal gas are shown in the figure given below
View Solution
