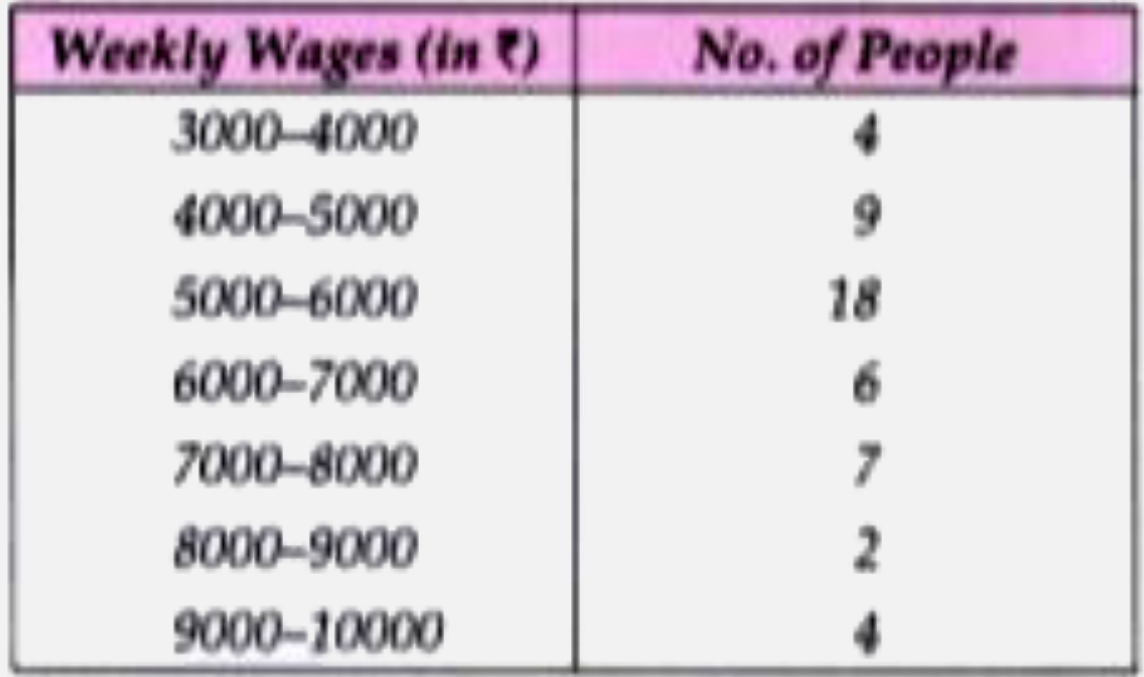
Draw a Histogram for the data, using a graph paper:

Estimate the mode from the graph.
The correct Answer is:5450
Step by step video & image solution for Draw a Histogram for the data, using a graph paper: Estimate the mode from the graph. by Maths experts to help you in doubts & scoring excellent marks in Class 10 exams.
Updated on:21/07/2023Topper's Solved these Questions
Similar Questions
A mathematics aptitude test of 50 students was recorded as follows :

Draw a histogram for the above data using a graph paper and locate the mode.
View SolutionA Mathematics aptitude test of 50 students was recorded as follows:

Draw a histogram for the above data using a graph paper and locate the mode:
View SolutionDraw a histogram for the following data :

View SolutionDraw a histogram for the following data:

View SolutionDraw a histogram for the following data:

View SolutionDraw a histogram for the following data:

View SolutionDraw a histogram for the following data:

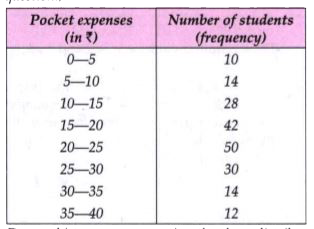
View Solution(Use a graph paper for this question). The daily pocket expenses of 200 students in a school are given below:

Draw a histogram representing the above distribution and estimate the mode from the graph.
View SolutionThe daily pocket expenses of 200 students in a school are given below : (Use a graph apper for this question.)

Draw a histogram representing the above distribution and estimate the mode from the graph.
View SolutionDraw a histogram from the following data:

View Solution
