Use the table given below to find : (a) The actual class limits of the fourth class. (b) The class boundaries of the sixth class. (c) The class mark of the third class. (d) The upper and lower limits of the fifth class. (e) The size of the third class.
Class intervalFrequency30−34735−391040−441245−491350−54855−594
The correct Answer is:5
Step by step video, text & image solution for Use the table given below to find : (a) The actual class limits of the fourth class. (b) The class boundaries of the sixth class. (c) The class mark of the third class. (d) The upper and lower limits of the fifth class. (e) The size of the third class. {:("Class interval","Frequency"),(30-34,7),(35-39,10),(40-44,12),(45-49,13),(50-54,8),(55-59,4):} by Maths experts to help you in doubts & scoring excellent marks in Class 9 exams.
Updated on:21/07/2023Topper's Solved these Questions
- STATISTICS AND GRAPH WORK BOOK - ICSECHAPTER - STATISTICS AND GRAPH WORK EXERCISE - TOPIC - 1 (4 Marks Questions)
9 Videos
- STATISTICS AND GRAPH WORK BOOK - ICSECHAPTER - STATISTICS AND GRAPH WORK EXERCISE - TOPIC - 2 (3 Marks Questions)
10 Videos
- STATISTICSBOOK - ICSECHAPTER - STATISTICSEXERCISE - EXERCISE 18 (B)
6 Videos
- TRIANGLES BOOK - ICSECHAPTER - TRIANGLES EXERCISE - 4 MARKS QUESTIONS
24 Videos
Similar Questions
Use the table given below to find :
The class marks of the third class.
View SolutionThe table given below shows a frequency distribution table, find
(a) Upper limit of third class (b) Lower limit of fifth class
(c) Class size (d) Class mark of third class

View SolutionFrom the following frequency table.

Find : (a) The frequency of fifth class interval
(b) The upper class limit of third class interval.
(c) The lower class limit of second class interval.
(d) The class mark of sixth class interval.
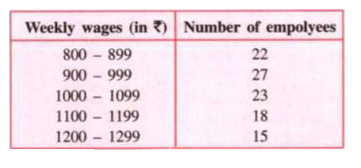
View SolutionThe table , given below , shows the frequency distributions of the weekly wages of the employee of a company:

Find :
(i) the lower limit of the fourth class.
(ii) the upper limit of the fifth class.
(iii) the class boundaries of the second class.
(iv) the class mark of the first class.
(v) the class size of the third class.
(vi) cumulative frequency of the fourth class.
View SolutionThe width of each of five continuous classes in a frequency distribution is 5 and the lower class limit of the lowest class is 10. The upper class limit of the highest class is
View SolutionA frequency polygon is constructed by plotting frequency of the class interval and the (a) upper limit of the class (b) lower limit of the class (c) mid value of the class (d) any values of the class
View SolutionFind the actual lower class limits , upper class limits and mid values of the classes :
10 -19 , 20 - 29 , 30 - 39 , and 40 - 49
View SolutionFind the actual lower and upper class limits and also the class marks of the classes :
1.1 - 2.0, 2.1 - 3.0 and 3.1 - 4.0.
View SolutionThe mid-value of a class interval is 42. If the class size is 10, then the upper and lower limits of the class are: (a) 47 and 37 (b) 37 and 47 (c) 37.5 and 47.5 (d) 47.5 and 37.5
View SolutionIn a frequency distribution, the mid-value of a class is 15 and the class intervals is 4. The lower limit of the class is 10 (b) 12 (c) 13 (d) 14
View Solution
