Who amongst the following diverged from the main line of hominid evolution about 10 million years ago ?
Gibbon
Orangutan
Gorilla
Chimpanzee
The correct Answer is:A
To solve the question of who diverged from the main line of hominid evolution about 10 million years ago, we can follow these steps:
1. Understand the Question: The question asks which species diverged from the main line of hominid evolution approximately 10 million years ago.
2. Identify the Options: The options provided are likely different primate species, including Gibbons, Orangutans, Gorillas, and Chimpanzees.
3. Review Hominid Evolution Timeline:
- Gibbons: Gibbons diverged from the main line of hominid evolution around 20 million years ago. This is too early for our question.
- Orangutans: Orangutans diverged from the main line of hominid evolution approximately 10 million years ago. This fits the criteria of the question.
- Gorillas: Gorillas diverged from the main line of hominid evolution around 6 to 8 million years ago. This is also too early.
- Chimpanzees: Chimpanzees diverged from the main line of hominid evolution around 4 to 5 million years ago. This is also too early.
4. Conclusion: Based on the timeline of divergence, the species that diverged from the main line of hominid evolution about 10 million years ago is the Orangutans.
Final Answer:
Orangutans
---
- Gibbons: Gibbons diverged from the main line of hominid evolution around 20 million years ago. This is too early for our question.
- Orangutans: Orangutans diverged from the main line of hominid evolution approximately 10 million years ago. This fits the criteria of the question.
- Gorillas: Gorillas diverged from the main line of hominid evolution around 6 to 8 million years ago. This is also too early.
- Chimpanzees: Chimpanzees diverged from the main line of hominid evolution around 4 to 5 million years ago. This is also too early.
Orangutans
Topper's Solved these Questions
- EVOLUTIONBOOK - CENGAGE BIOLOGY ENGLISHCHAPTER - EVOLUTIONEXERCISE - Exercise Assertion-Reasoning Question.
25 Videos
- EVOLUTIONBOOK - CENGAGE BIOLOGY ENGLISHCHAPTER - EVOLUTIONEXERCISE - Archives
38 Videos
- ENVIRONMENTAL ISSUESBOOK - CENGAGE BIOLOGY ENGLISHCHAPTER - ENVIRONMENTAL ISSUESEXERCISE - ARCHIVES
45 Videos
- HUMAN HEALTH AND DISEASEBOOK - CENGAGE BIOLOGY ENGLISHCHAPTER - HUMAN HEALTH AND DISEASEEXERCISE - ARCHIVES
46 Videos
Similar Questions
Knowledge Check
Oil and gas production in a certain area dropped from 4 million barrels in 2000 to 1.9 million barrels in 2013. Assuming that the oil and gas production decreased at a constant rate, which of the following linear functions f best models the production, in millions of barrels, t years after the year 2000?
Af(t)=21130t+4Bf(t)=19130t+4Cf(t)=−21130t+4Df(t)=−19130t+4
Question 16 and 17 refer to the above table, that shows the population (in millions) and education spending (in millions) and by state for each of the states listed for the years 2011, 2013, and 2015.
Q. Which of the following best approximates the average rate of change in education spending in Texas from 2011 to 2015?A3.2 billion per yearB6.3 billion per yearC10.5 per yearD7.9 billion per year
In which part of the world did the early human ancestor Australopithecus appear about five million years ago.
View Solution743 children from the United States, aged 6 through 11, were tested to see if they were overweight . The data are shown in the table below.

In 2014 the total population of children between 6 and 11 years old, inclusive , in the United States was about 74.3 million. If the test results are used to estimate information about children across the country, which of the following is the best estimate of the total number of children between 9 and 11 years old in the United States who were overweight in 2014 ?
View SolutionCalculate the missing frequency from the following distribution, it being given that the median of the distribution of 24. Age in years: 0-10 10-20 20-30 30-40 40-50 No. of persons: 5 25 ? 18 7
View Solution
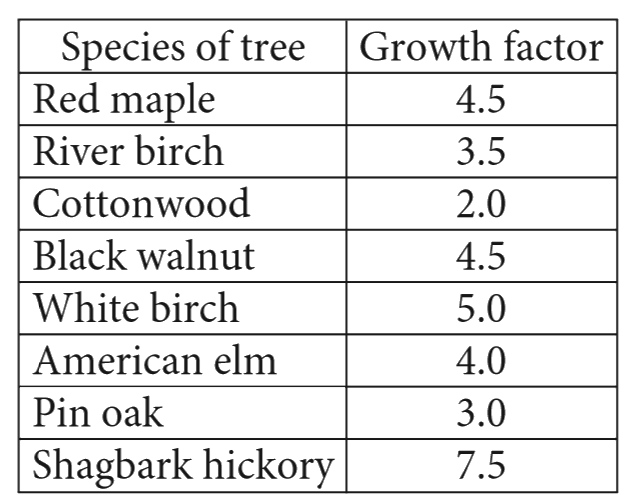
One method of calculating the approximate age , in years, of a tree of a particular species is to multiply the diameter of the tree, in inches, by a constant called the growth factor for that species. The table above gives the growth factors for eight species of trees.
If a white birch tree and a pinoak tree each now have a diameter of 1 foot,which of the following will be closest to the difference,in inches,of their diameters 10 years from now?(1foot=12inches)
View SolutionRead four statements about hominid species:
(a) Agriculture and human settlements started about 18000 years ago.
(b) Cave art developed approximately 10000 years ago.
(c) Homo sapiens arose in Africa.
(d) Homo erectus existed about 1.5 million years ago.
how many statements are correct among these?
View SolutionThe first cellular forms of life appeared on earth about________million years ago (mya)
View Solution
