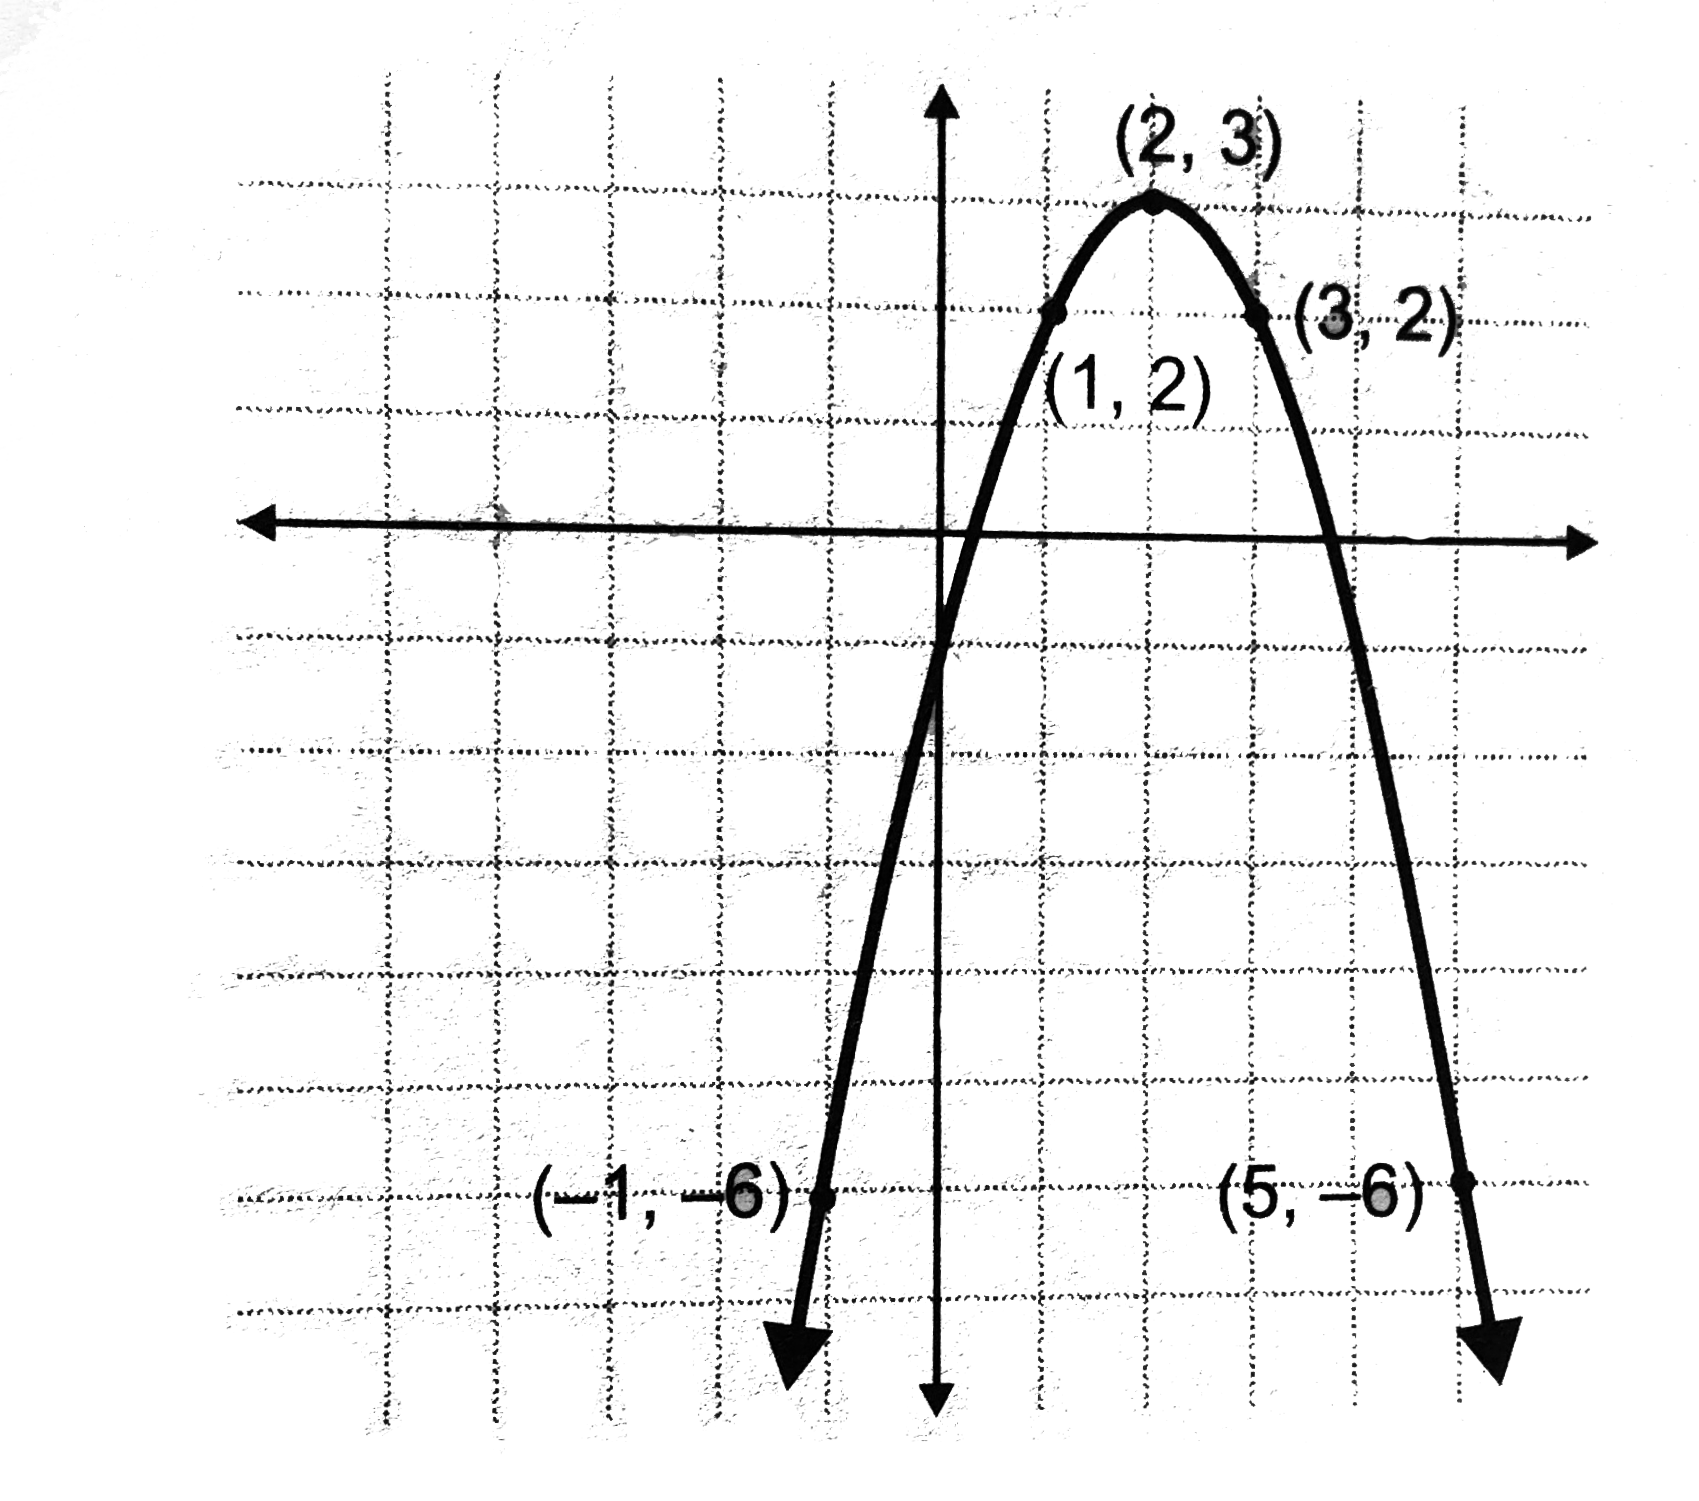
Plot a graph for the equation y=−x2+4x−1.
Video Solution
Text Solution
a=−1,b=4,c=−1. As a is negative, the parabola should open down.

Vertex: x=−b/2a=2. Putting this value of x, we get y=3. Hence, the vertex of the parabola is (2,3).
Assume two values of x as follows and find the corresponding values of y.
∣∣∣x1−1y2−6∣∣∣
Points obtained are (1,2) and (−1,−6).
Points obtained are (2,3)(vertex),[1,2], and [−1,−6].
Symmetry of parabola: Mirror image points of (1,2) and
Now, sketch the parabola as shown in figure.
|
Topper's Solved these Questions
- BASIC MATHEMATICSBOOK - CENGAGE PHYSICS ENGLISHCHAPTER - BASIC MATHEMATICSEXERCISE - Solved Examples
9 Videos
- BASIC MATHEMATICSBOOK - CENGAGE PHYSICS ENGLISHCHAPTER - BASIC MATHEMATICSEXERCISE - Exercise 2.1
2 Videos
- ARCHIVES 2 VOLUME 6BOOK - CENGAGE PHYSICS ENGLISHCHAPTER - ARCHIVES 2 VOLUME 6EXERCISE - Integer
4 Videos
- CALORIMETRYBOOK - CENGAGE PHYSICS ENGLISHCHAPTER - CALORIMETRYEXERCISE - Solved Example
13 Videos
Similar Questions
Knowledge Check
The graph of the equation y=x3+5x+1
ADoes not intersect the x-axisBintersects the x-axis at one and only one pointCintersects the x-axis at exactly three pointsDintersects the x-axis at more than three points.
Graph the equation x−2y=4
View SolutionDraw the graph of the equation 2x+y=3
View Solution(i) Draw a graph of y=x2−4x+3 for −2≤x≤5.
(ii) Use the graph to solve the equation x2−4x+3=0.
View SolutionDraw a graph of the equations: 3x−2y=4 and x+y−3=0
View SolutionDraw a graph of the equation: 3x−2y=4 and x+y−3=0
View SolutionDraw the graph of the equation x+2y =4, use graph to find :
(a) X1, the value of x when y=4(b)Y1 the value of y when x= -2
View SolutionDraw the graph of the equation 3x+2y−5=0. Use this graph to find:
(i) x1 the value of x, when y=7
(ii) y1 the value of y, when x=3
View Solution
