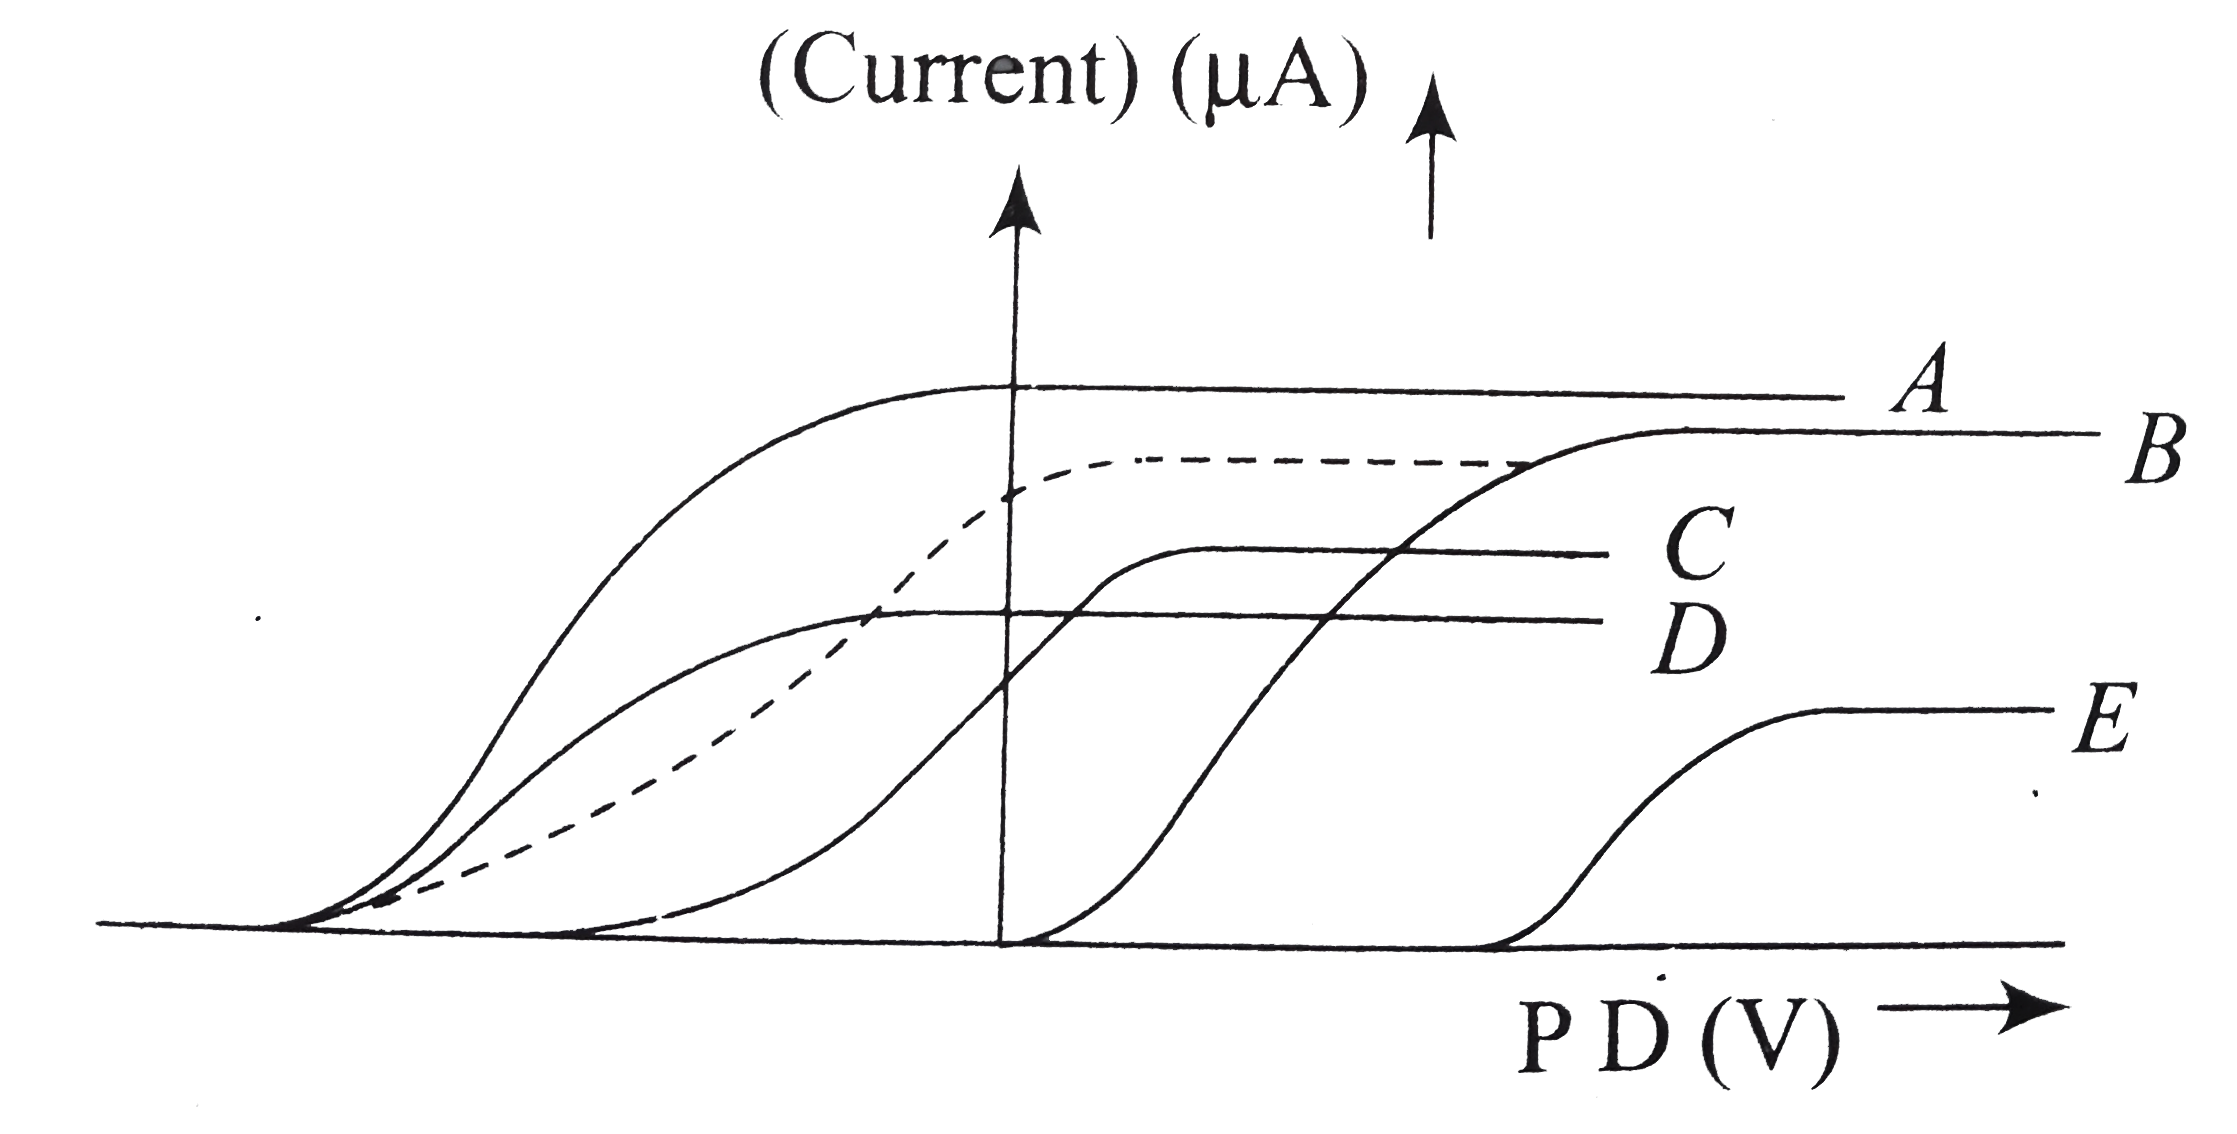
A photoelectric cell is connected to a source of variable potential difference, connected across it and the photoelectric current resulting (μA) is plotted against the applied potential difference (V). The graph in the broken line represents one for a given frequency and intensity of the incident radiation . If the frequency is increased and the intensity is reduced, which of the following graphs of unbroken line represents the new situation?
A
B
C
D
The correct Answer is:D
Intensity reduced therefore saturation current reduced. Frequency increased, therefore stopping potential increased.
Topper's Solved these Questions
- PHOTOELECTRIC EFFECTBOOK - CENGAGE PHYSICS ENGLISHCHAPTER - PHOTOELECTRIC EFFECTEXERCISE - Multiple Correct
10 Videos
- PHOTOELECTRIC EFFECTBOOK - CENGAGE PHYSICS ENGLISHCHAPTER - PHOTOELECTRIC EFFECTEXERCISE - Linked Comprehension
44 Videos
- PHOTOELECTRIC EFFECTBOOK - CENGAGE PHYSICS ENGLISHCHAPTER - PHOTOELECTRIC EFFECTEXERCISE - Subjective
16 Videos
- NUCLEAR PHYSICSBOOK - CENGAGE PHYSICS ENGLISHCHAPTER - NUCLEAR PHYSICSEXERCISE - ddp.5.5
14 Videos
- RAY OPTICSBOOK - CENGAGE PHYSICS ENGLISHCHAPTER - RAY OPTICSEXERCISE - DPP 1.6
12 Videos
Similar Questions
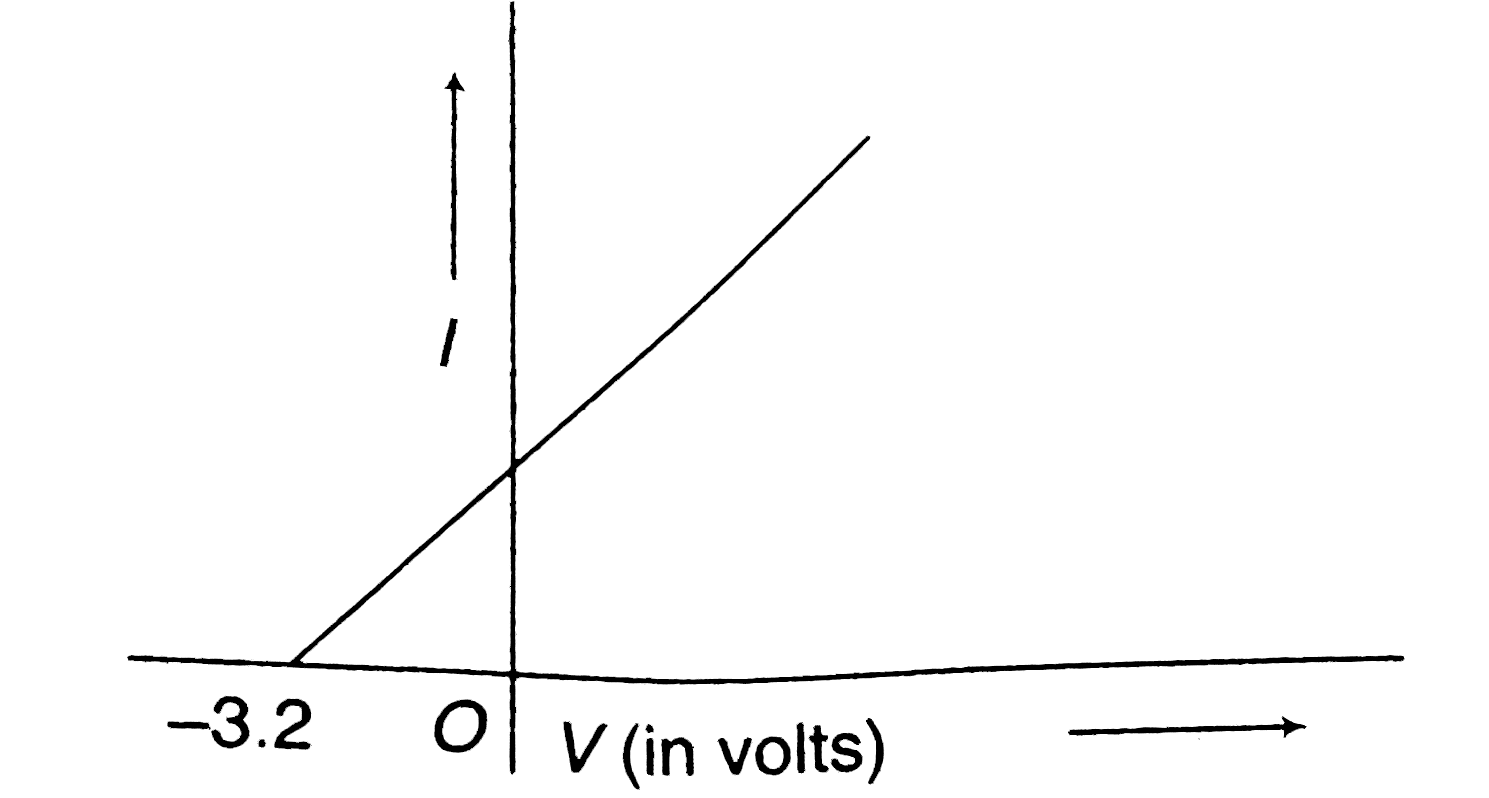
In a photoelectric experiment the relation between applied potential difference between cathode and anode V and the photoelectric current cathode and anode V and the photoelectric current l and was found to be shown in graph below. If planck's constant h=6.6×10⁻³⁴Js, the frequency of incident radiation would be nearly (in s−1)
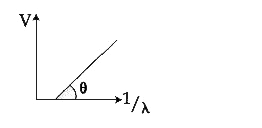
View SolutionIn a photoelectric effect experiment, the graph of stopping potential V versus reciprocal of wavelength obtained is shown in the figure. As the intensity of incident radiation is increased :
View Solution
Knowledge Check
A cell having an emf E and internal resistance r is connected across a variable external resistance R. As the resistance R is increased, the plot of potential difference V across R is given by
A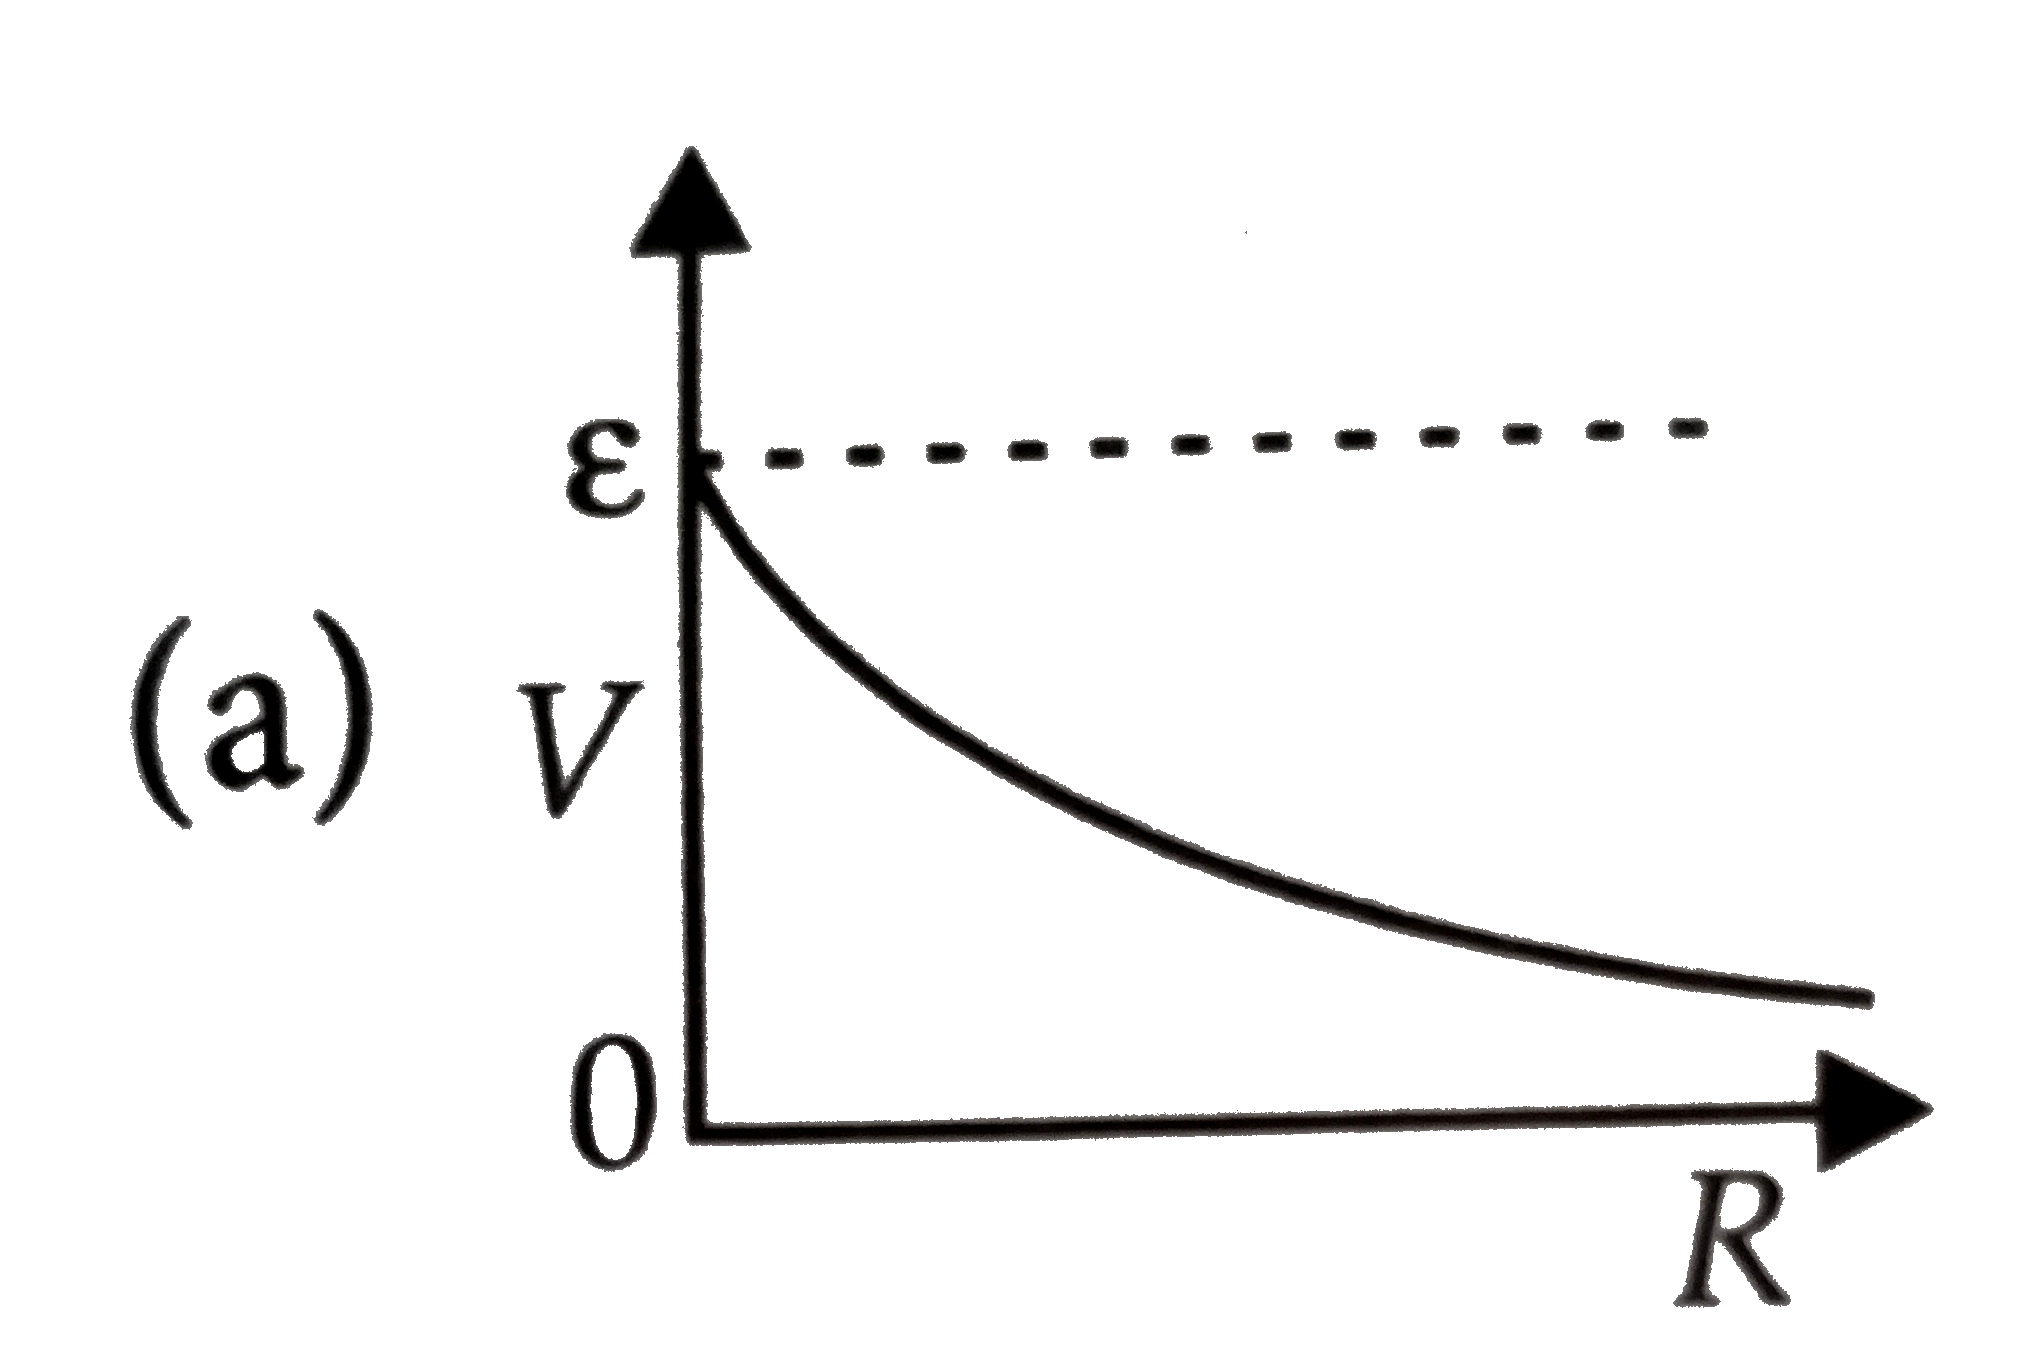 B
B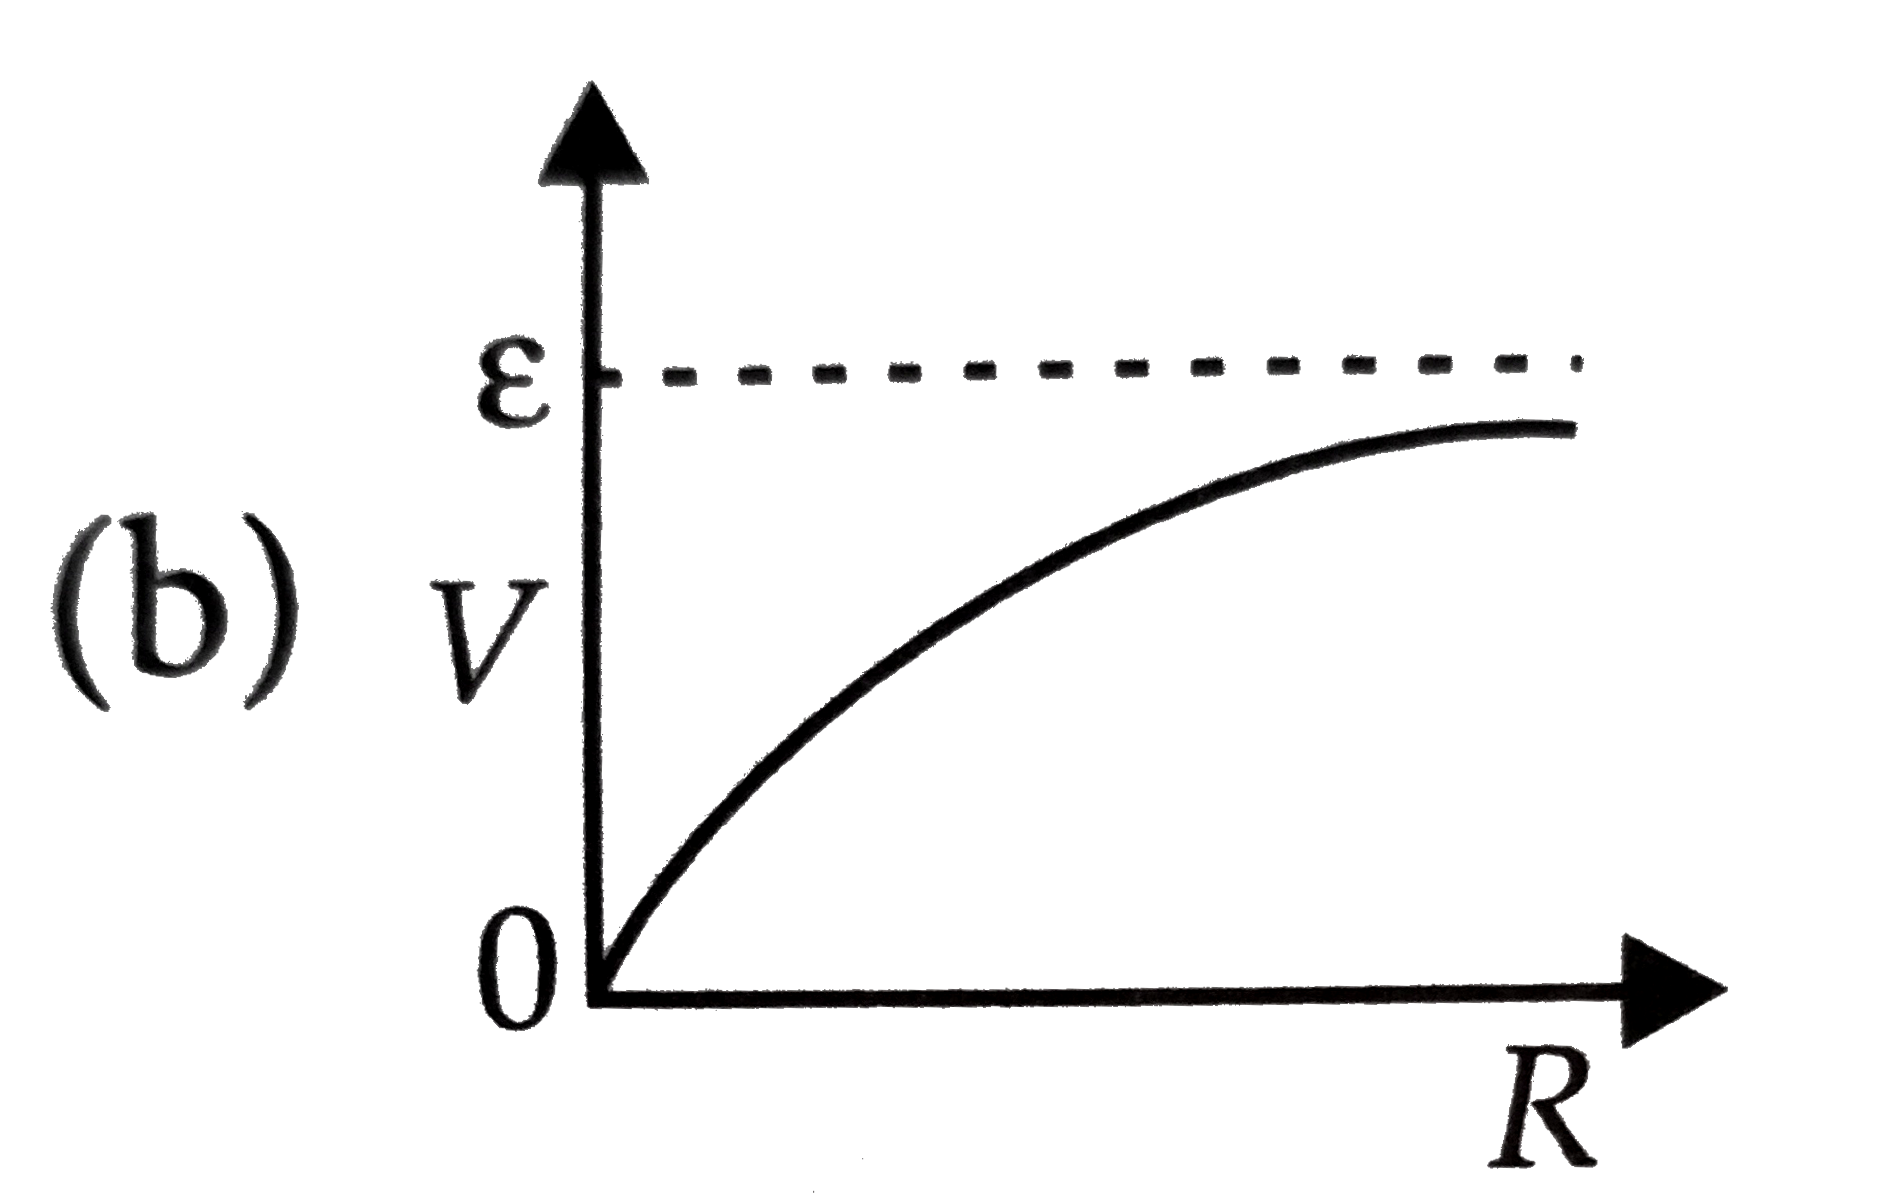 C
C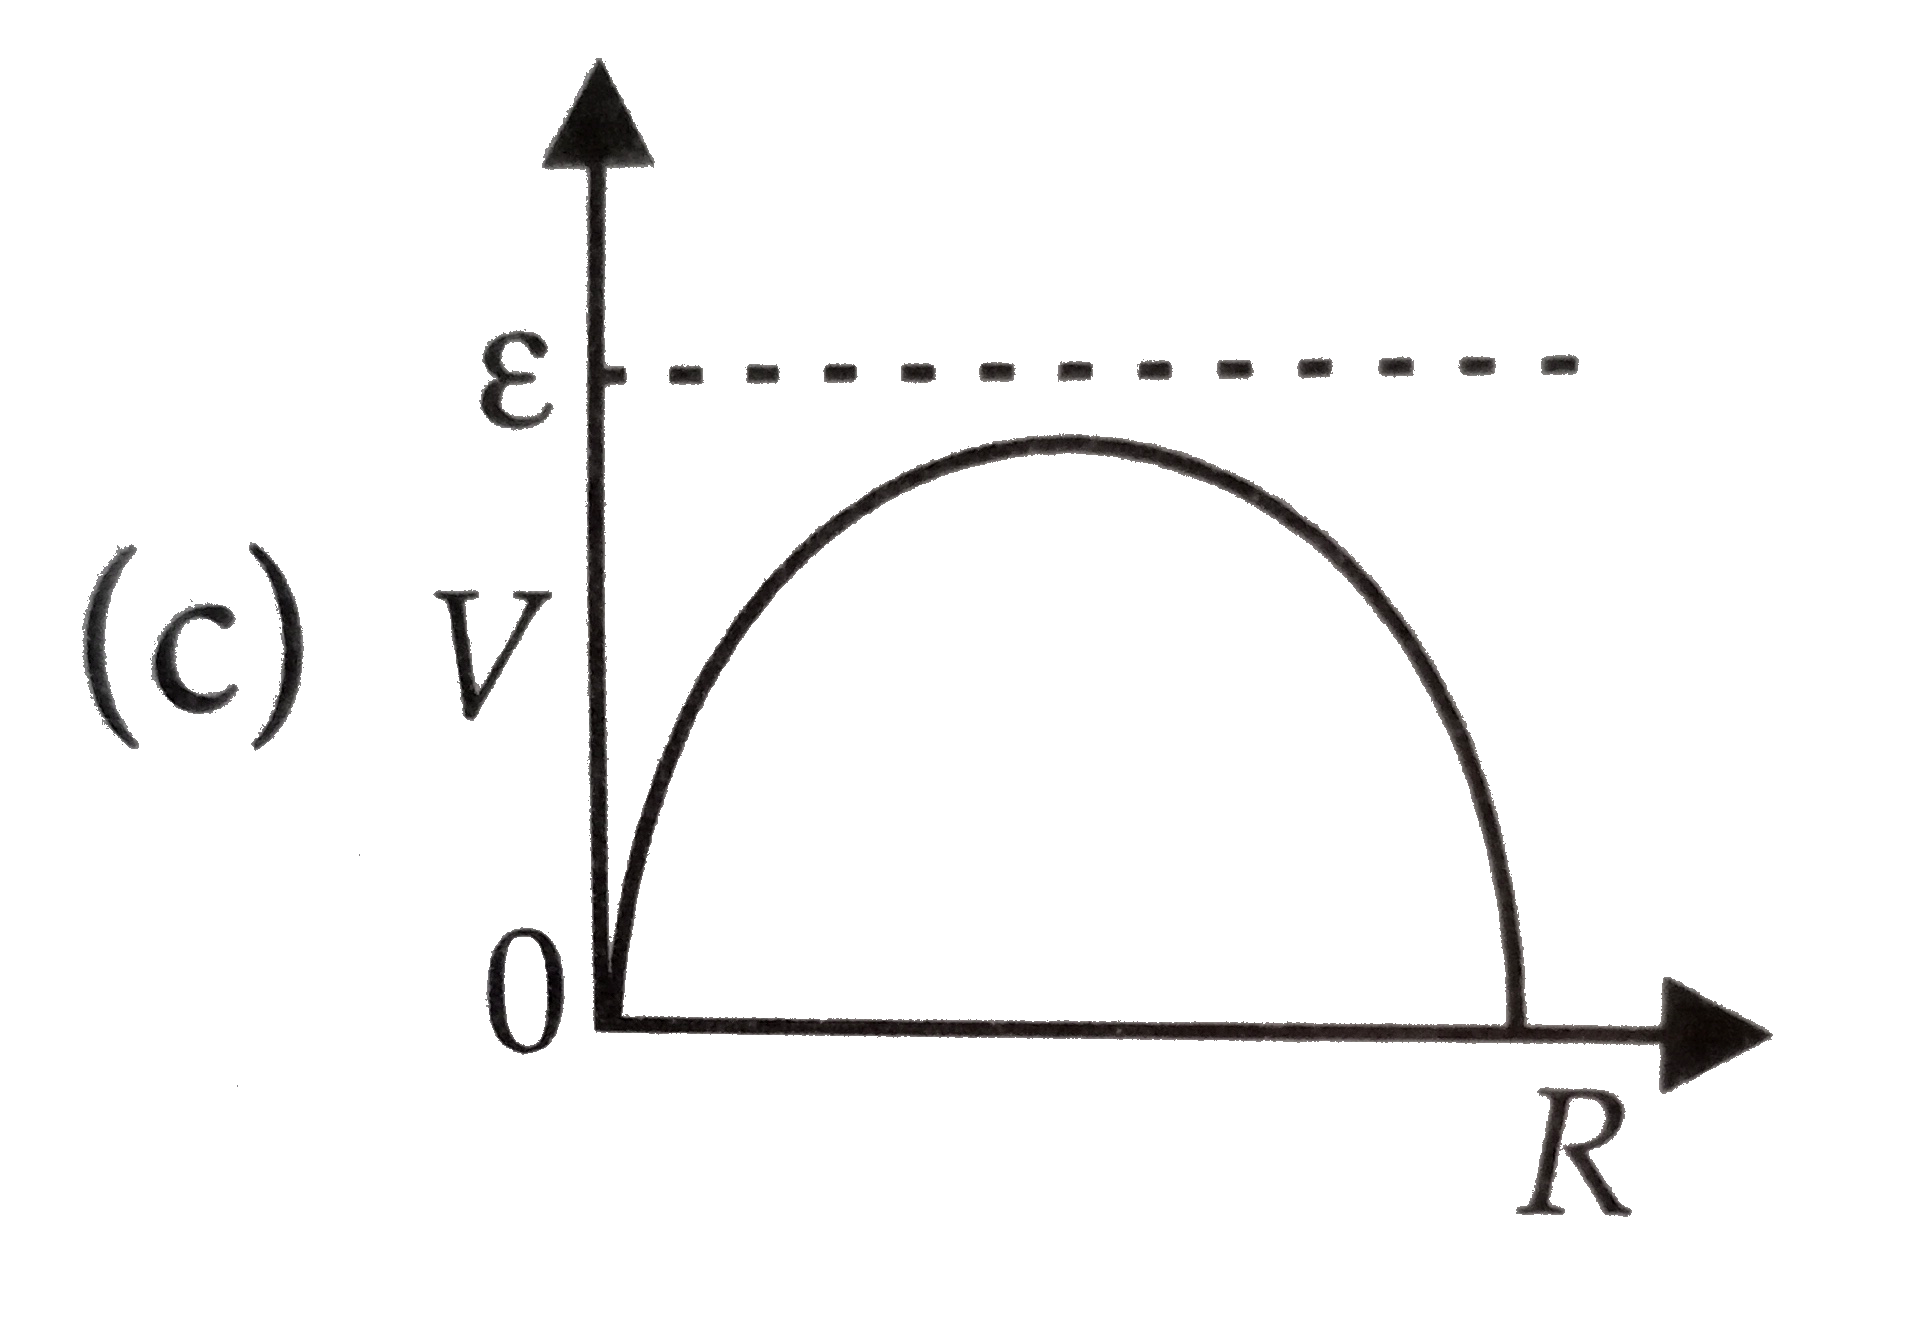 D
D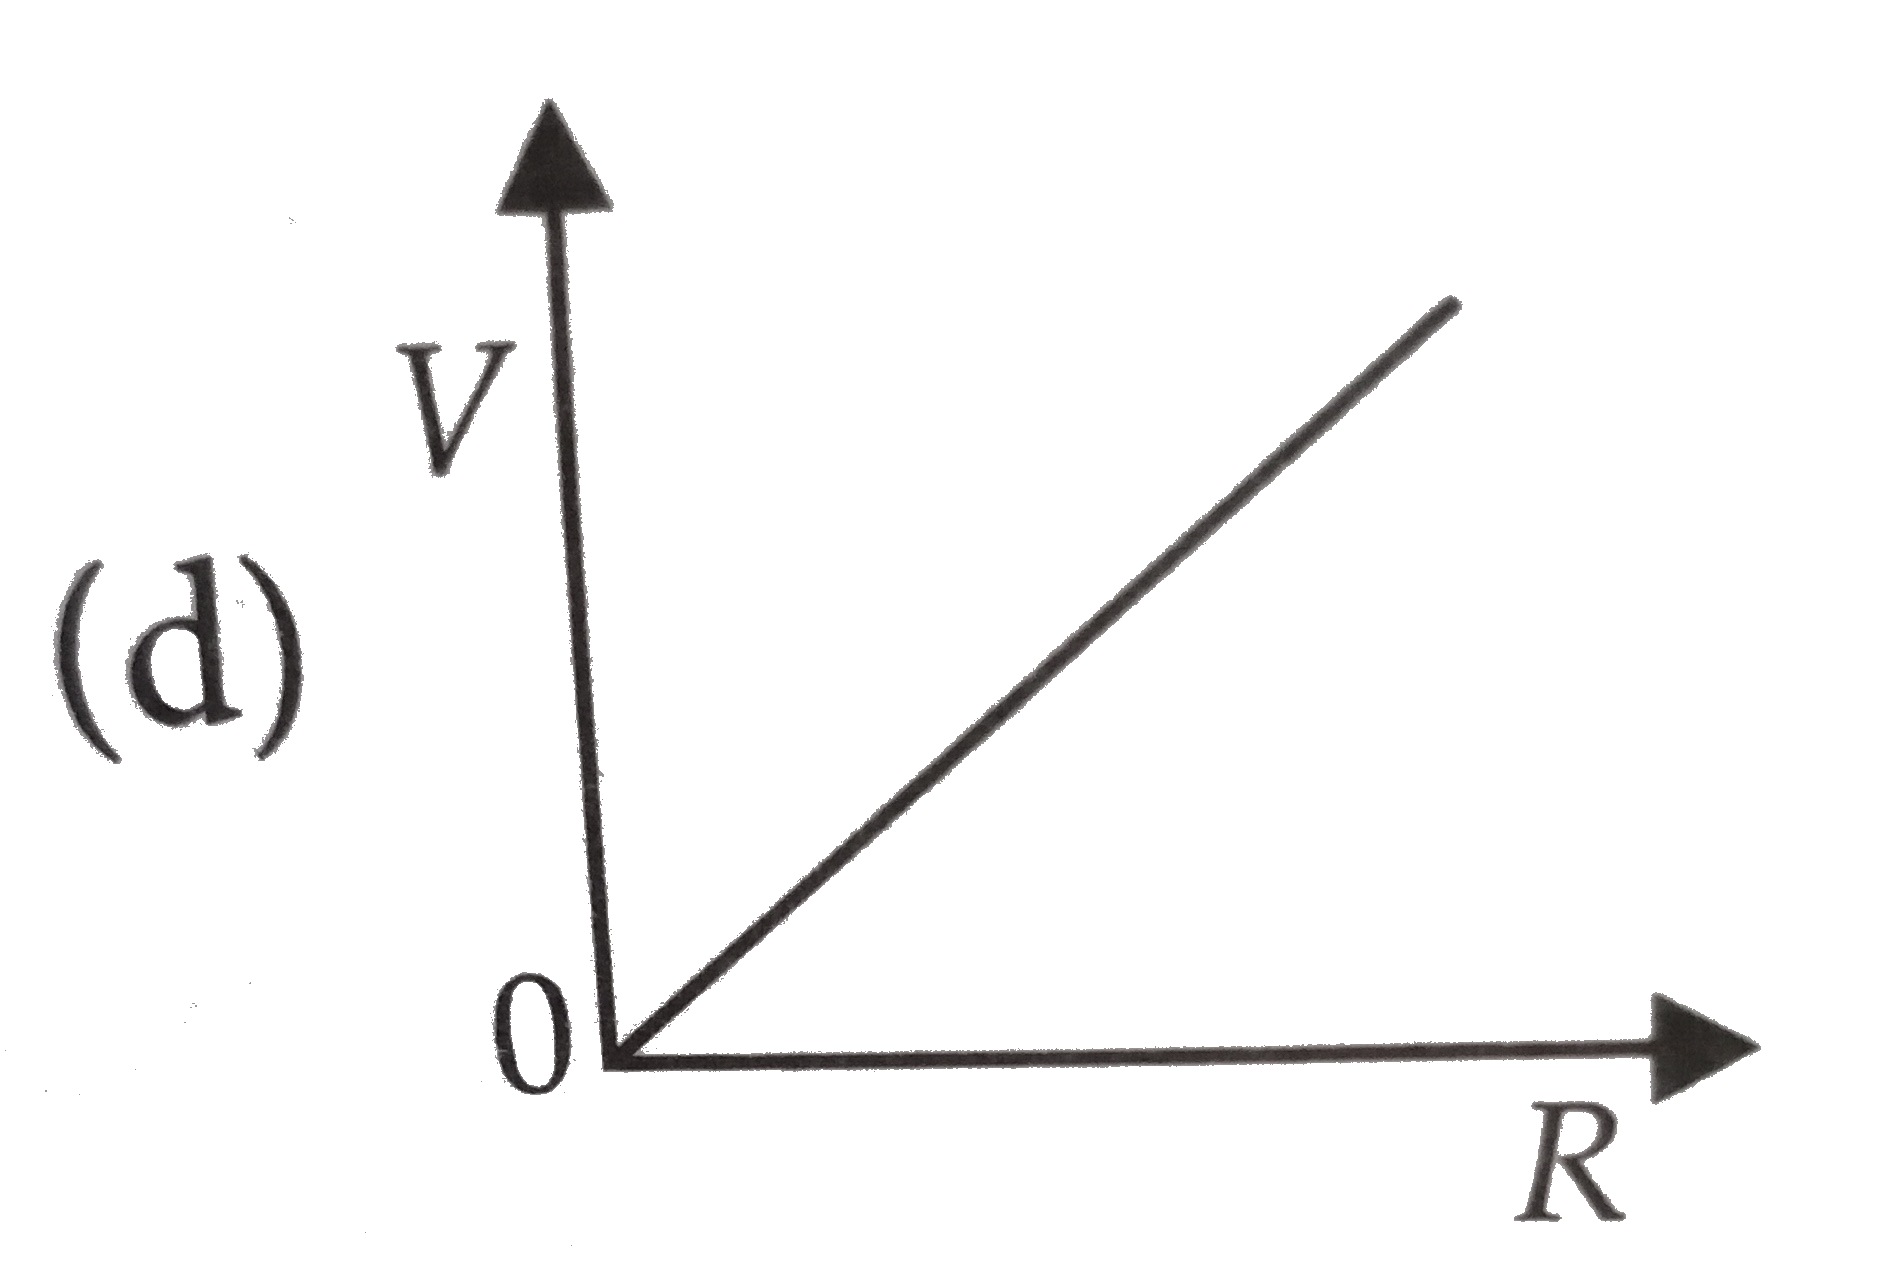
The stopping potential as a function of the frequency of the incident radiation is plotted for two different photoelectric surfaces A and B . The graphs show that work function of A is
 AlessBmoreCequalDnothing can be said
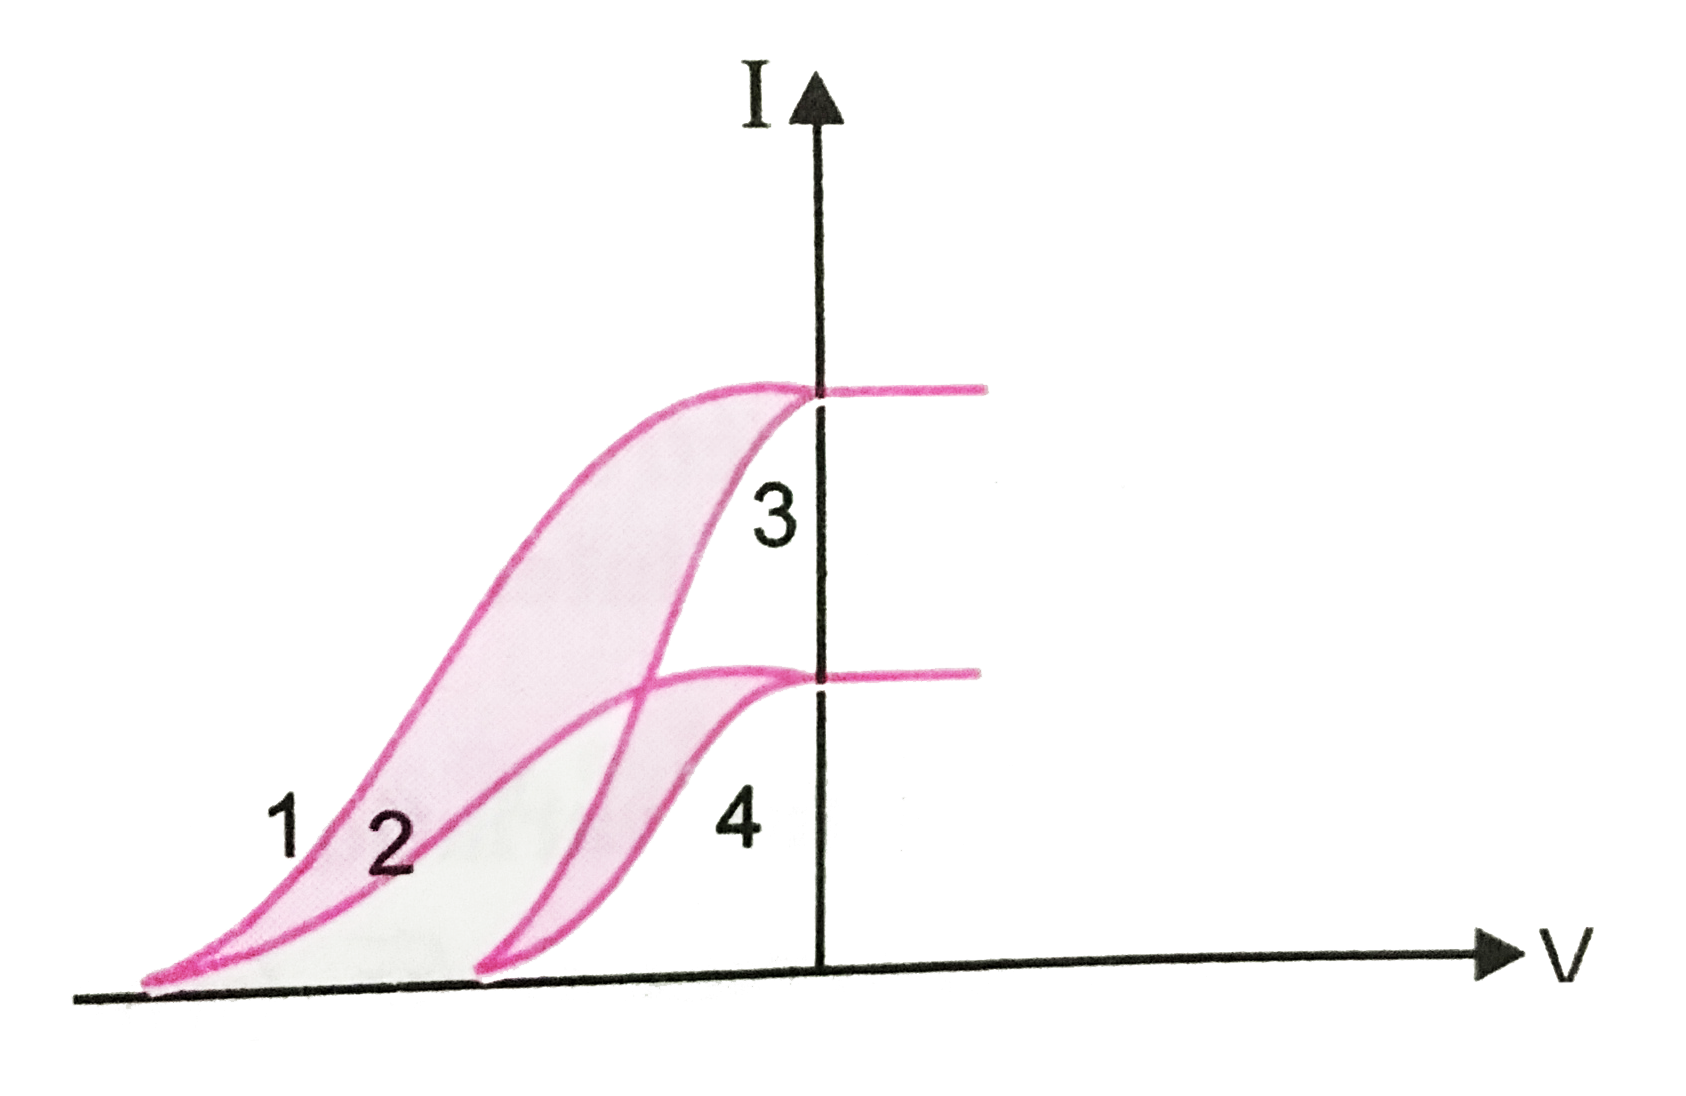
The graph of Fig. shows the variation of photoelectric current (I) versus applied voltage (V) for the two different photosensitive materials for two different intensities of the incident radiation. Identify the pairs of curves that correspond to different materials but same intensity of incident radiation.
View Solution2A cell having an emf ε and internal resistance r is connected across a variable external resistance R. As the resistance R is increased, the plot of potential difference V across R is given by
View SolutionThe curves (a),(b),(c) and (d) show the variation between the applied potential difference (V) and the photoelectric current (i) , at two different intensities of light (I1>I2). In which figure is the correct variation shown ?
View SolutionThe graph between photo electric current and cathode potential when the anode is kept at zero potential, for light of two different intensities out of the same frequency looks like the one:
View SolutionIn an experiment on the photoelectric effect, an evecuated photocell with a pure metal cothode is used. Which graph best represents the variation of B, the minimum potential defference needed to prevent current from flowing, when x, the frequency of the incident light, is varied?
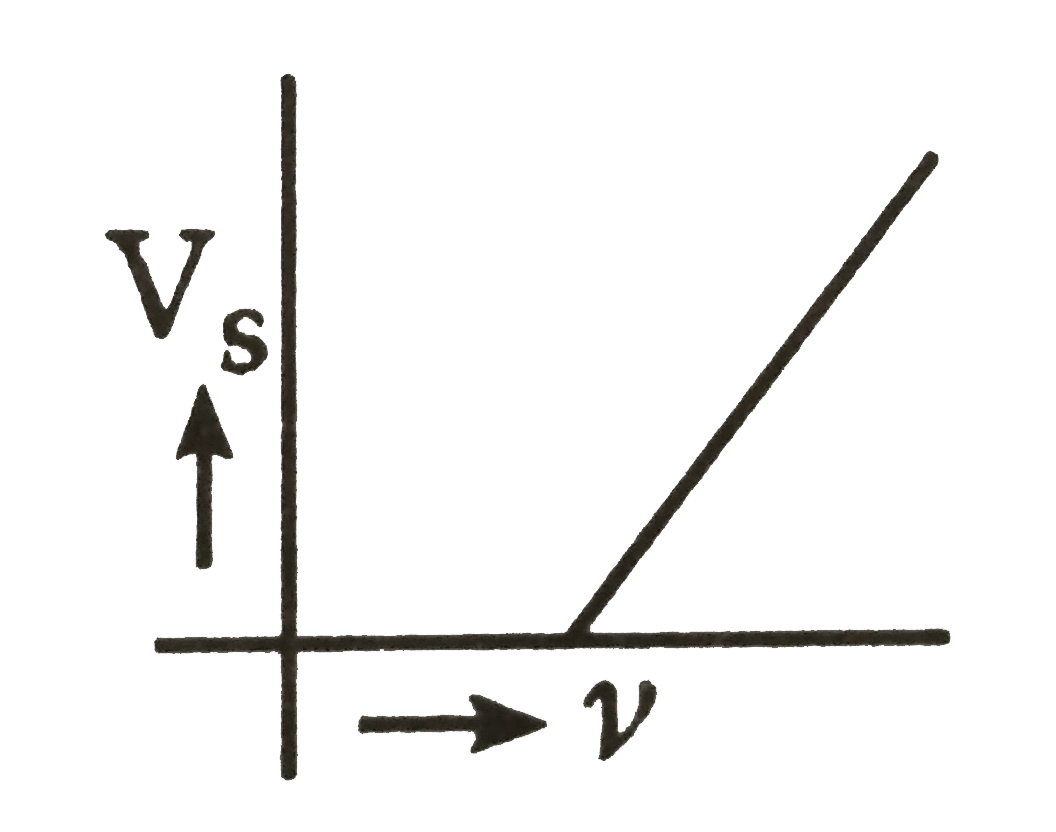
View SolutionIn photoelectric effect the slope of straight line graph between stopping potential (Vs) and frequency of incident light (v) gives
View Solution
