In a photoelectric effect experiment, the graph of stopping potential V versus reciprocal of wavelength obtained is shown in the figure. As the intensity of incident radiation is increased :
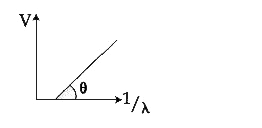
Straight line shifts of left
Straight line shifts to right
Slope of the straight line get more steep
Graph does not change
Step by step video & image solution for In a photoelectric effect experiment, the graph of stopping potential V versus reciprocal of wavelength obtained is shown in the figure. As the intensity of incident radiation is increased : by Physics experts to help you in doubts & scoring excellent marks in Class 12 exams.
Updated on:21/07/2023Topper's Solved these Questions
Similar Questions
In photoelectric effect the slope of stop of stopping potential versus frequency of incident light for a given surface will be
View Solution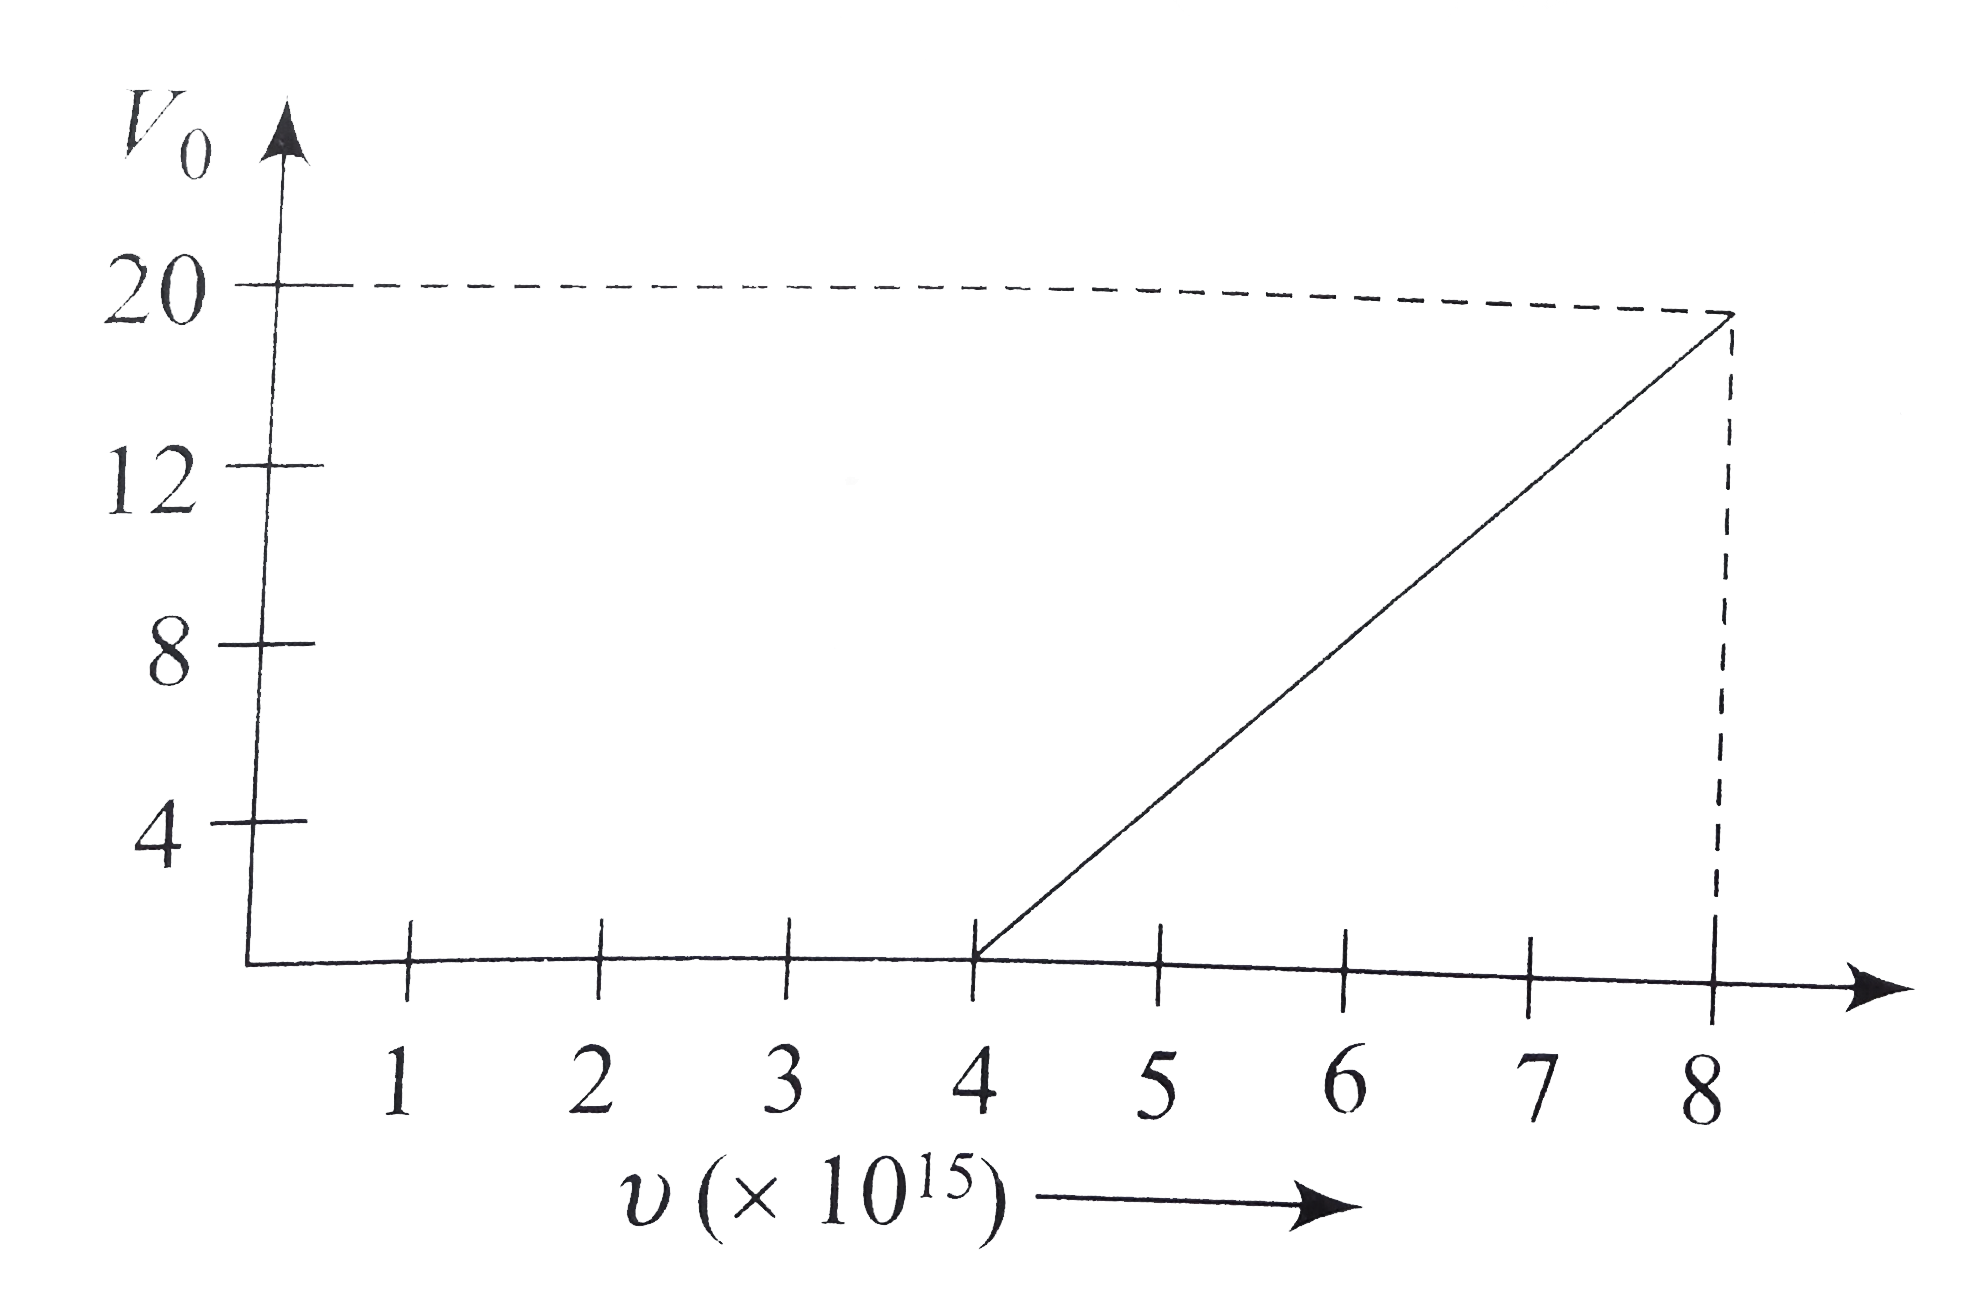
When a high frequency electromagnetic radiation is incident on a metallic surface, electrons are emitted from the surface. Energy of emitted photoelectrons depends only on the frequency of incident electromagnetic radiation and the number of emitted electrons depends only on the intensity of incident light.
Einstein's protoelectron equation [Kmax=hv−ϕ] correctly ecplains the PE, where υ= frequency of incident light and ϕ= work function.
Q. For photoelectric effect in a metal, the graph of the stopping potential V0 (in volt) versus frequency υ (in hertz) of the incident radiation is shown in Fig. The work function of the metal (in eV) is.
View Solution
Knowledge Check
In photoelectric effect experiment, the slope of the graph of the stopping potential versus frequency gives the value of :
AheBhCehDhceA student performs an experiment on photoelectric effect using two materials A and B. A plot of stopping potential (V0) vs freqency (v) is as shown in the figure.
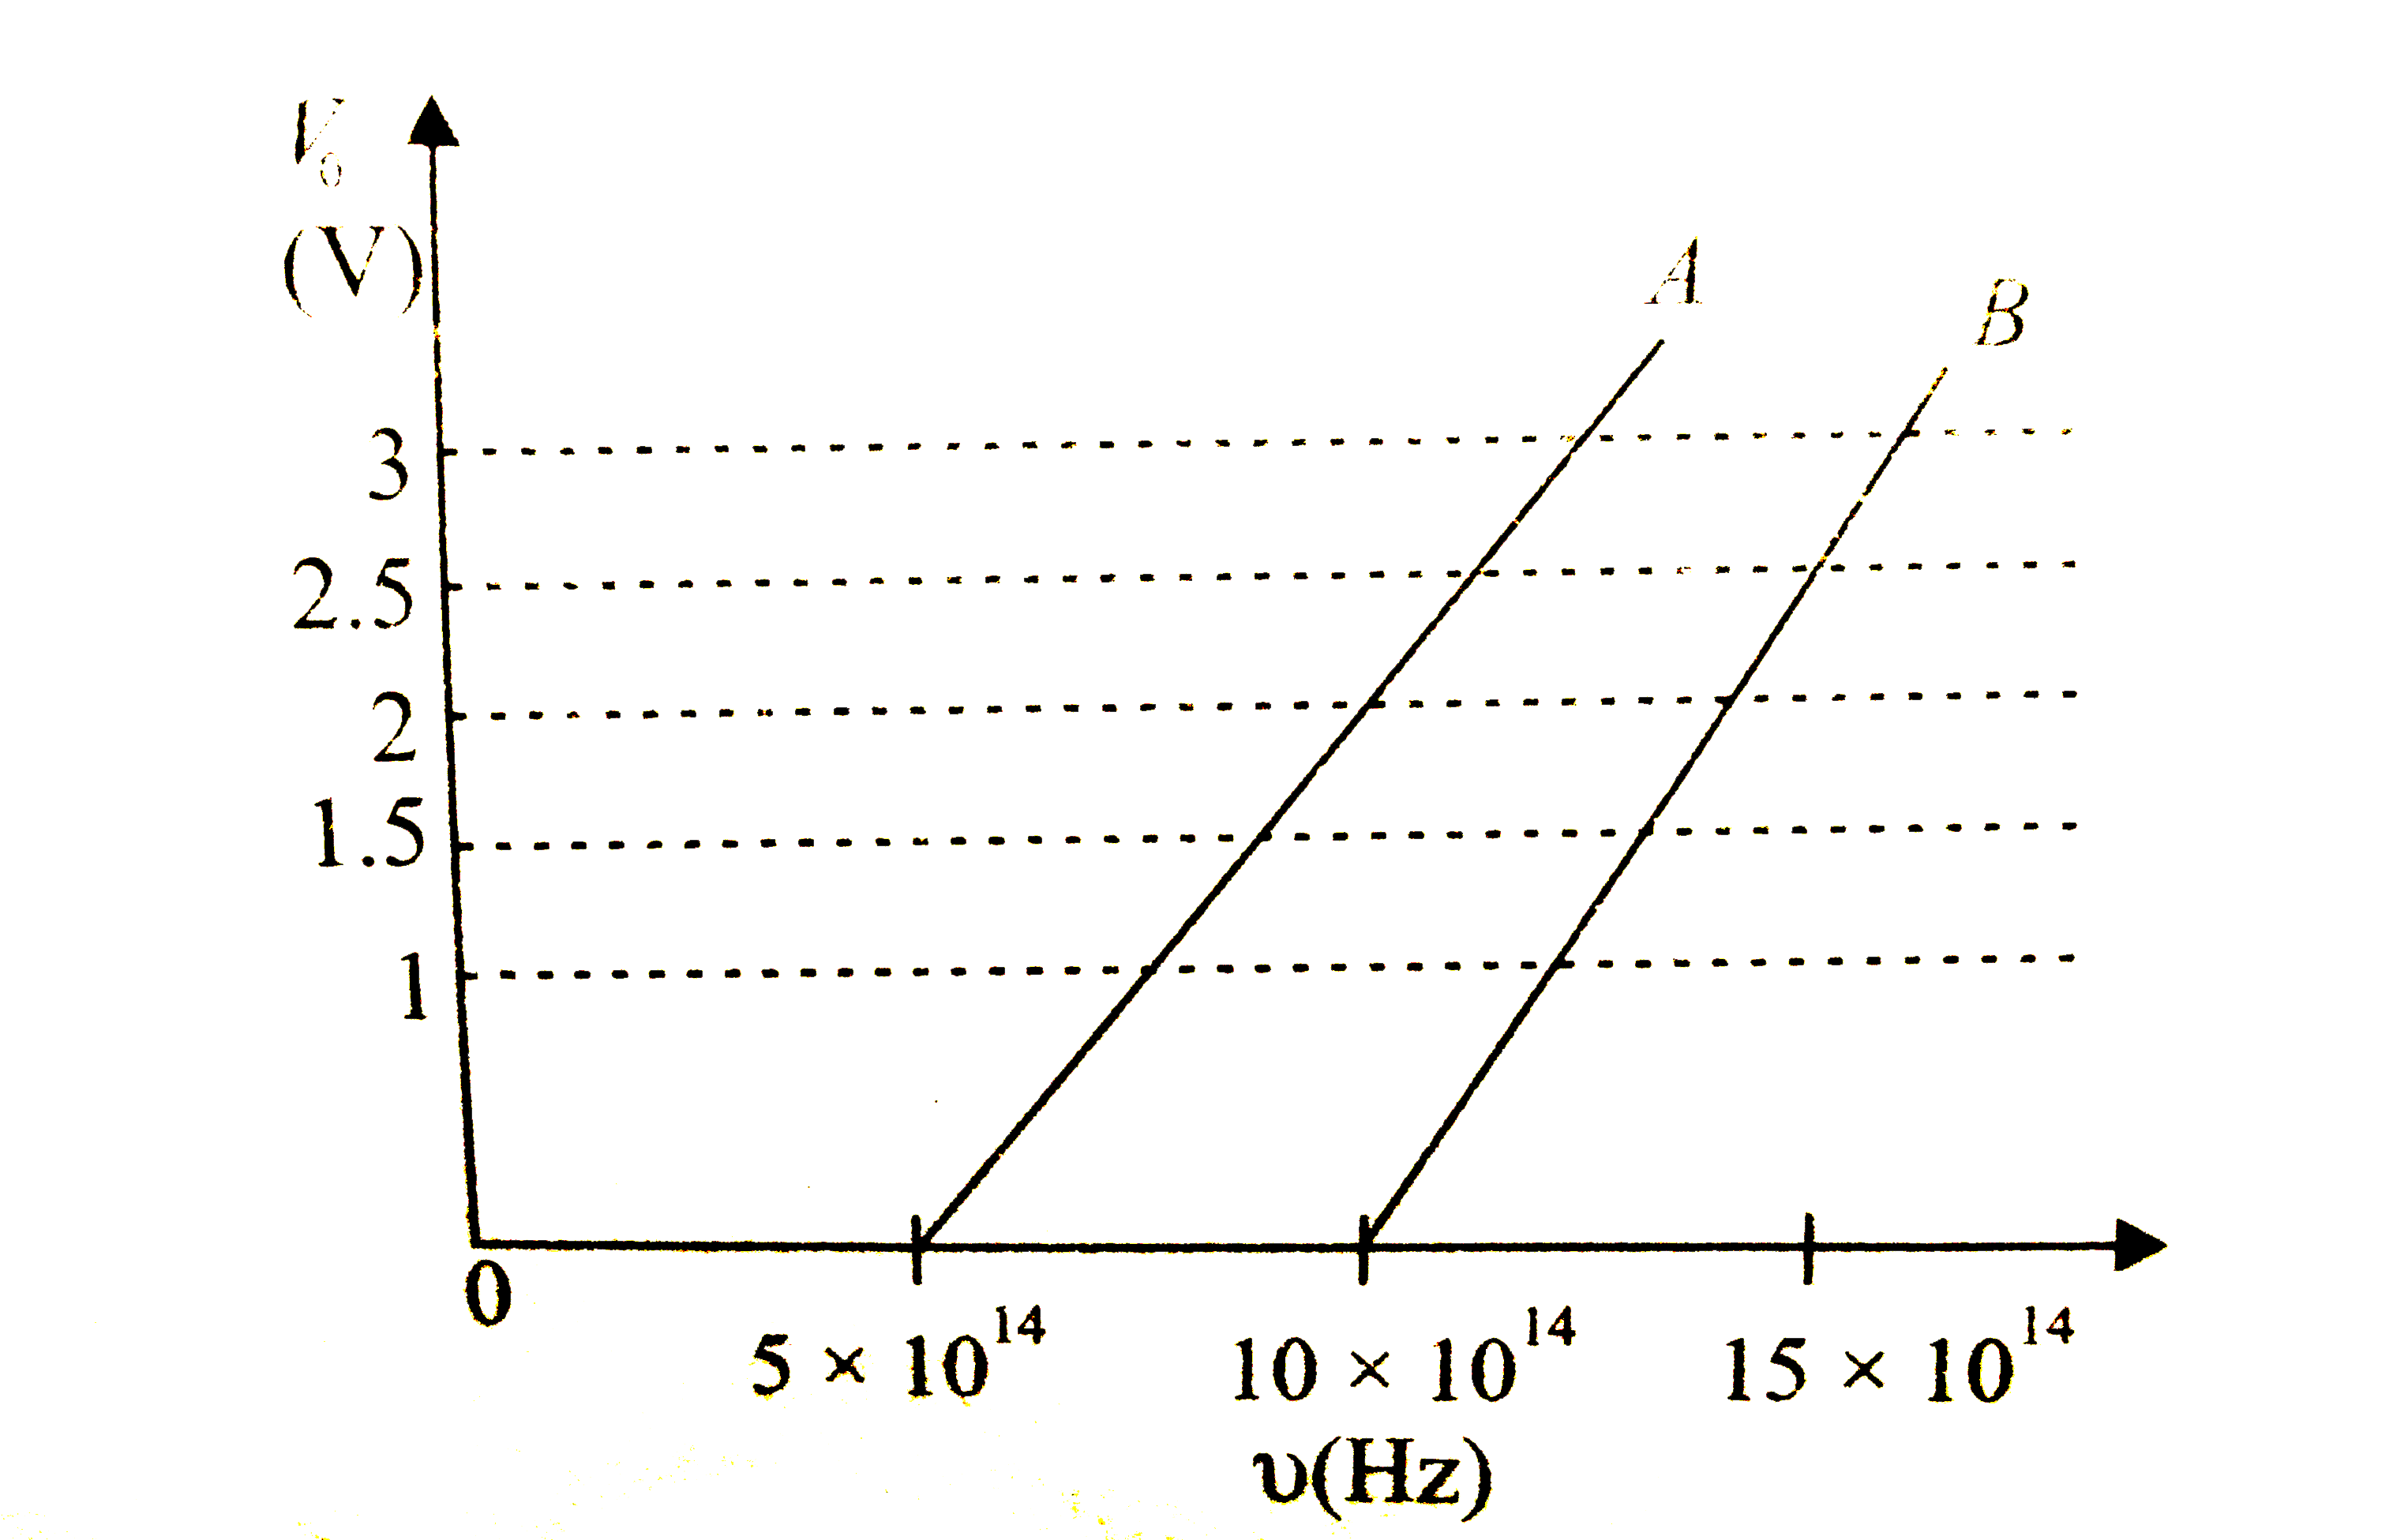
The value of h obtained from the experiment for both A and B respectively is
(Given electric charge of an electron =1.6×10⁻¹⁹C)A3.2×10−34Js,4×10−34JsB6.4×10−34Js,8×10−34JsC1.2×10−34Js,3.2×10−34JsD4.2×10−34Js,5×10−34JsIn a photoelectric experiment, the graph of frequency v of incident light (in Hz) and stopping potential V (in V) is as shown in the figure. Planck's constant is (e is the elementary charge)
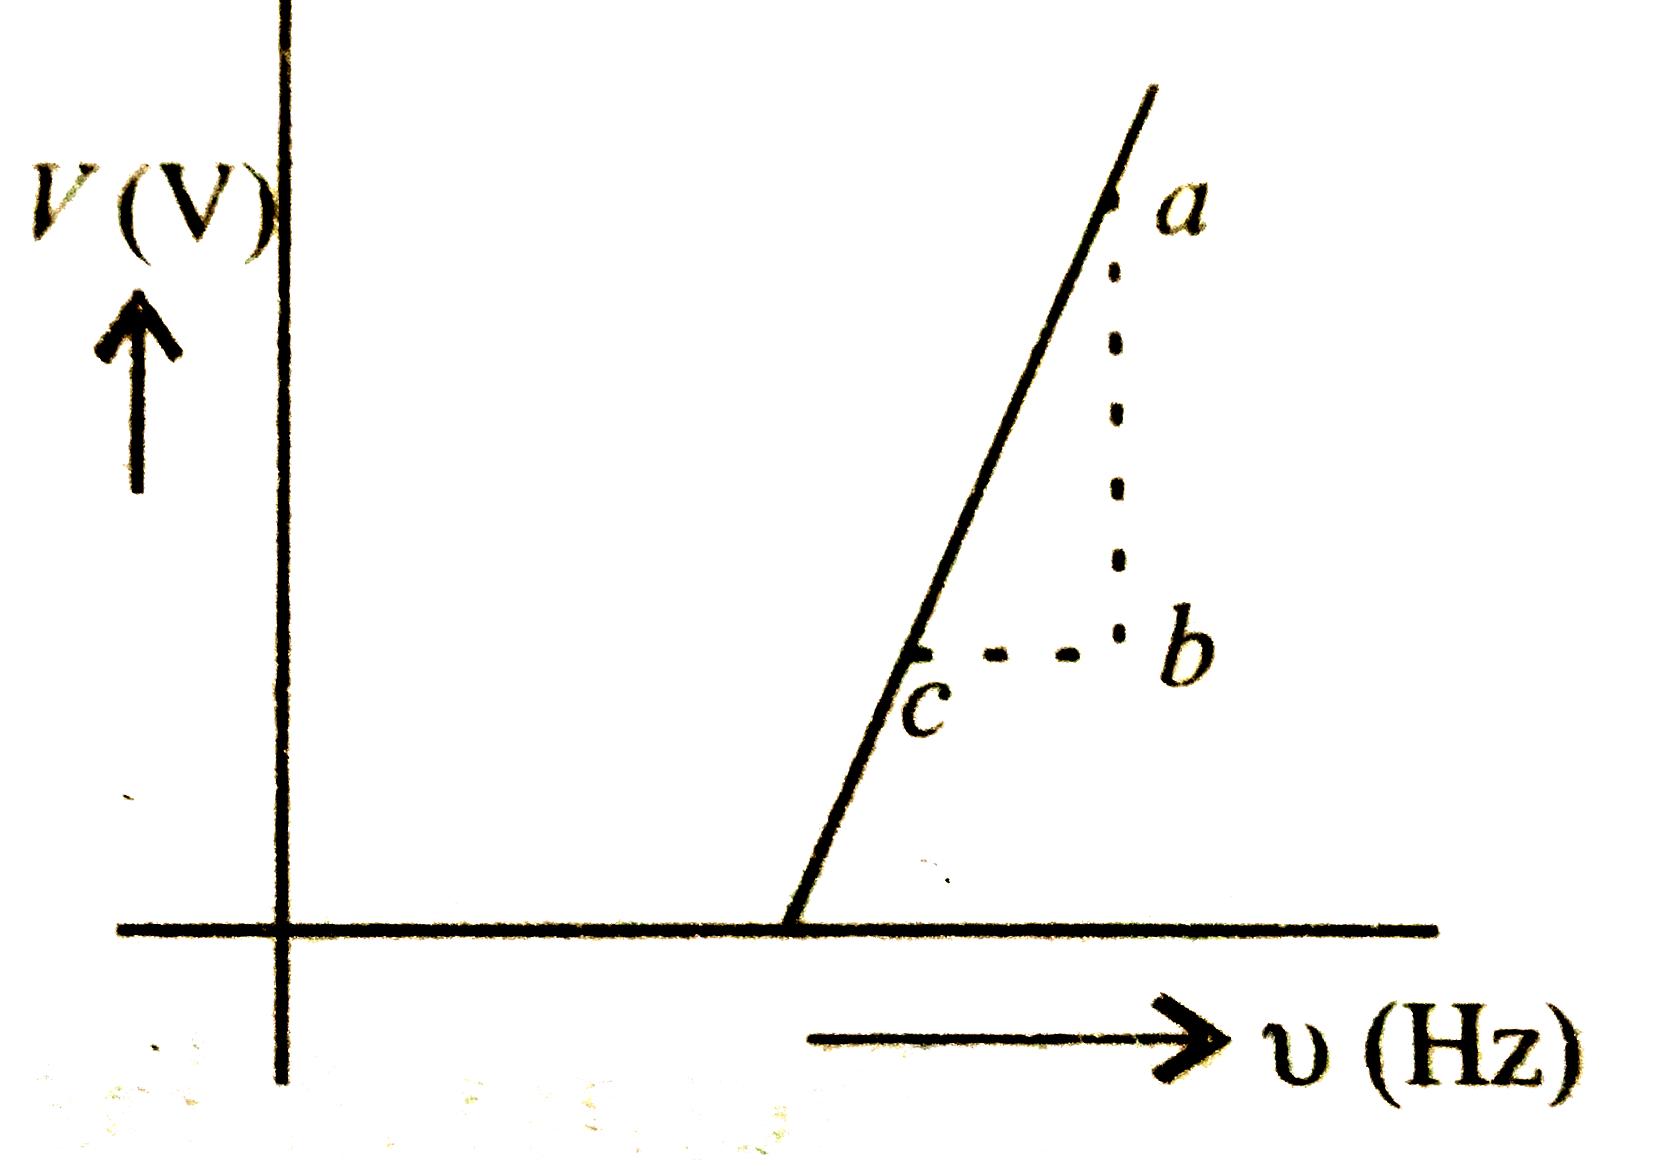 AeabbcBecbacCeacbcDeacab
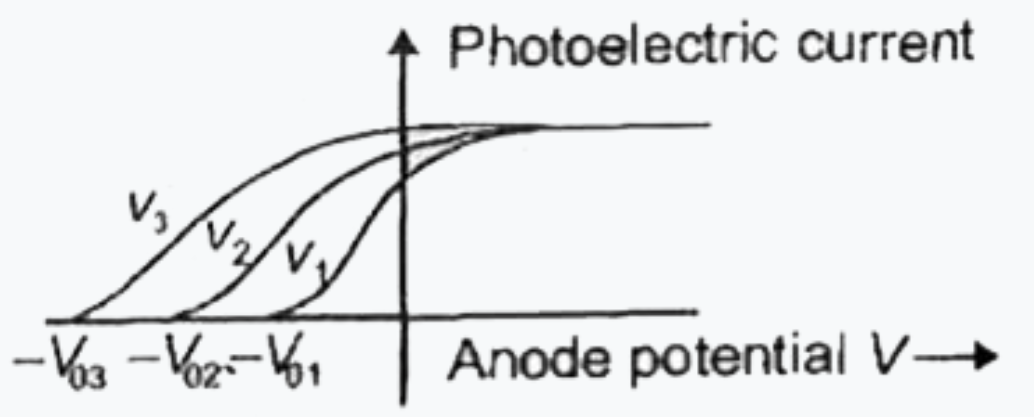
In photoelectric effect , the curve between photoelectric current and anode potential V (for different frequencies ) is shown in figure , then
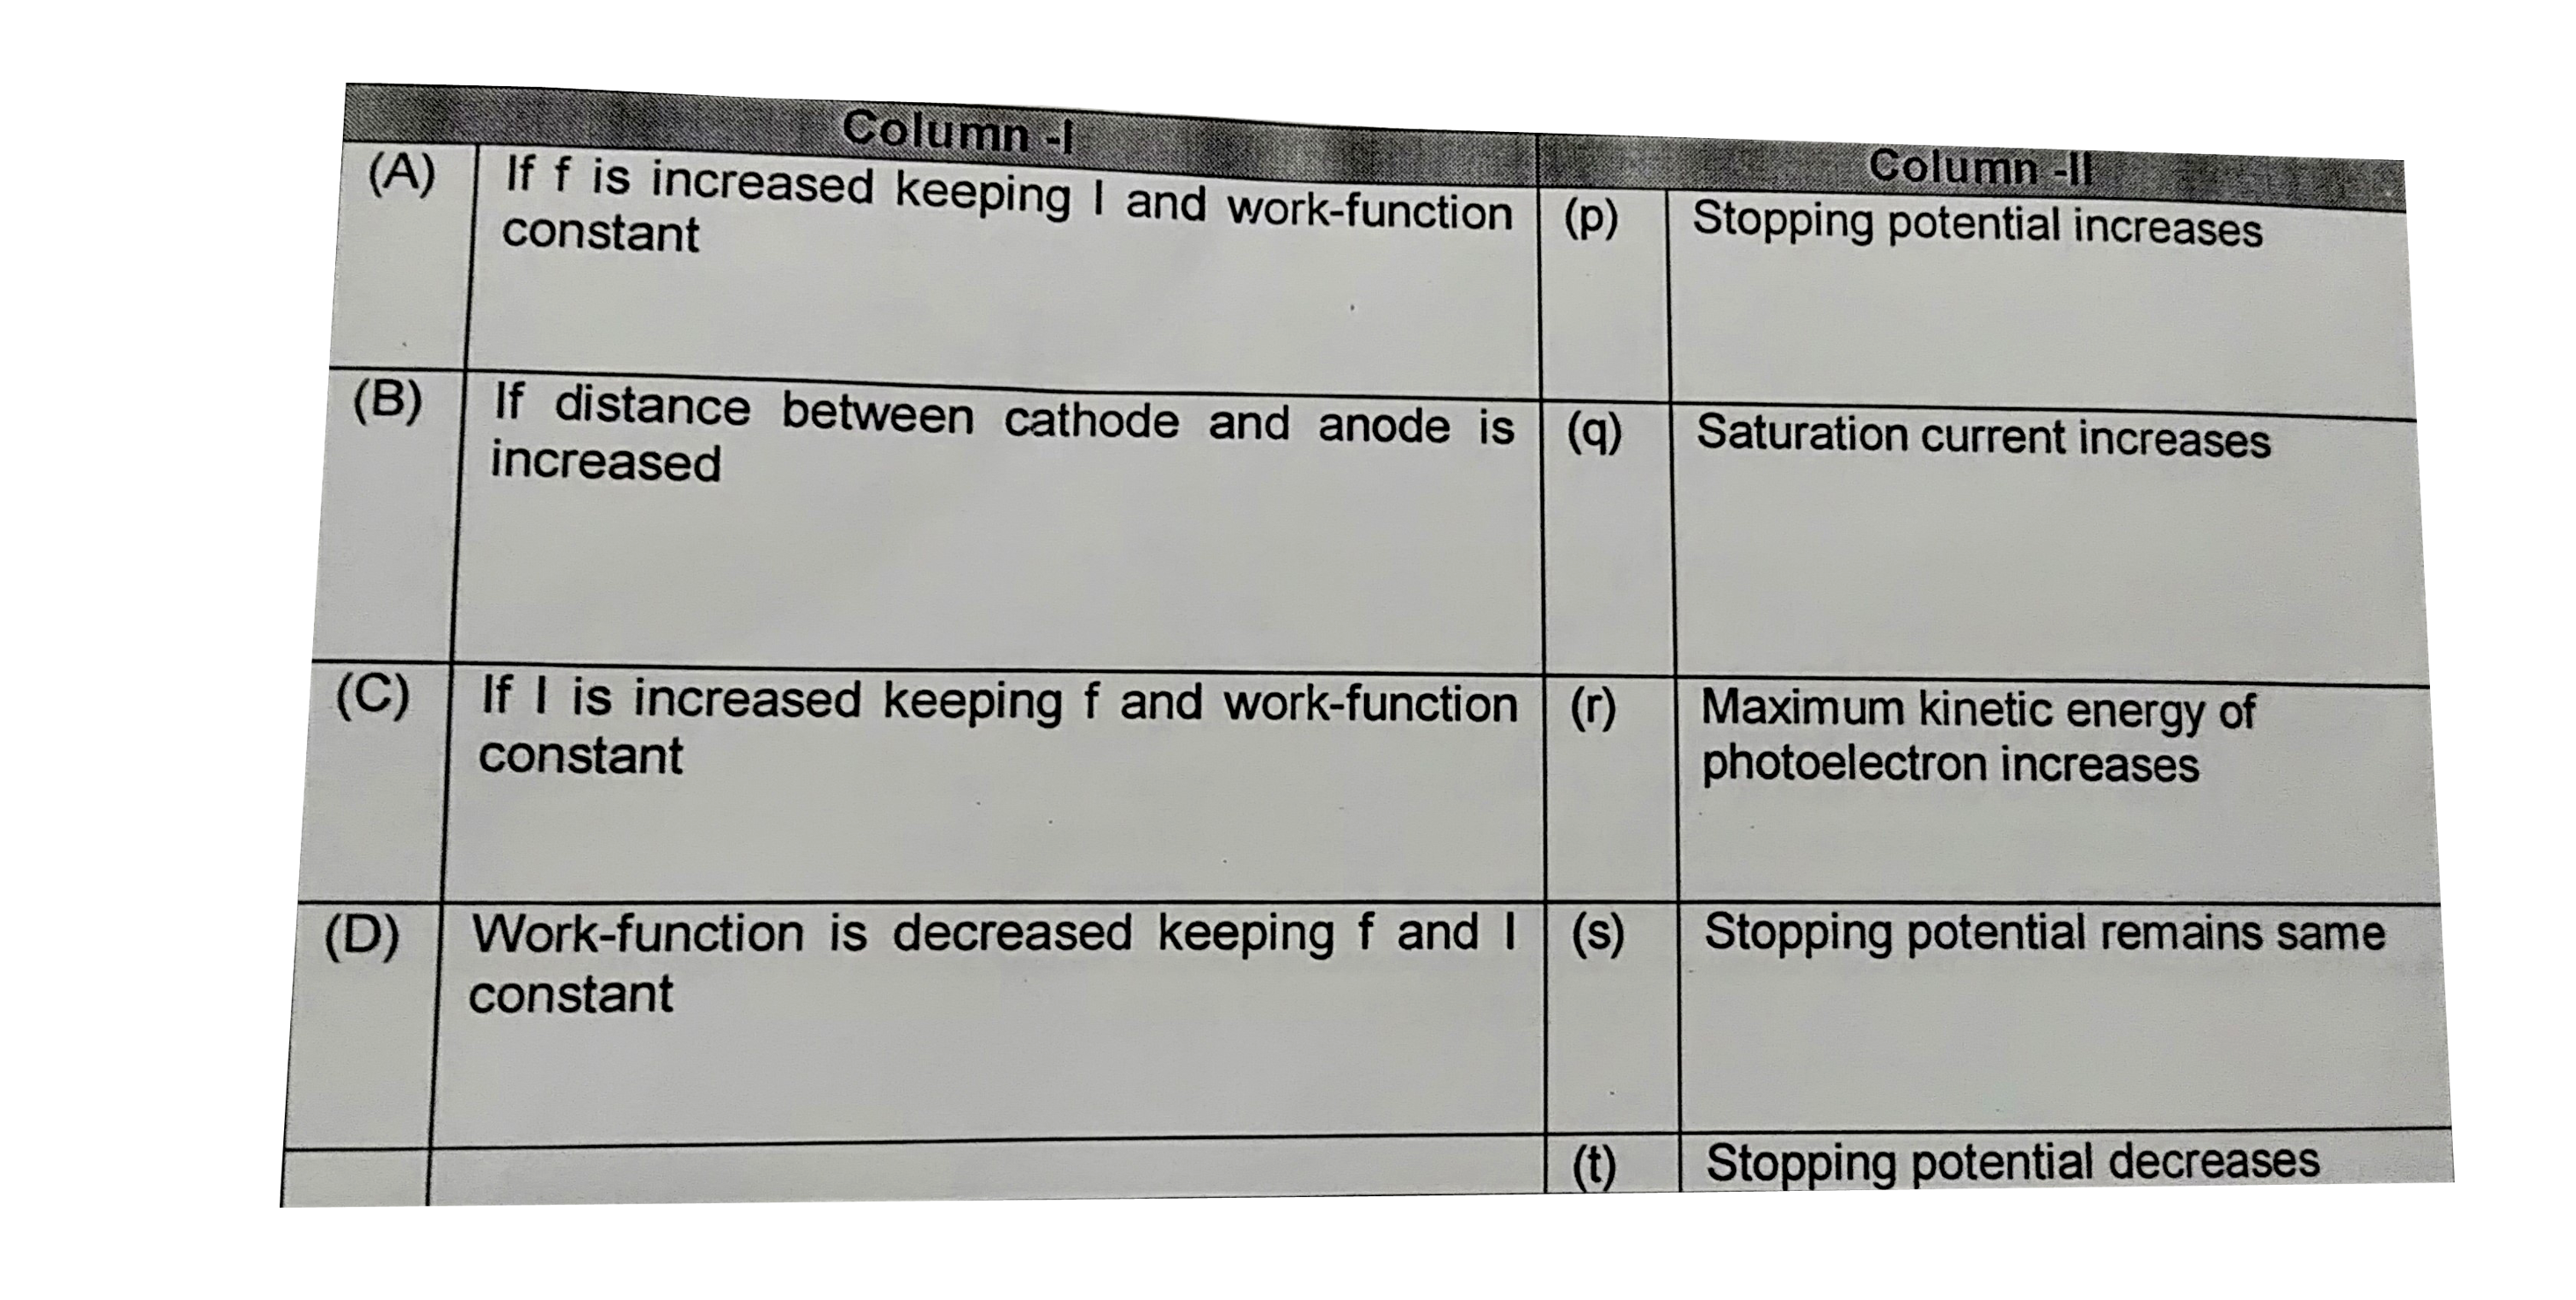
View SolutionIn the photoelectric effect experiment, if f is the frequency of radiation incident on the metal surface and I is the intensity of the intensity radiations, then match the following columns:
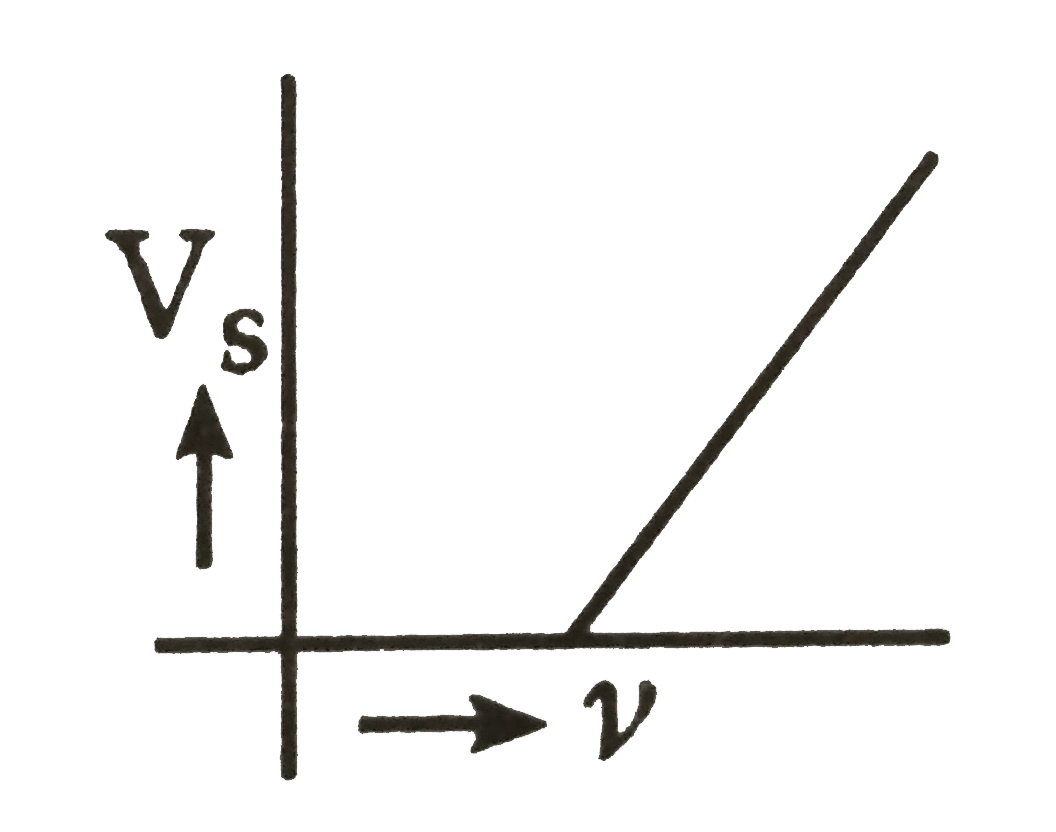
View SolutionIn photoelectric effect the slope of straight line graph between stopping potential (Vs) and frequency of incident light (v) gives
View SolutionWhat is the photoelectric effect? With the help of suitable graph show the variation of photocurrent with (i) the intensity of incident radiation. (ii) the voltage applied between cathode and anode. (iii) the frequency of incident radiation.
View SolutionIn a photoelectric effect experiment, stopping potential changes by 30 volt if we change frequency of the radiation. Then the magnitude of change in the frequency is : (h=6×10⁻³⁴J−s)
View Solution
