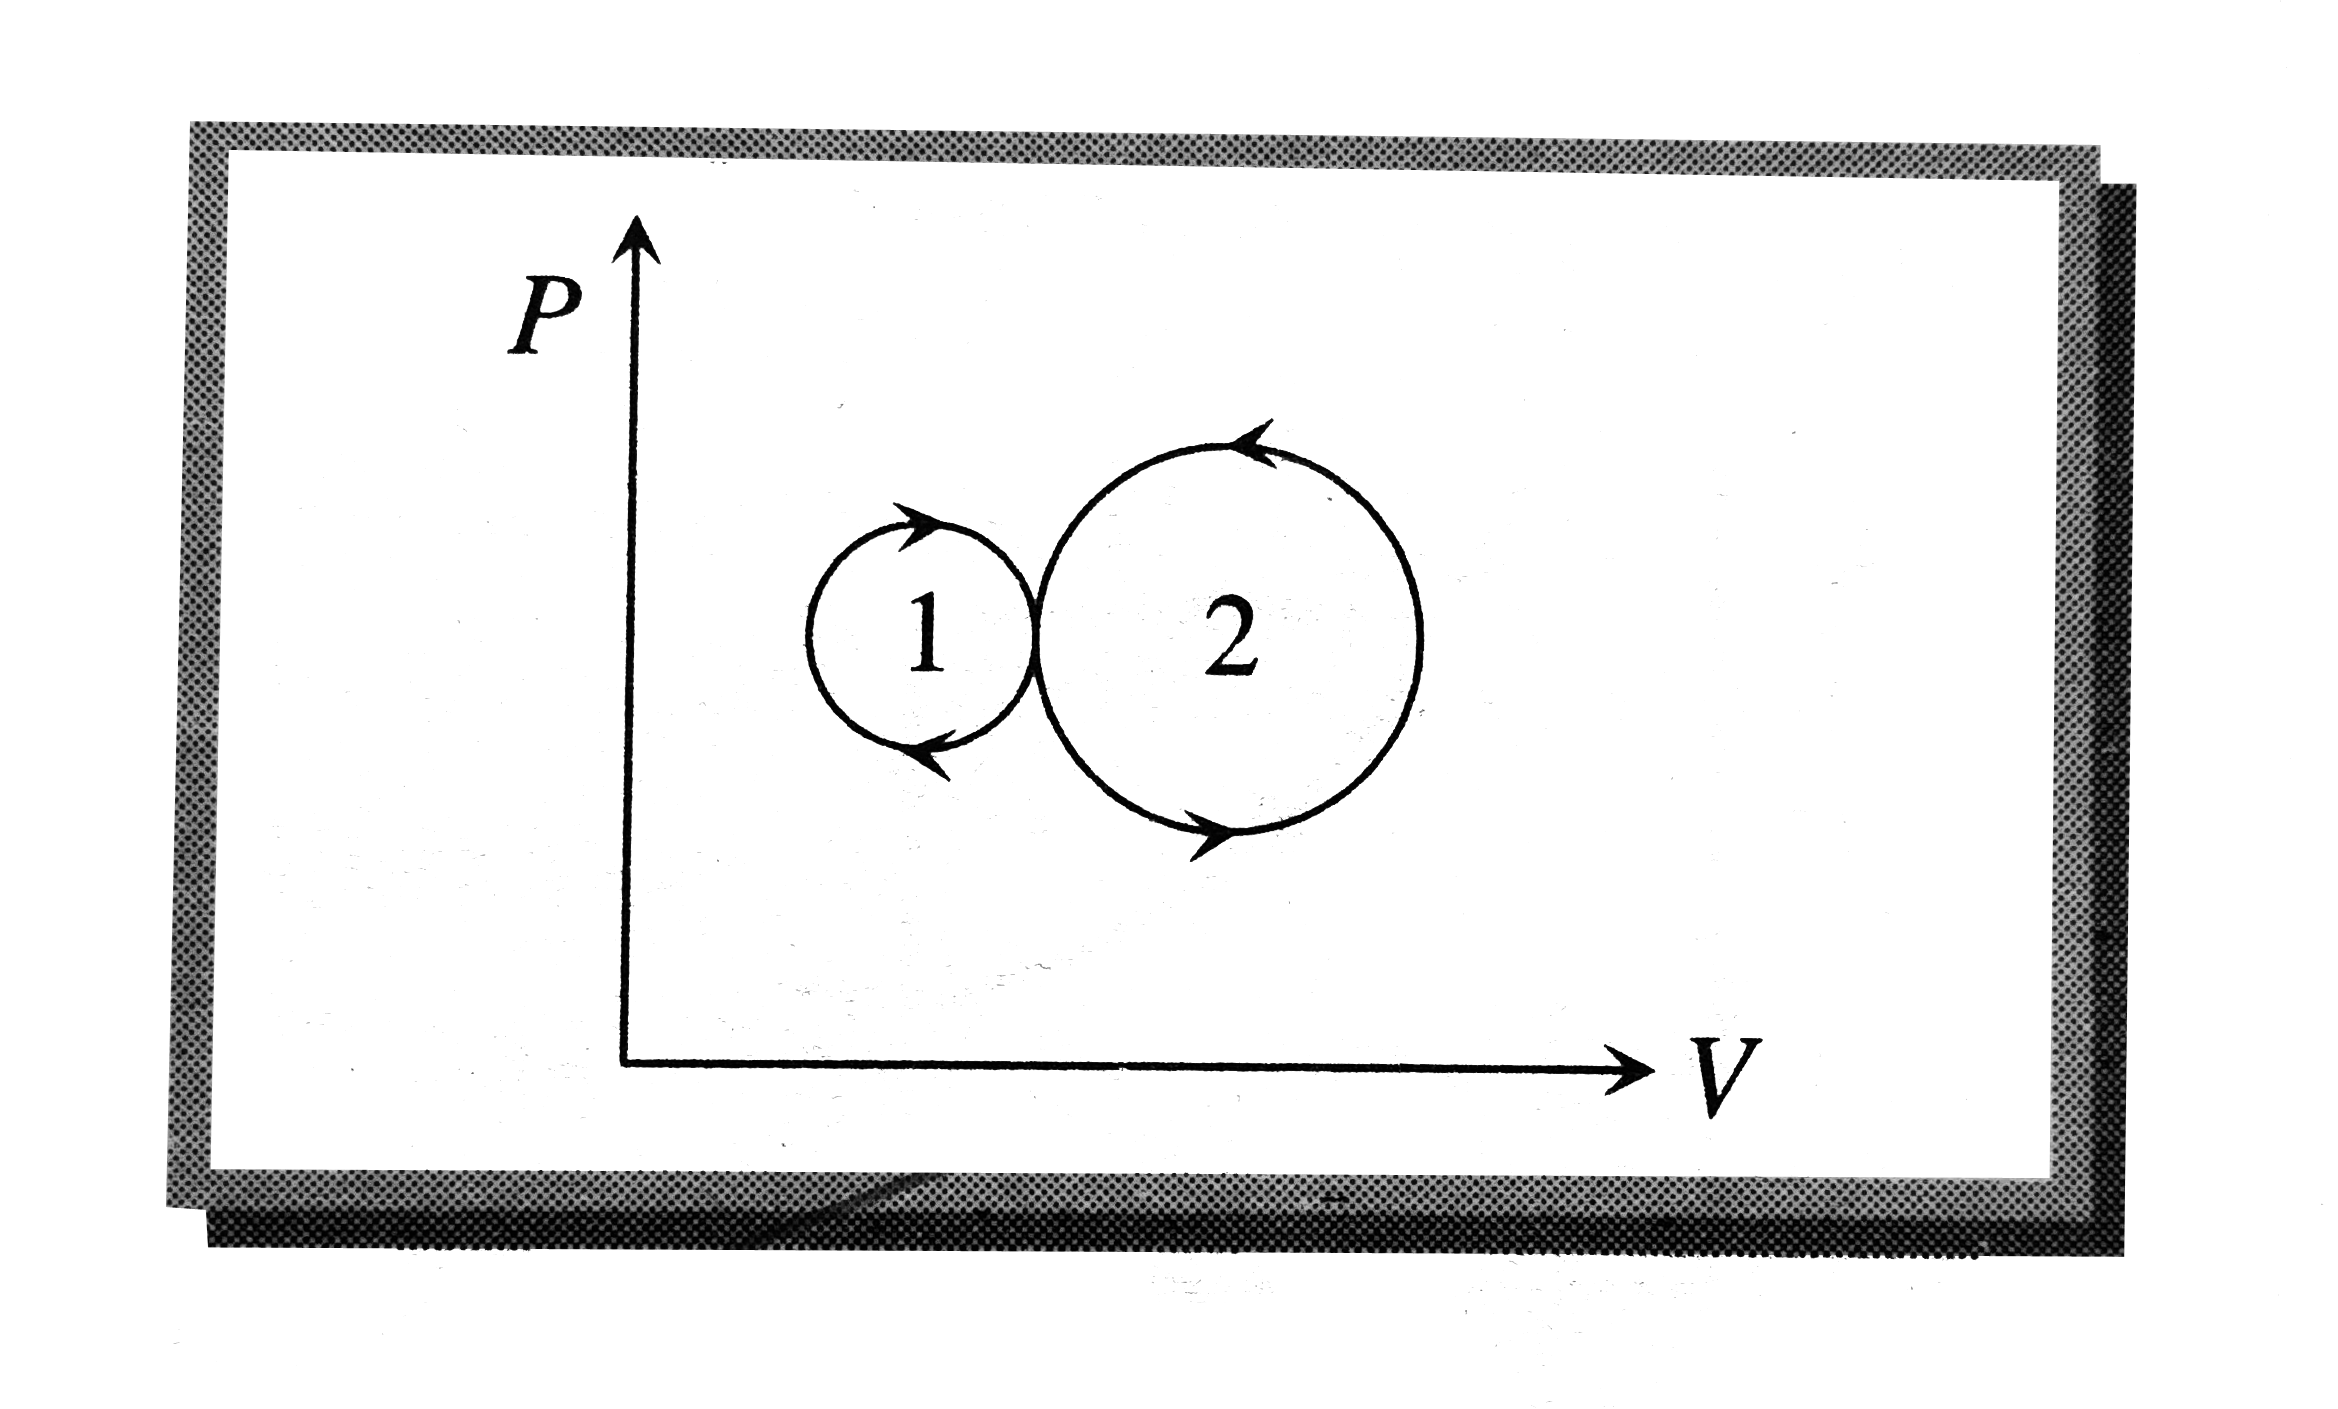
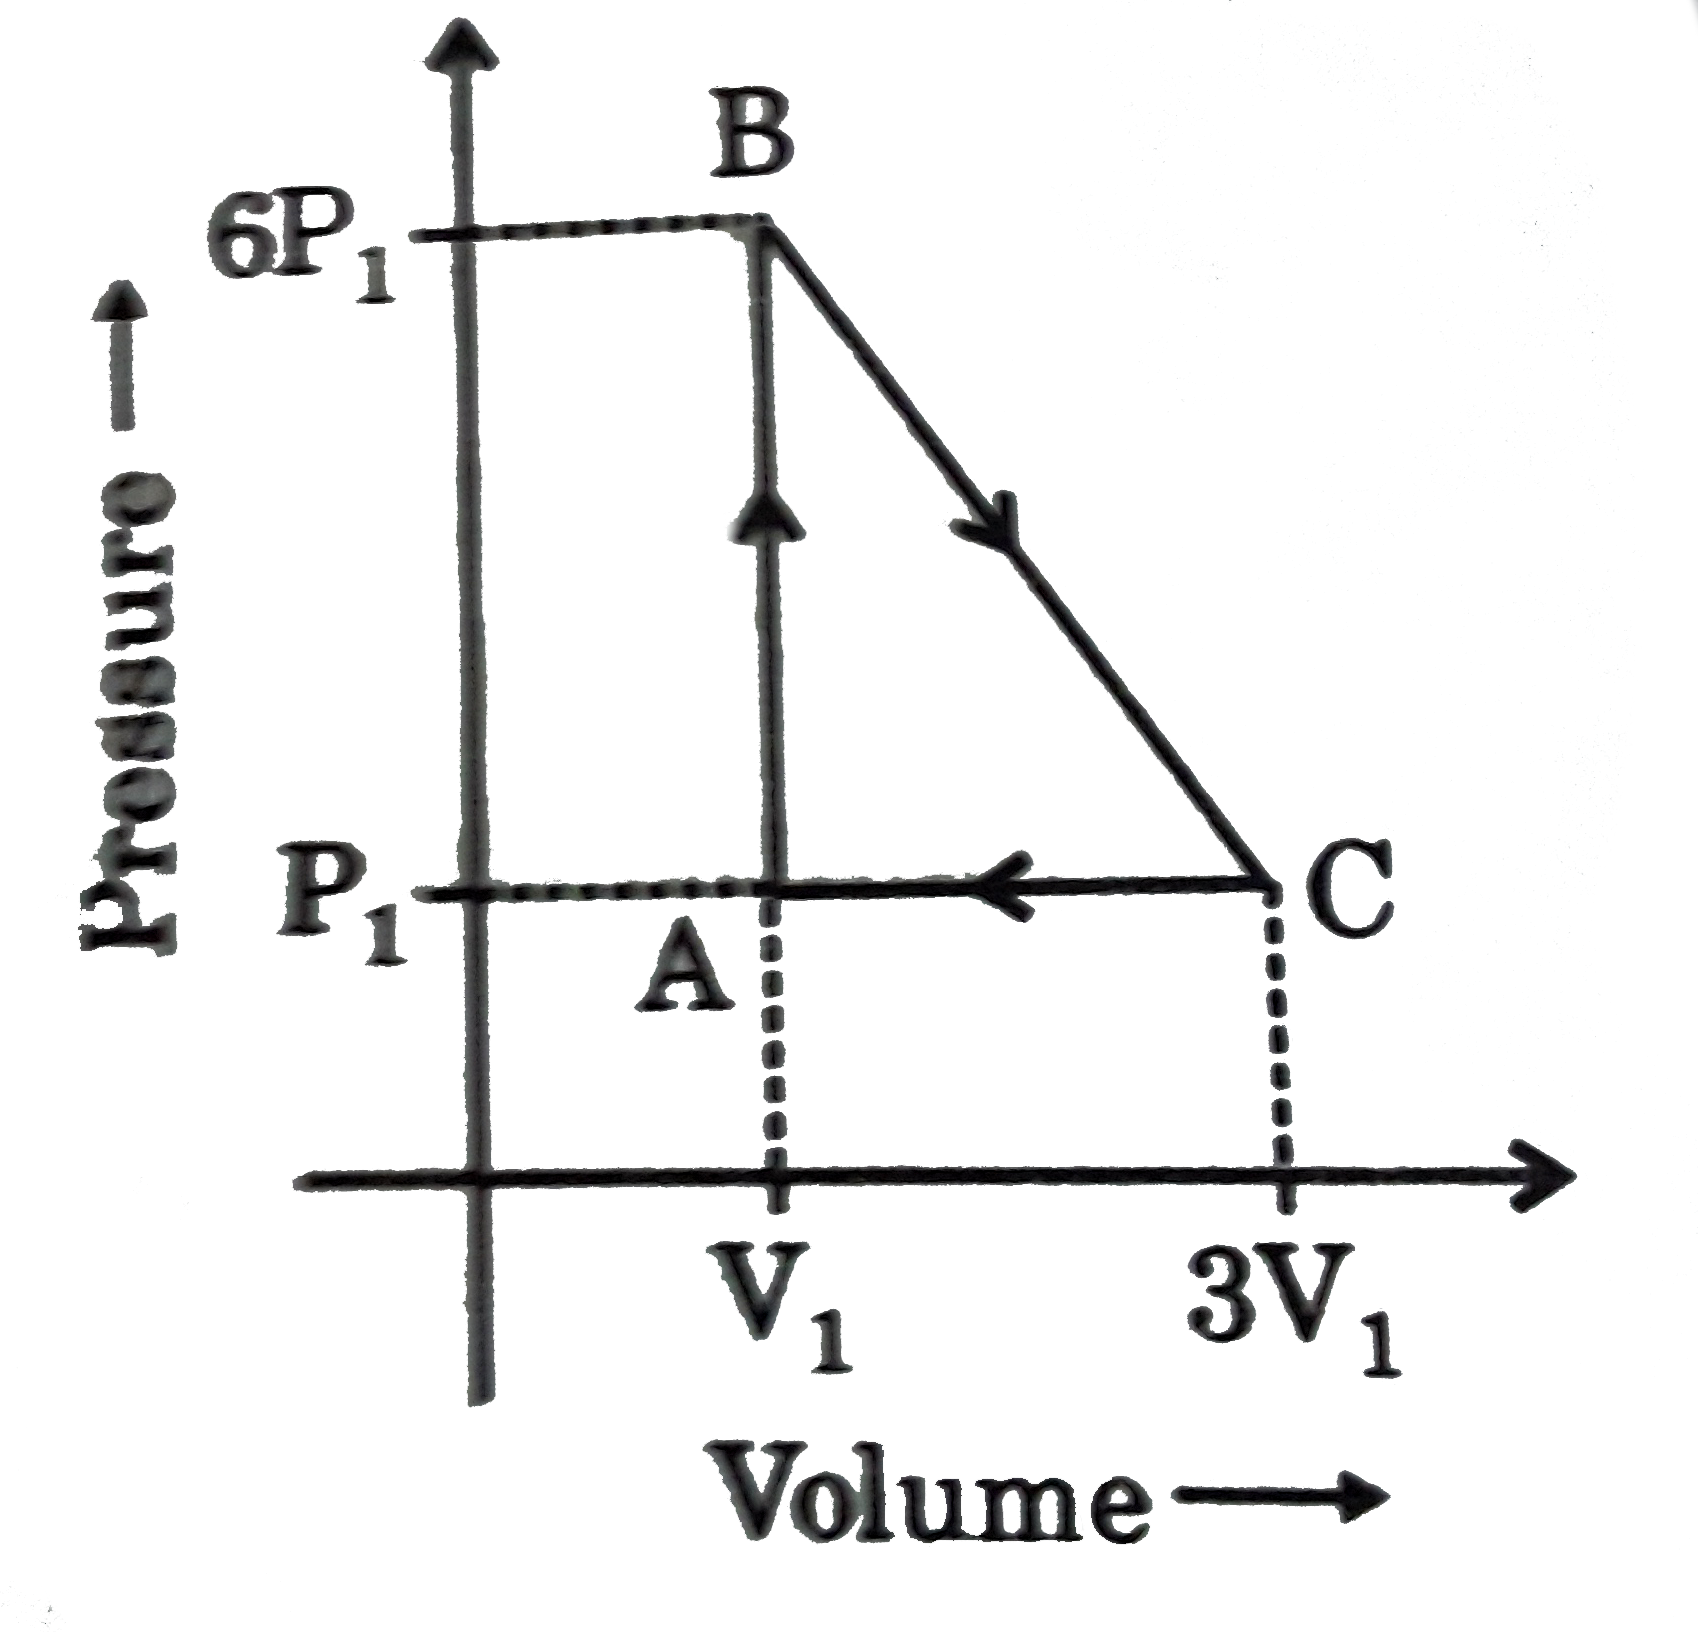
In the following indicator diagram, the net amount of work done will be
positive
negative
zero
infinity
The correct Answer is:B
b. Work done during process 1 is positive while during process 2 it is negative, because process 1 is clockwise while process 2 is anticloc wise. But area enclosed graph (i.e., work done) in process 1 is smaller, so net work done will be negative.
Topper's Solved these Questions
- BOOK - CENGAGE PHYSICS ENGLISHCHAPTER - KINETIC THEORY OF GASES AND FIRST LAW OF THERMODYNAMICSEXERCISE - Multiple Corrects29videos
KINETIC THEORY OF GASES AND FIRST LAW OF THERMODYNAMICS
- BOOK - CENGAGE PHYSICS ENGLISHCHAPTER - KINETIC THEORY OF GASES AND FIRST LAW OF THERMODYNAMICSEXERCISE - Assertion-Reasoning6videos
KINETIC THEORY OF GASES AND FIRST LAW OF THERMODYNAMICS
- BOOK - CENGAGE PHYSICS ENGLISHCHAPTER - KINETIC THEORY OF GASES AND FIRST LAW OF THERMODYNAMICSEXERCISE - Subjective22videos
KINETIC THEORY OF GASES AND FIRST LAW OF THERMODYNAMICS
- BOOK - CENGAGE PHYSICS ENGLISHCHAPTER - KINETIC THEORY OF GASESEXERCISE - Compression2videos
KINETIC THEORY OF GASES
- BOOK - CENGAGE PHYSICS ENGLISHCHAPTER - LINEAR AND ANGULAR SIMPLE HARMONIC MOTIONEXERCISE - Single correct anwer type14videos
LINEAR AND ANGULAR SIMPLE HARMONIC MOTION
Similar Questions
Knowledge Check
- Question 1 - Select One
An ideal gas undergoes cyclic process ABCDA as shown in given p−V diagram. The amount of work done by the gas is
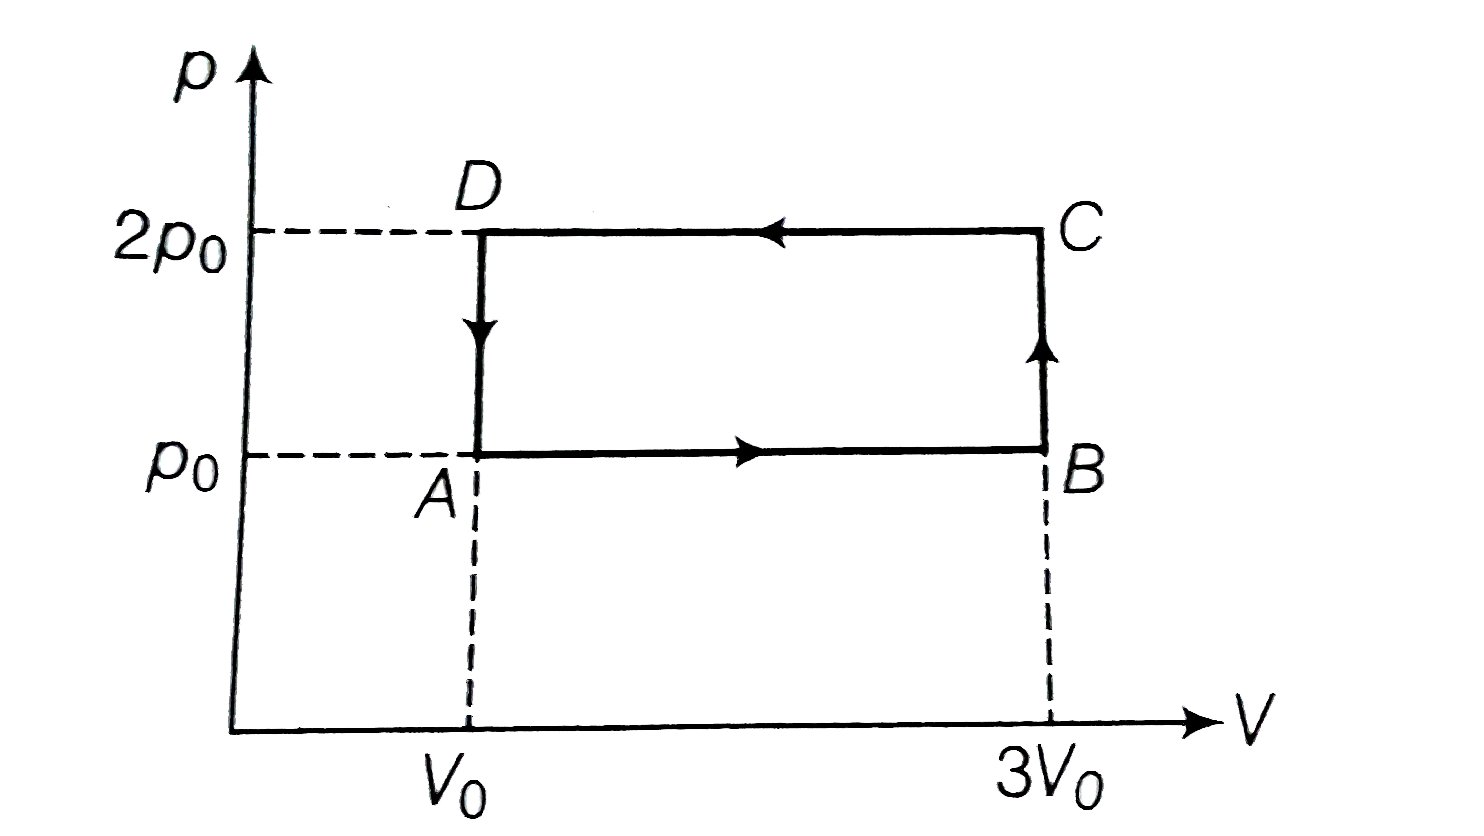 A6P0V0B−2P0V0C+2P0V0D+4P0V0
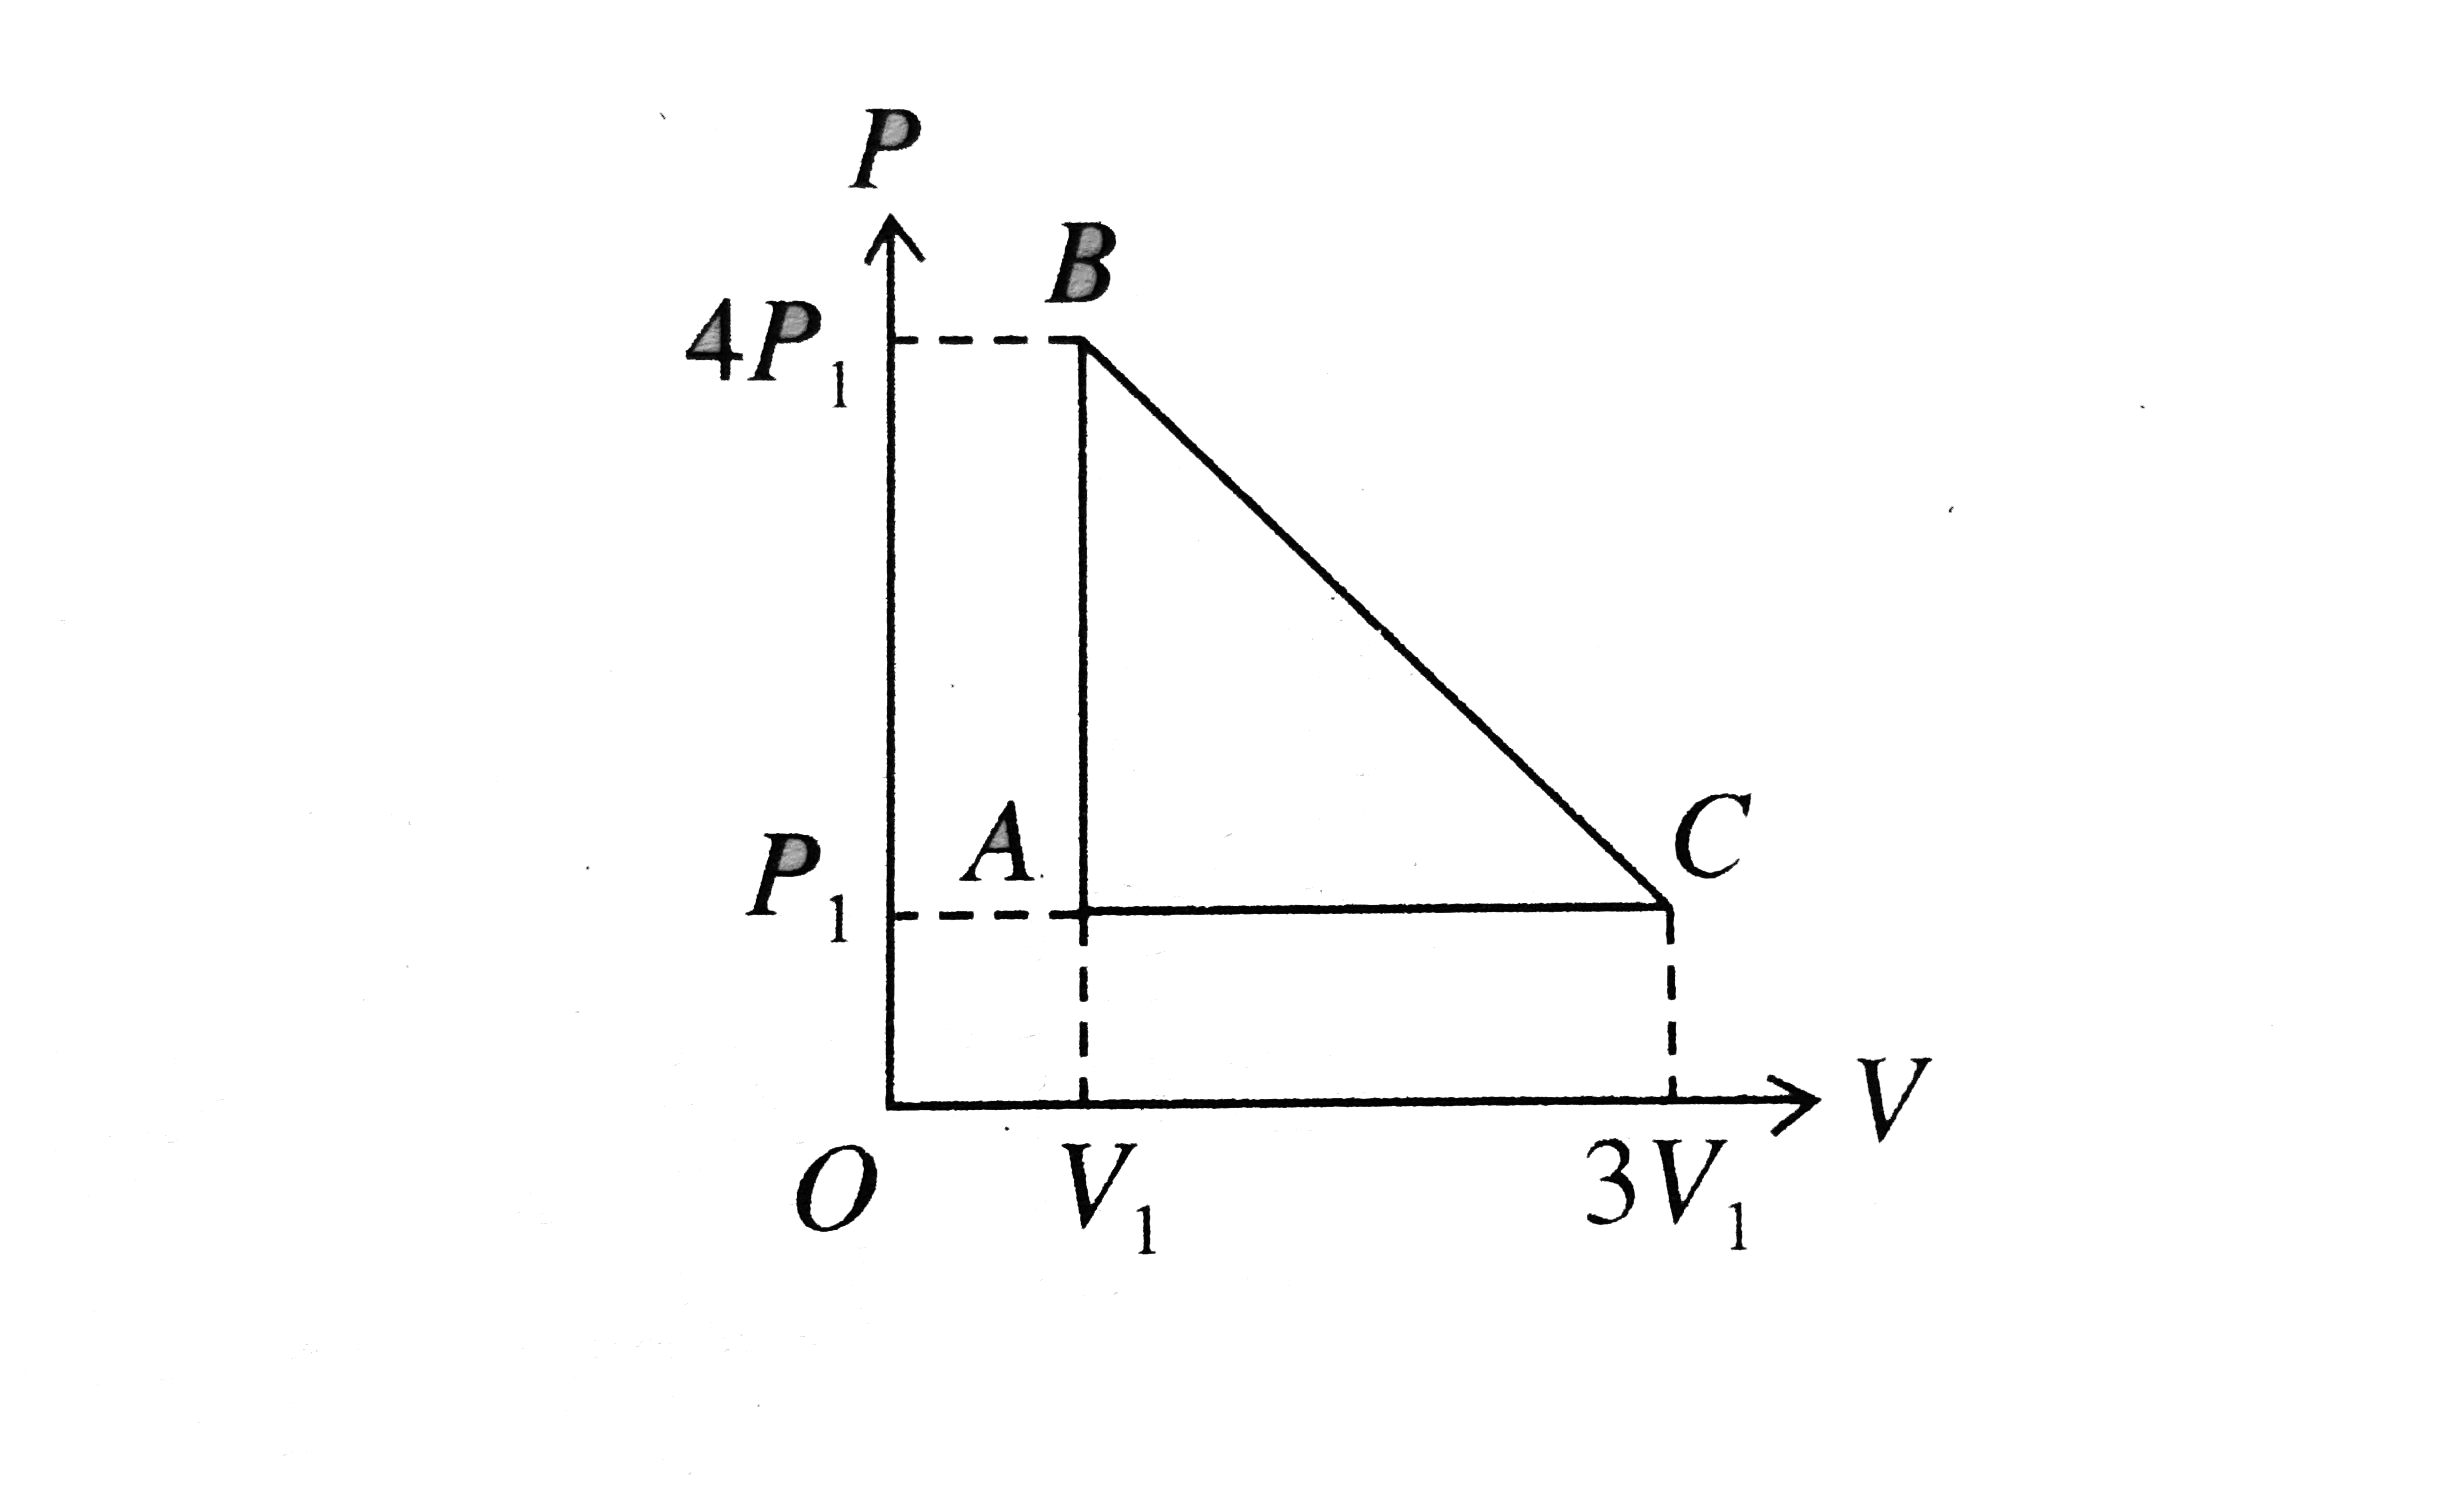
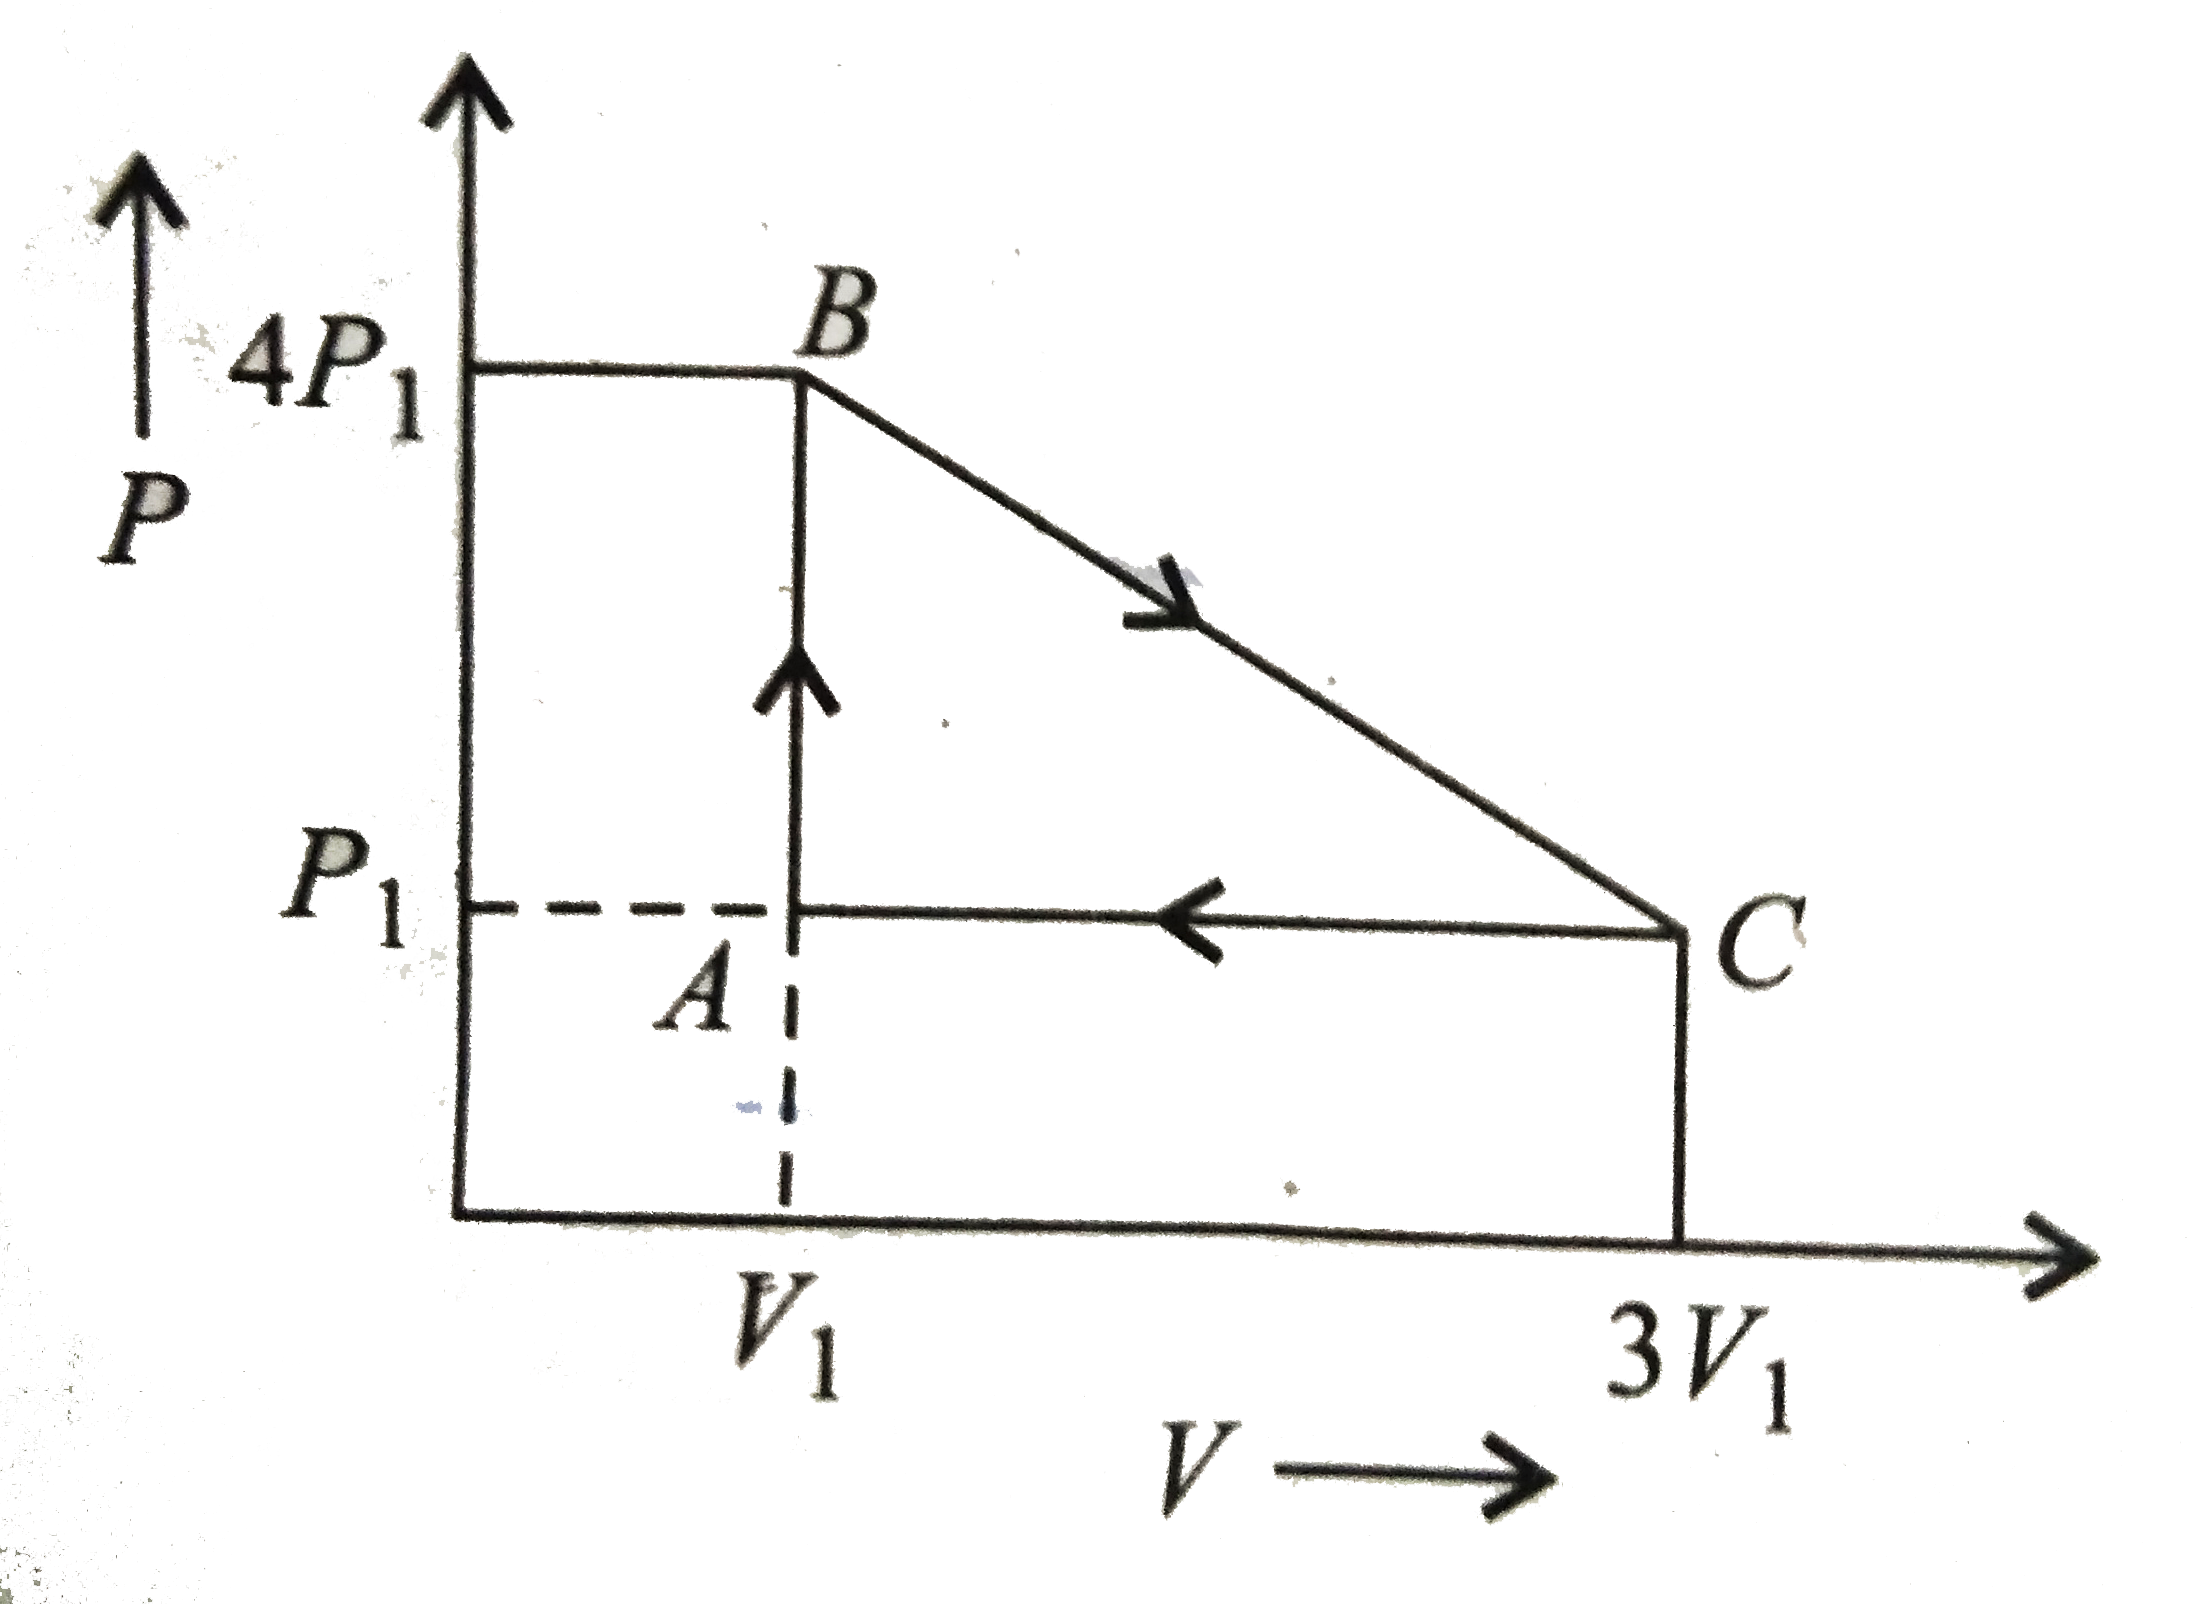
An ideal gas is taken around the cycle ABCA shown in P−V diagram. The net work done by the gas during the cycle is equal to
 View Solution
An ideal gas is taken around the cycle ABCA as shown in P-V diagram. The net work done by the gas during the cycle is equal to :
 View Solution
An ideal gas is taken around the cycle ABCA shown in P−V diagram. The net work done by the gas during the cycle is equal to
 View Solution
An ideal gas is taken around the cycle ABCA as shown in P-V diagram. The net work done by the gas during the cycle is equal to :
 View Solution
Two moles of helium gas are taken over the cycle ABCDA, as shown in the P-T diagram
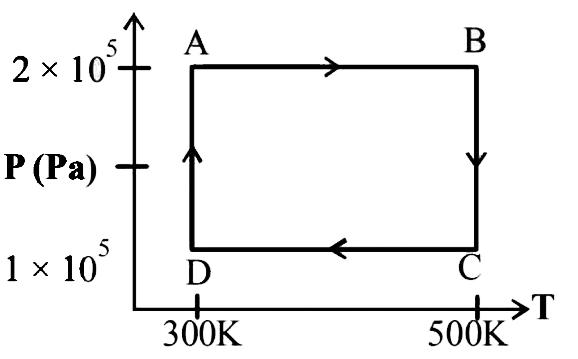
The net work done on the gas in the cycle ABCDA is :View SolutionAn ideal gas is taken around the cycle ABCD shown in the PV diagram below. The net work done by the gas during the cycle is equal to
 View Solution
Two moles of helium gas are taken over the cycle ABCDA, as shown in the P-T diagram

The net work done on the gas in the cycle ABCDA is :View Solution


