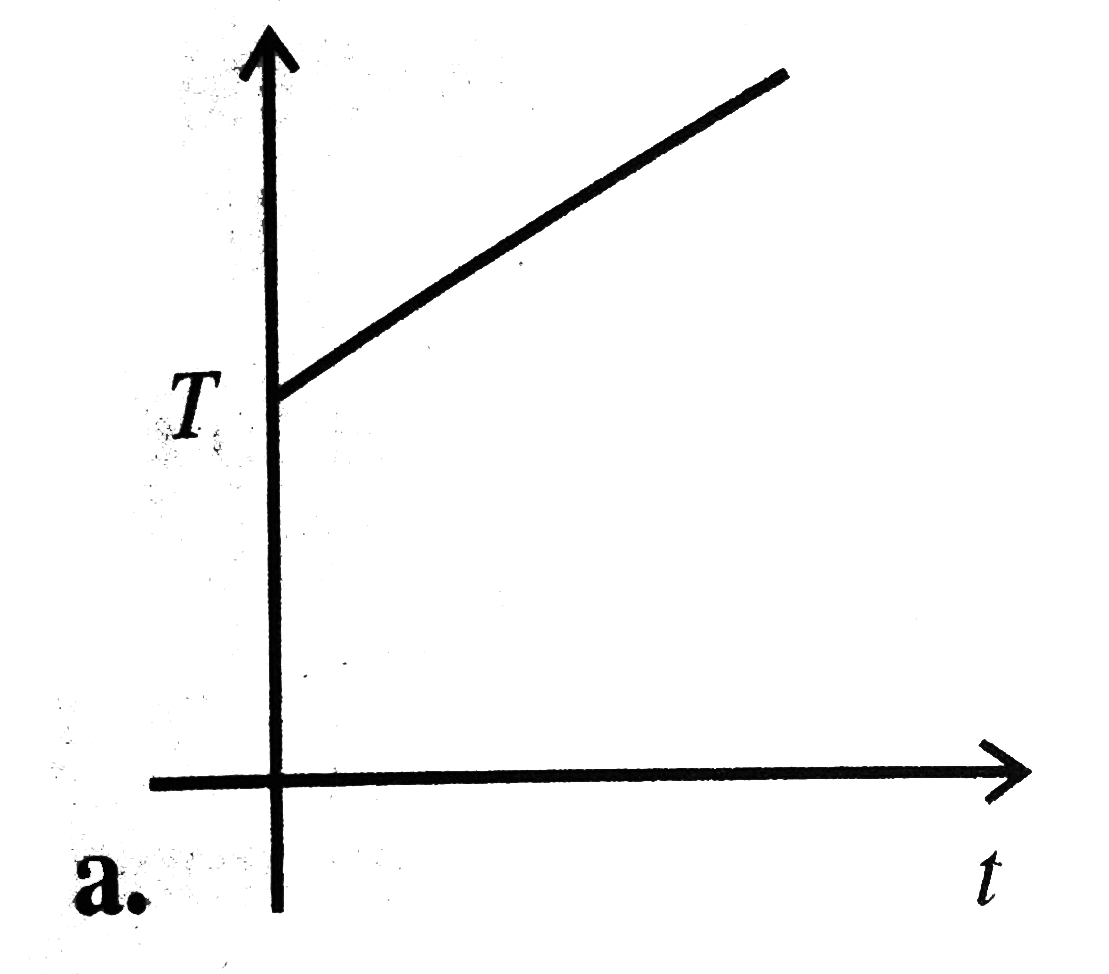
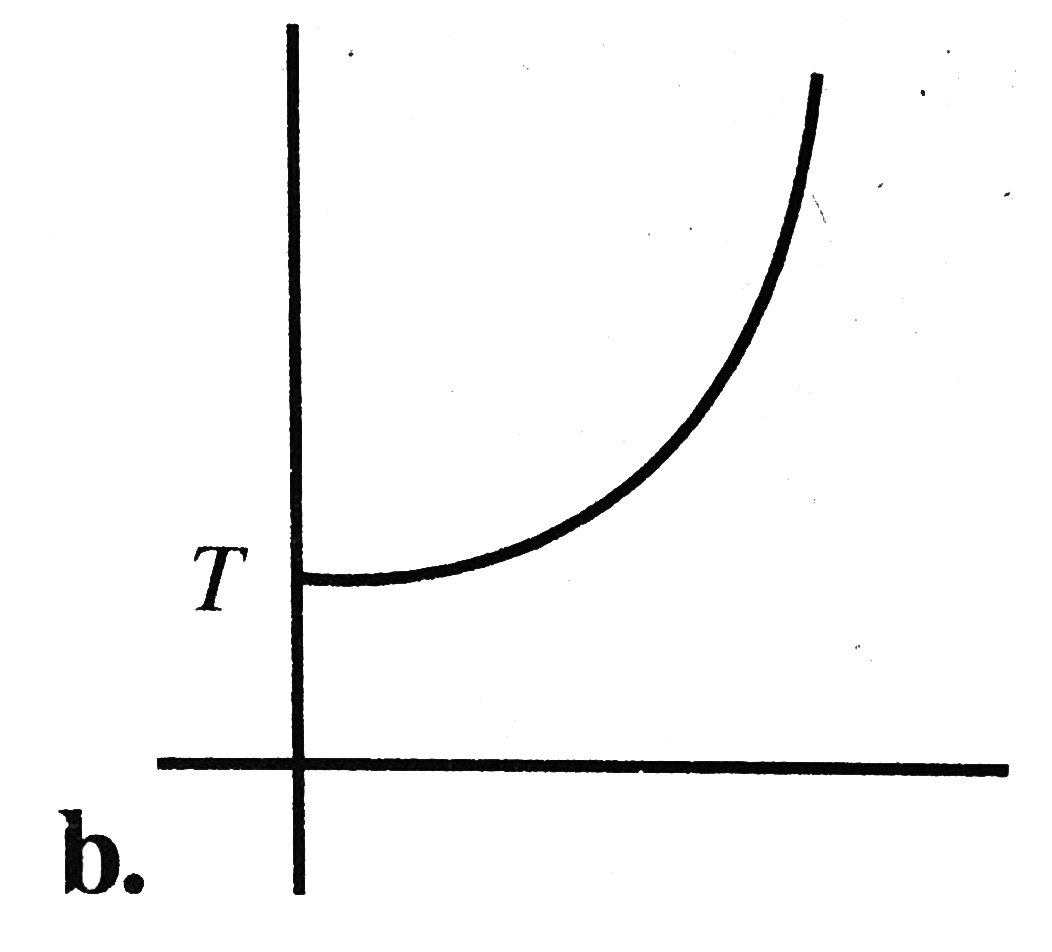
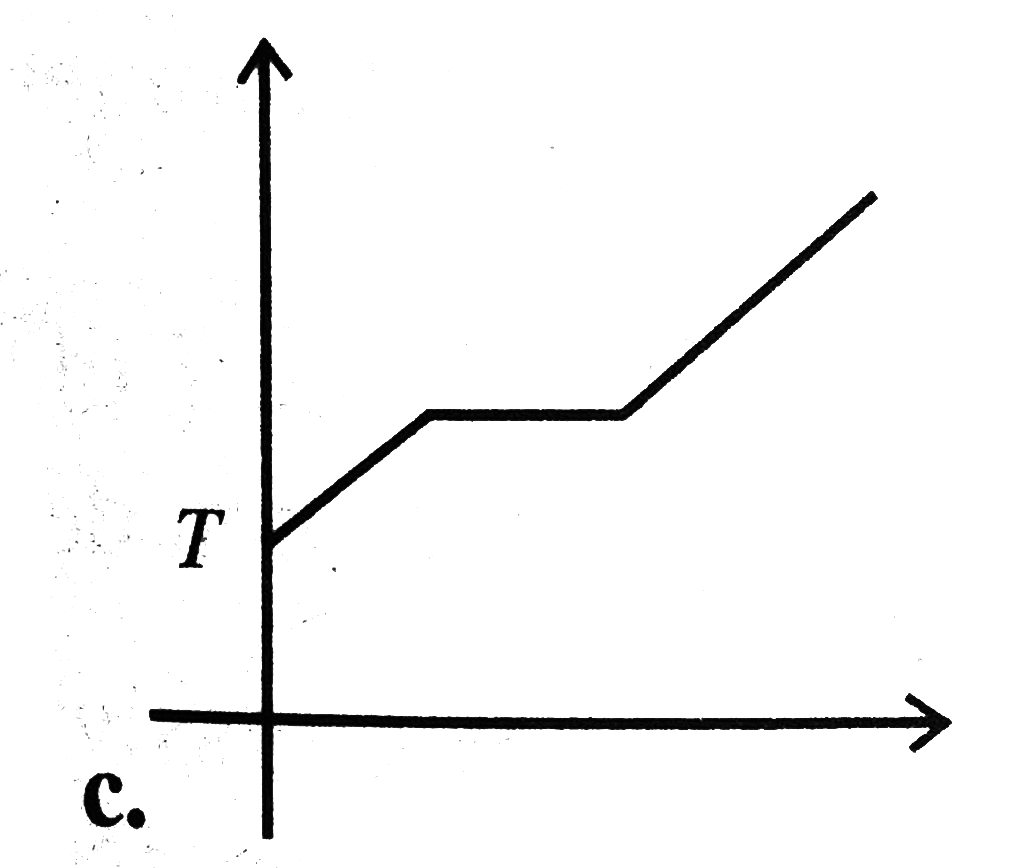
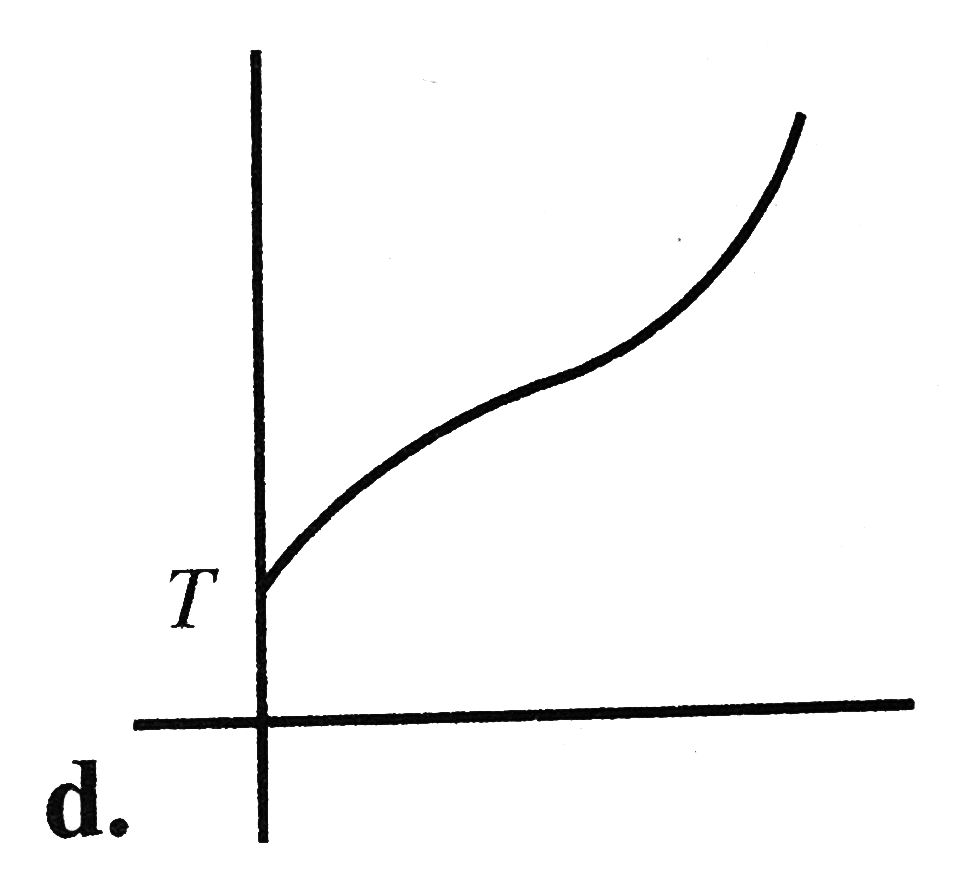
Liquefied oxygen at 1 atmosphere is heated from 50 K to 300 K by supplying heat at a constant rate. The graph that correctly shows the relationship between temperature and time is :


The correct Answer is:C
Temperature of liquid oxygen will first increase till boiling point.
Then phase change will take place from liquid to gas during which temperature remain same. After this temperature of gaseous oxygen will further increase. All this is correctly shown by graph (c)
Topper's Solved these Questions
- ARCHIVES 1 VOLUME 6BOOK - CENGAGE PHYSICS ENGLISHCHAPTER - ARCHIVES 1 VOLUME 6EXERCISE - Multi Correct
13 Videos
- ARCHIVES 1 VOLUME 6BOOK - CENGAGE PHYSICS ENGLISHCHAPTER - ARCHIVES 1 VOLUME 6EXERCISE - Assertion-Reasoning
1 Videos
- ARCHIVES 1 VOLUME 6BOOK - CENGAGE PHYSICS ENGLISHCHAPTER - ARCHIVES 1 VOLUME 6EXERCISE - True/False
7 Videos
- ARCHIVES 2 VOLUME 6BOOK - CENGAGE PHYSICS ENGLISHCHAPTER - ARCHIVES 2 VOLUME 6EXERCISE - Integer
4 Videos
Similar Questions
If liquefied oxygen at 1 atmospheric pressure is heated from 50K to 300k by supplying heat at constant rate. The graph of temperature vs time will be
View SolutionLiquid oxygen at 50K is heated to 300K at constant pressure of 1atm. The rate of heating is constant. Which of the following graphs represents the variation of temperature with time?
View SolutionIn a closed vessel, a gas is heated from 300 K to 600 K the kinetic energy becomes/remain
View SolutionIn the above problem if heat is supplied at a constant rate of q=10cal/min, then plot temperature versus time graph.
View SolutionWhen 1.5 mol of a gas is heated at constant volume from 300 K to 350 K and the heat supplied to the gas is 750 J then the correct option is
View SolutionOne mole of an ideal monoatomic gas requires 207 J heat to raise the temperature by 10 K when heated at constant pressure. If the same gas is heated at constant volume to raise the temperature by the same 10 K, the heat required is [Given the gas constant R = 8.3 J/ mol. K]
View SolutionThe rate of a certain reaction increases by 2.3 times when the temperature is raised form 300K to 310K. If k is the rate constant at 300K, then the rate constant at 310K will be equal to
View SolutionOn icreasing temperature from 200K to 220K rate of reaction A increases by 3 times and rate of reaction B increases by 9 times then correct relationship between activation energy of A and B is
View Solution50 cal of heat is required to raise the temperature of 1 mole of an ideal gas from 20∘C to 25∘C, while the pressure of the gas is kept constant. The amount of heat required to raise the temperature of the same has through same temperature range at constant volume is ( R = 2 cal/mol/K)
View Solution4 mole of helium gas at temperatures of 300 K is taken in a cylinder. (i) What is the heat required to increase its temperature to 600 K, if it is heated at constant volume (ii) what is the heat required to raise the temperature of the gas at constant pressure to 600 K ? (iii) What is the work done by the gas during the process ? Given Cv=12.5J/molK,Cp=20.8J/mol K.
View Solution
