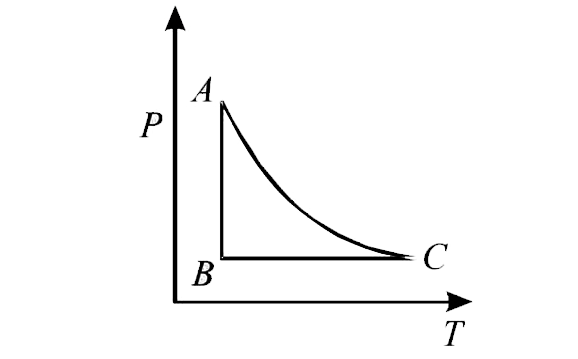
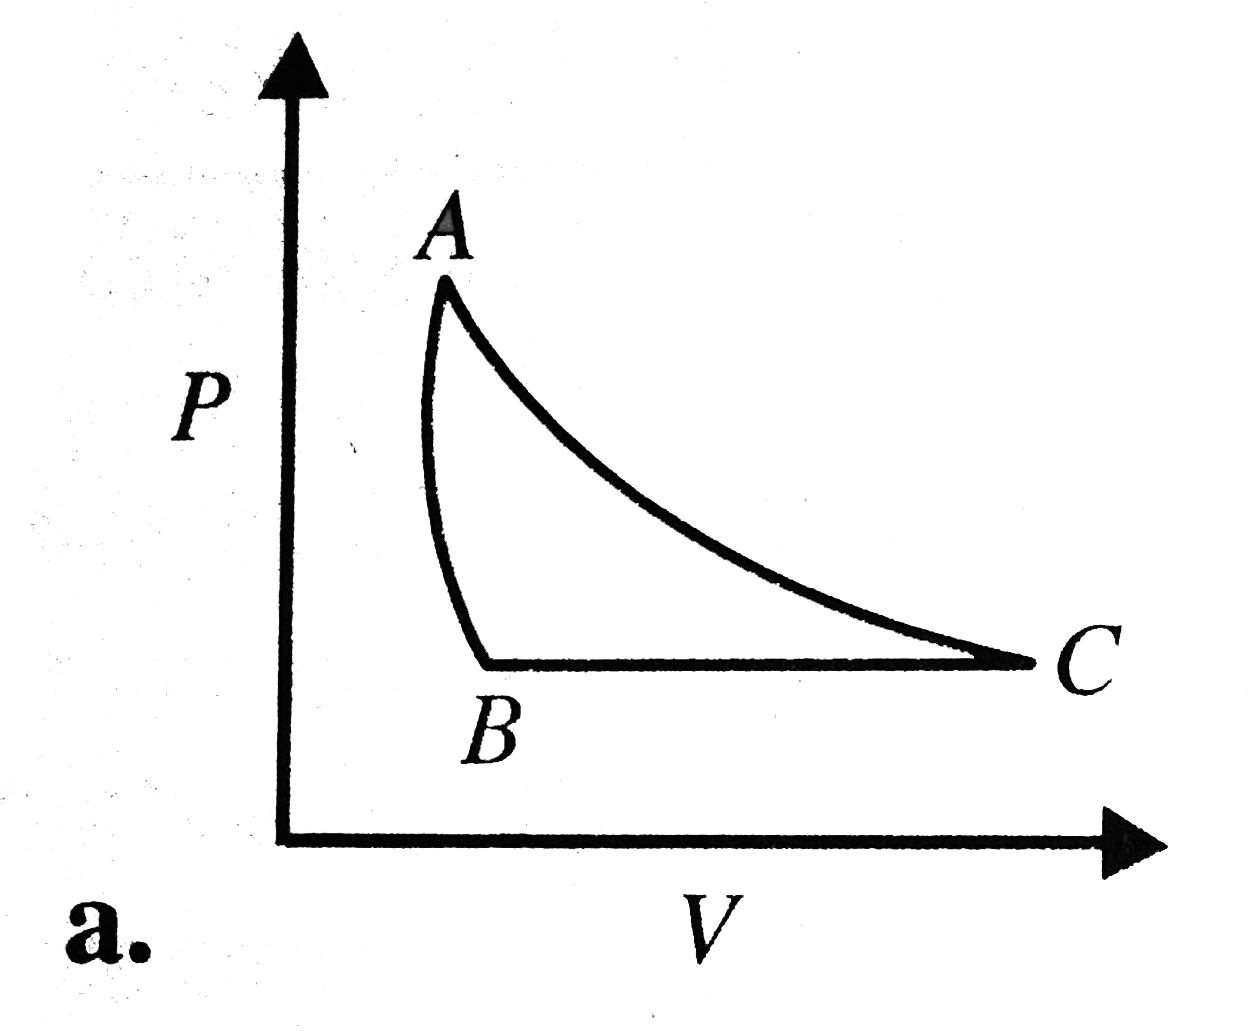
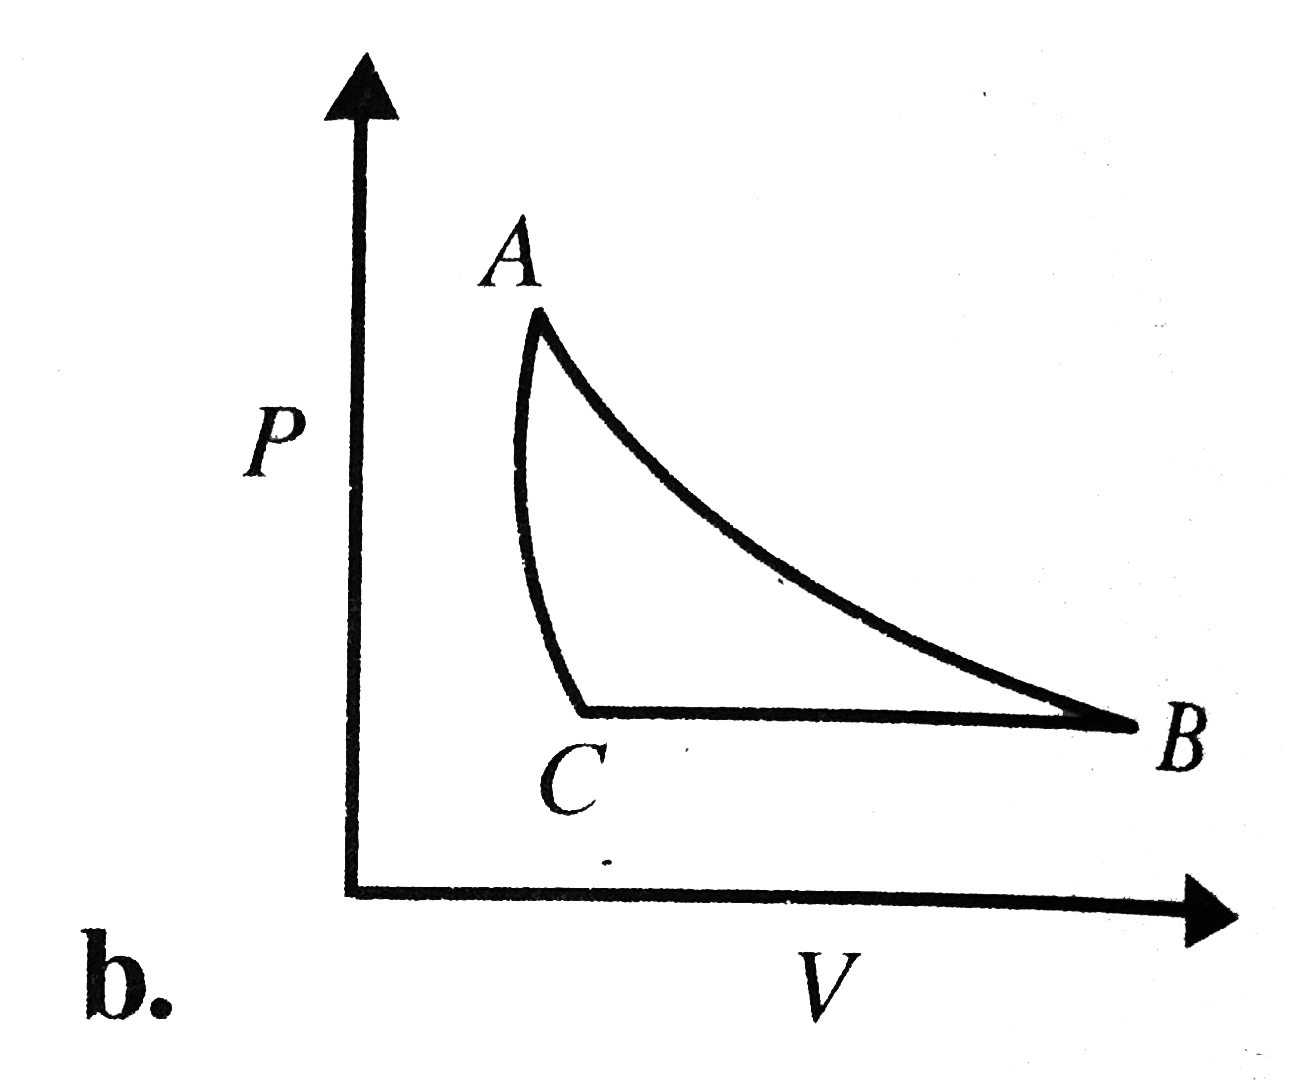
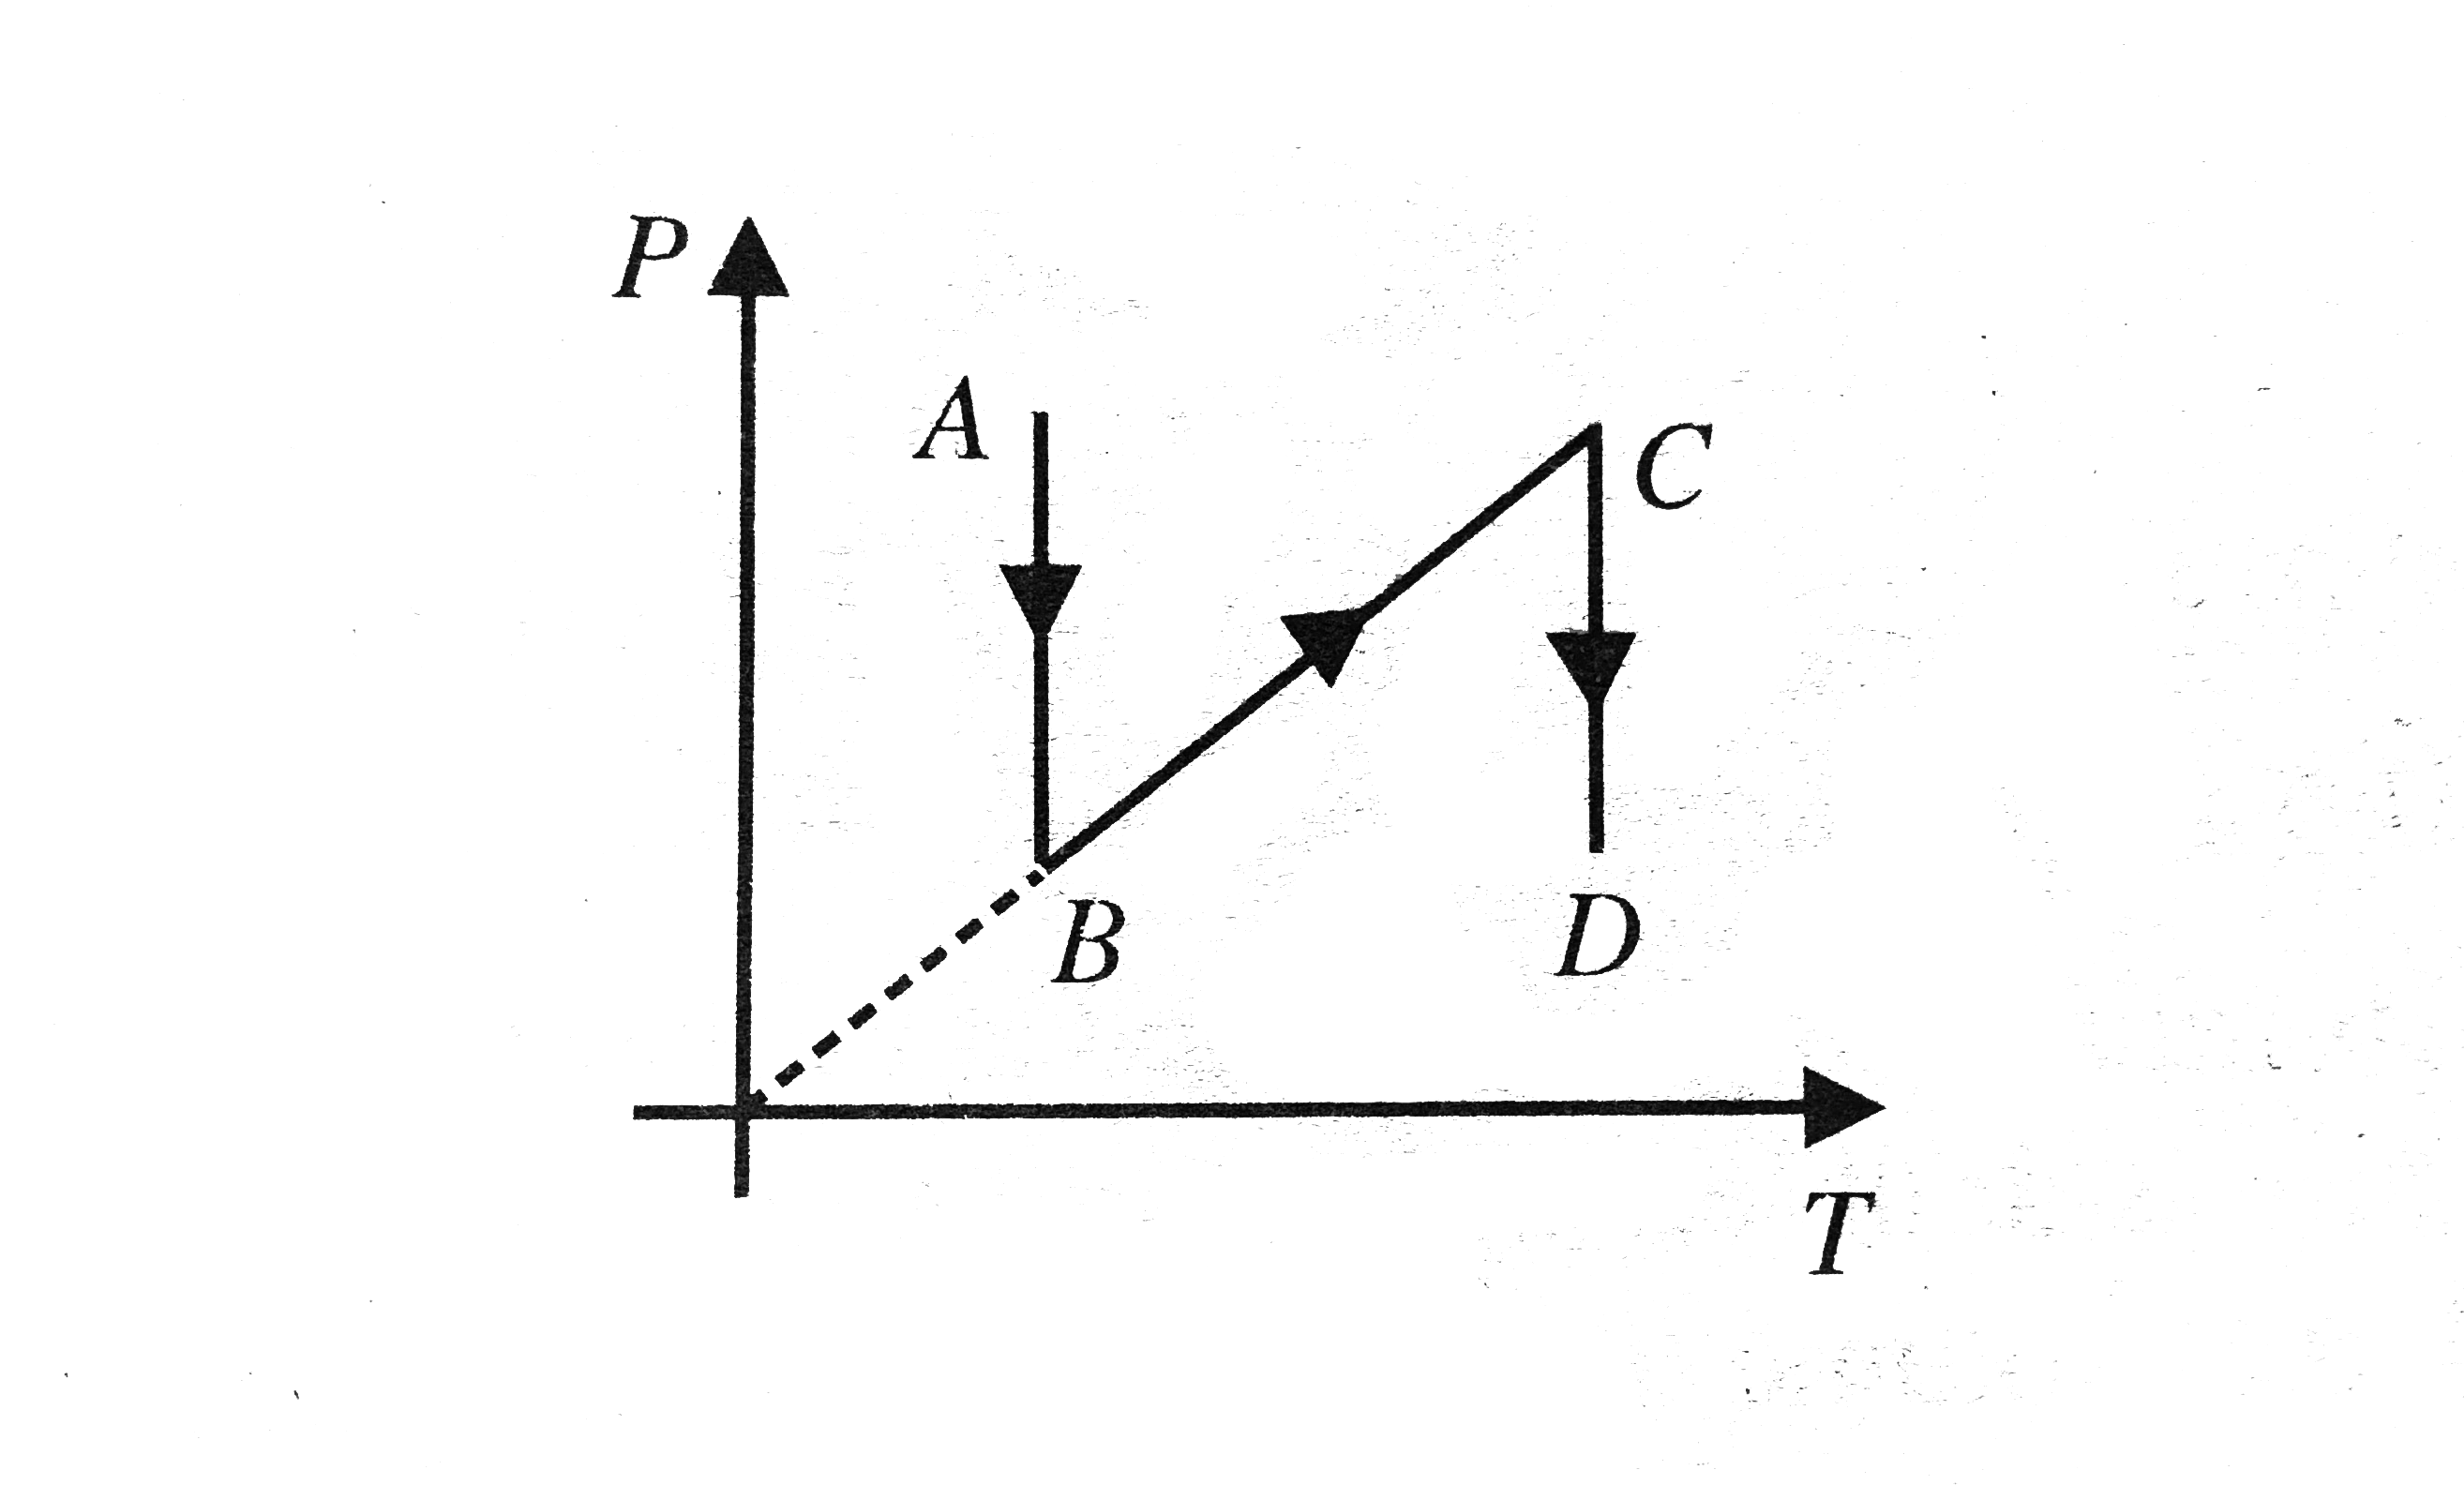
The PT diagram for an ideal gas is shown in the figure, where AC is an adiabatic process, find the corresponding PV diagram.
A
B
C
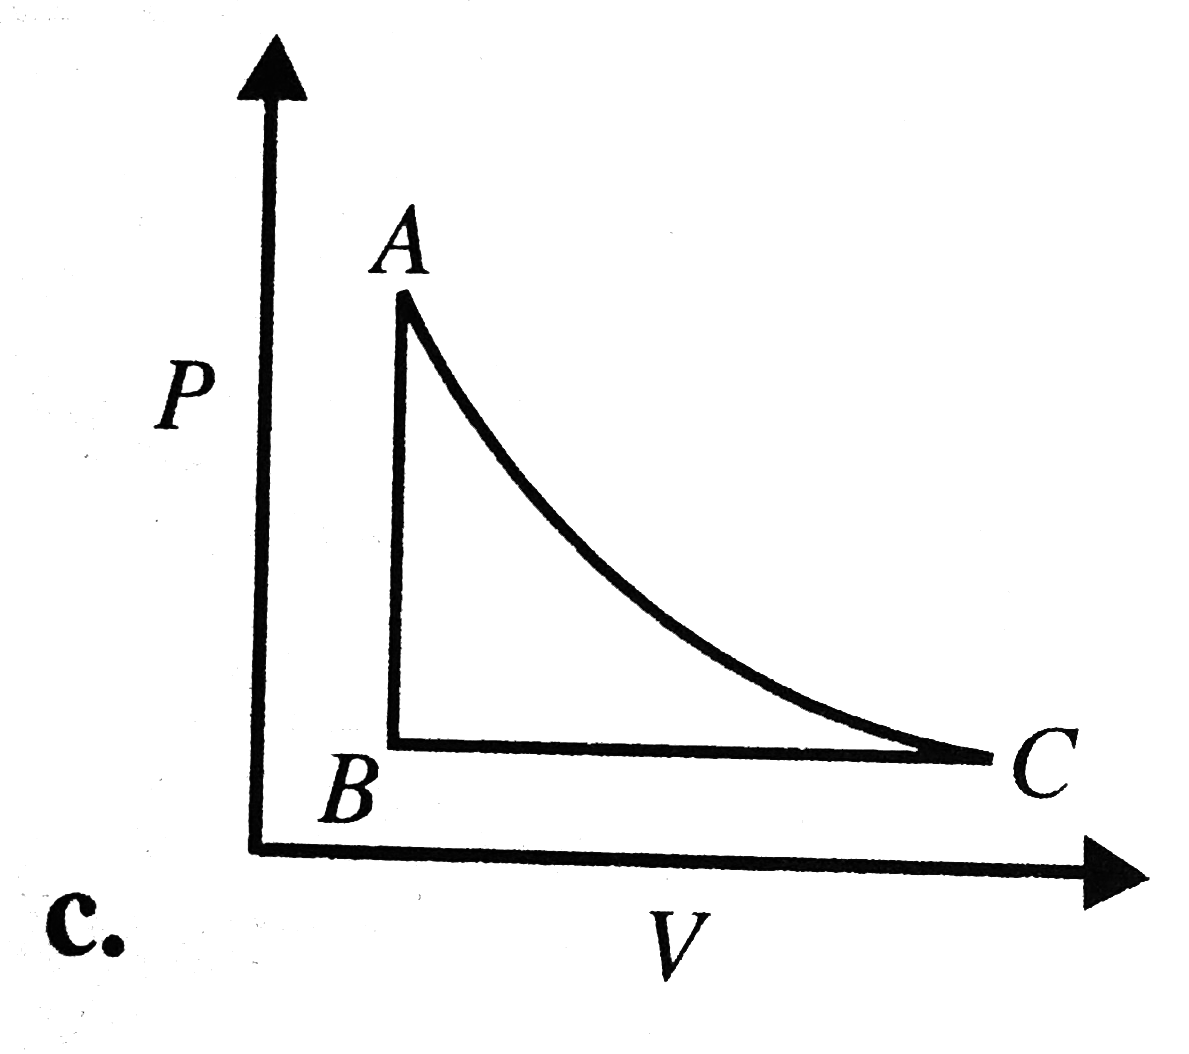
D
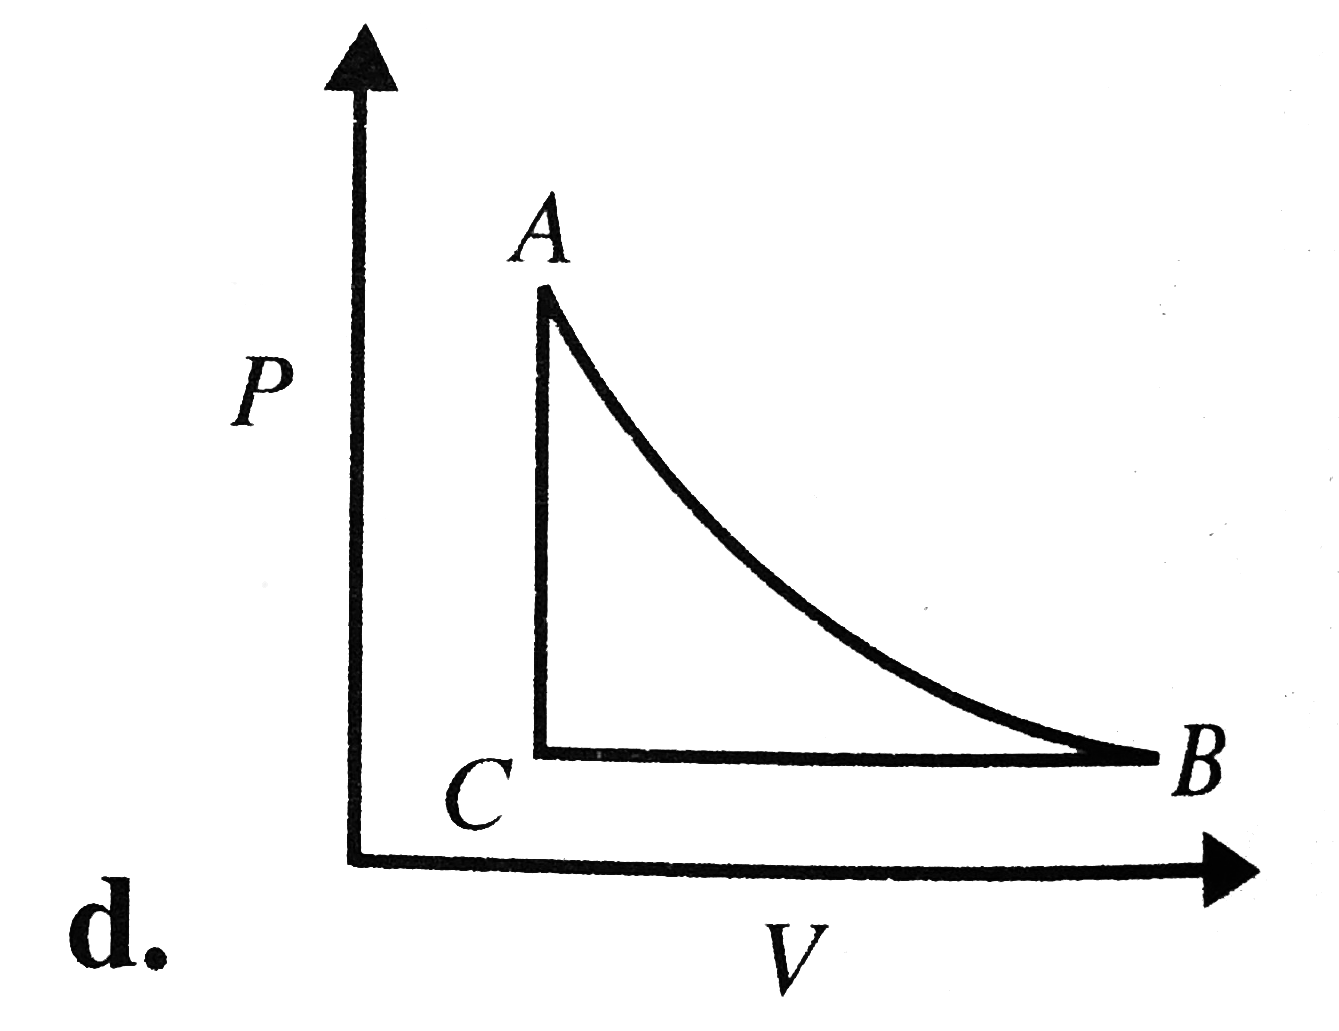
Video Solution
Text Solution
None. Process AC cannot be adiabatic, because in adiabatic expansion, temperature decreases.
|
Topper's Solved these Questions
- ARCHIVES 1 VOLUME 6BOOK - CENGAGE PHYSICS ENGLISHCHAPTER - ARCHIVES 1 VOLUME 6EXERCISE - Multi Correct
13 Videos
- ARCHIVES 1 VOLUME 6BOOK - CENGAGE PHYSICS ENGLISHCHAPTER - ARCHIVES 1 VOLUME 6EXERCISE - Assertion-Reasoning
1 Video
- ARCHIVES 1 VOLUME 6BOOK - CENGAGE PHYSICS ENGLISHCHAPTER - ARCHIVES 1 VOLUME 6EXERCISE - True/False
7 Videos
- ARCHIVES 2 VOLUME 6BOOK - CENGAGE PHYSICS ENGLISHCHAPTER - ARCHIVES 2 VOLUME 6EXERCISE - Integer
4 Videos
Similar Questions
Knowledge Check
The ideal gas equation for an adiabatic process is
APVγ=constantBTVγ+1=constantCPγ−1=constantDPγ+1T=constantConsider p-V diagram for an ideal gas shown in figure.
Out of the following diagrams, which figure represents the T−p diagram ?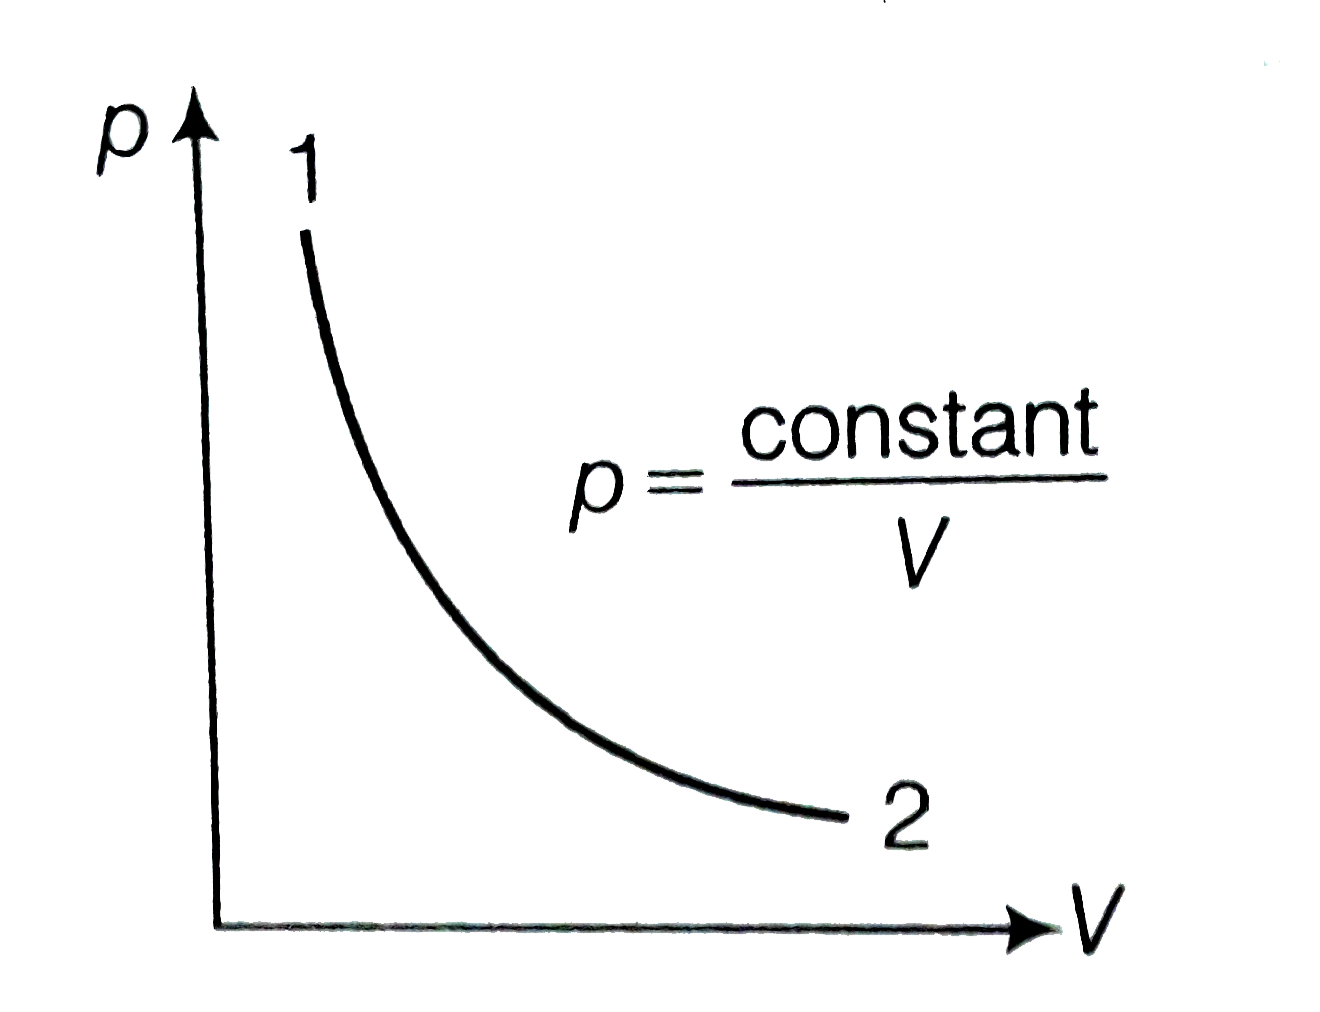
(i)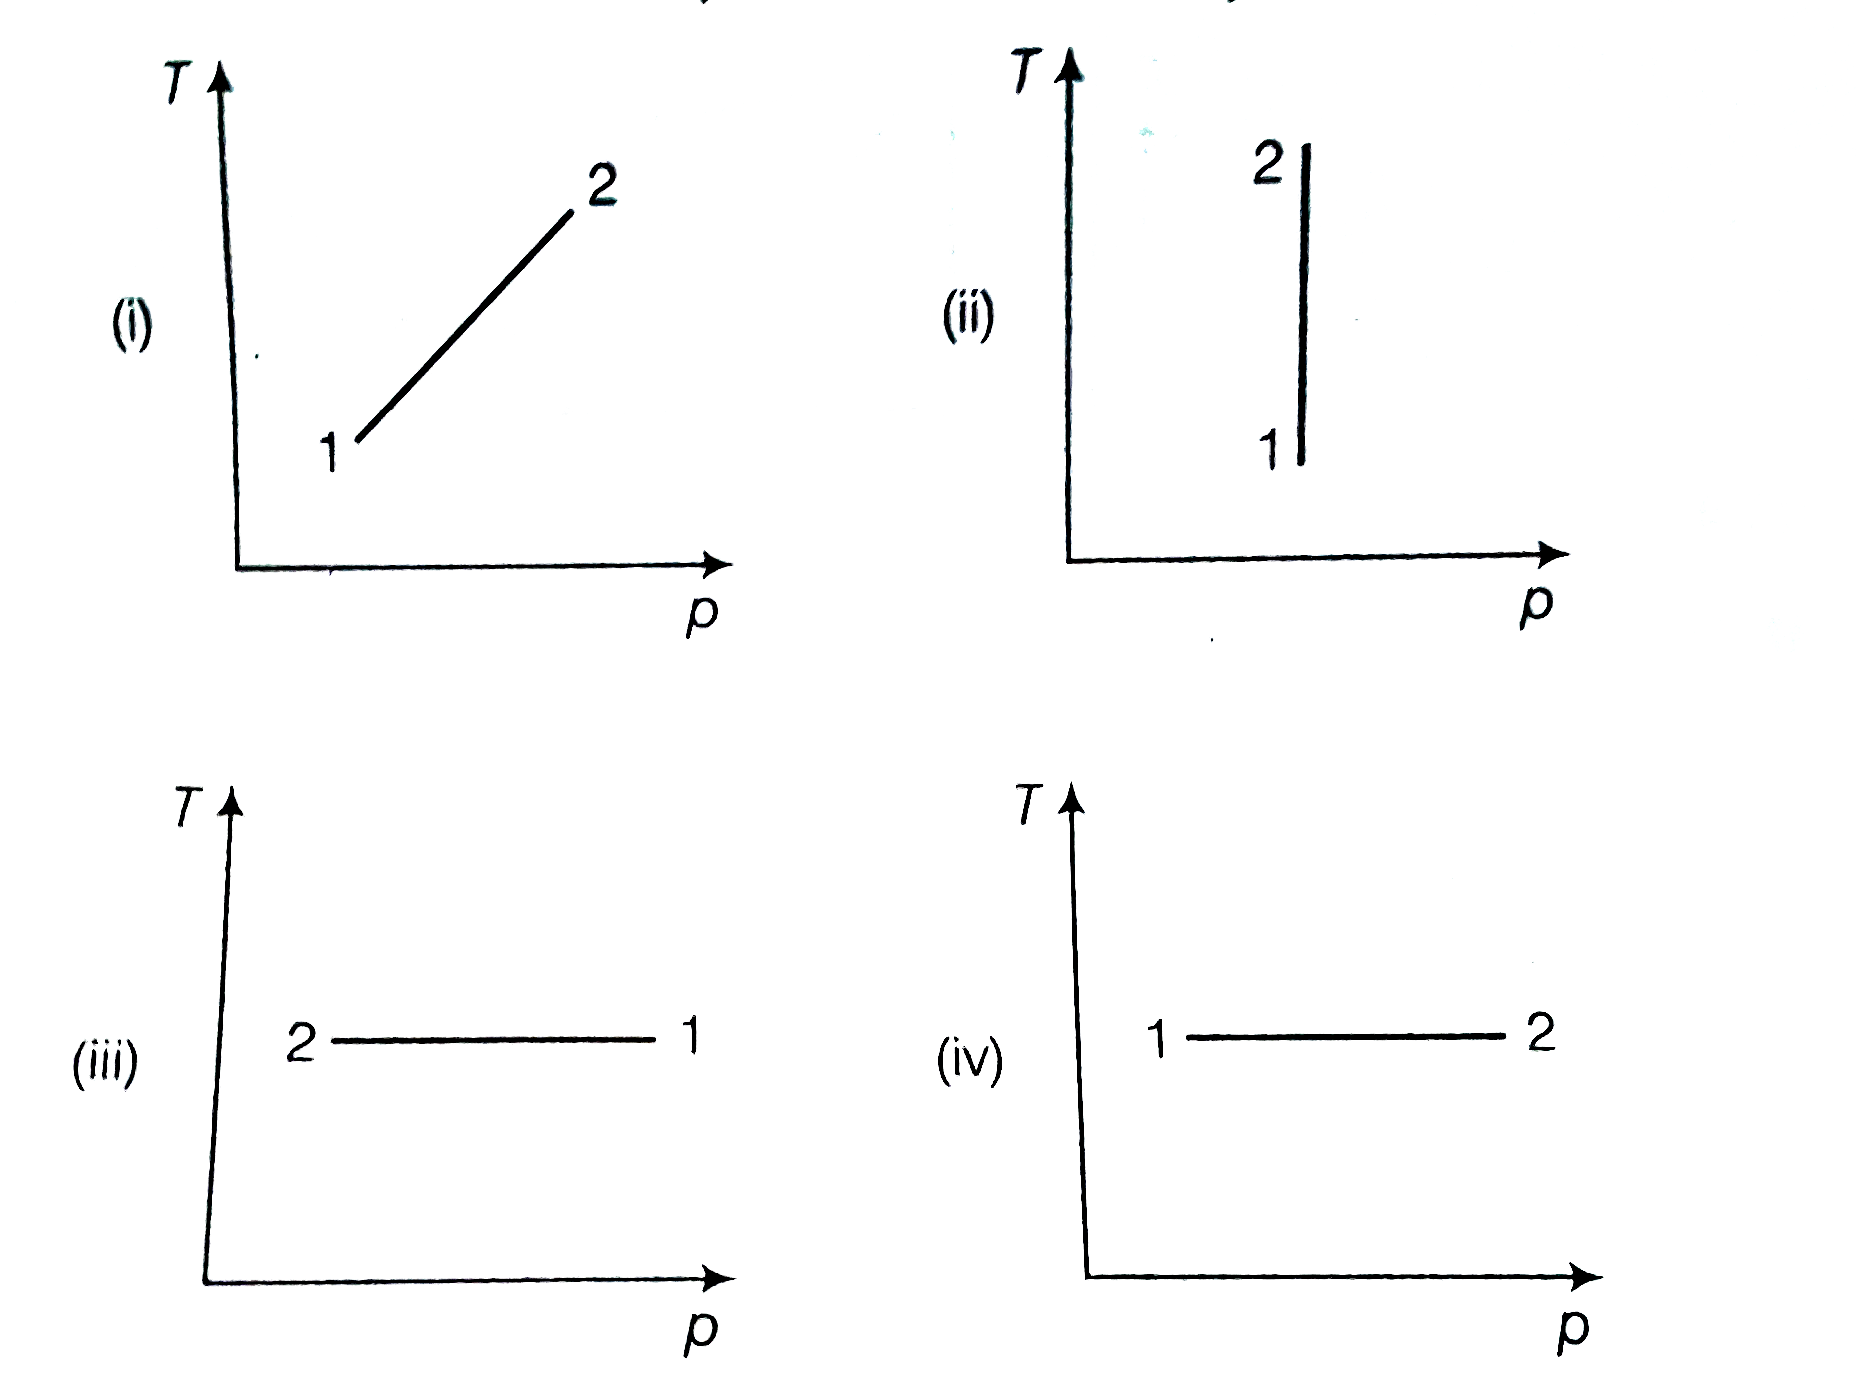 A(iv)B(ii)C(iii)D(i)
graph of an ideal gas is as shown in figure.
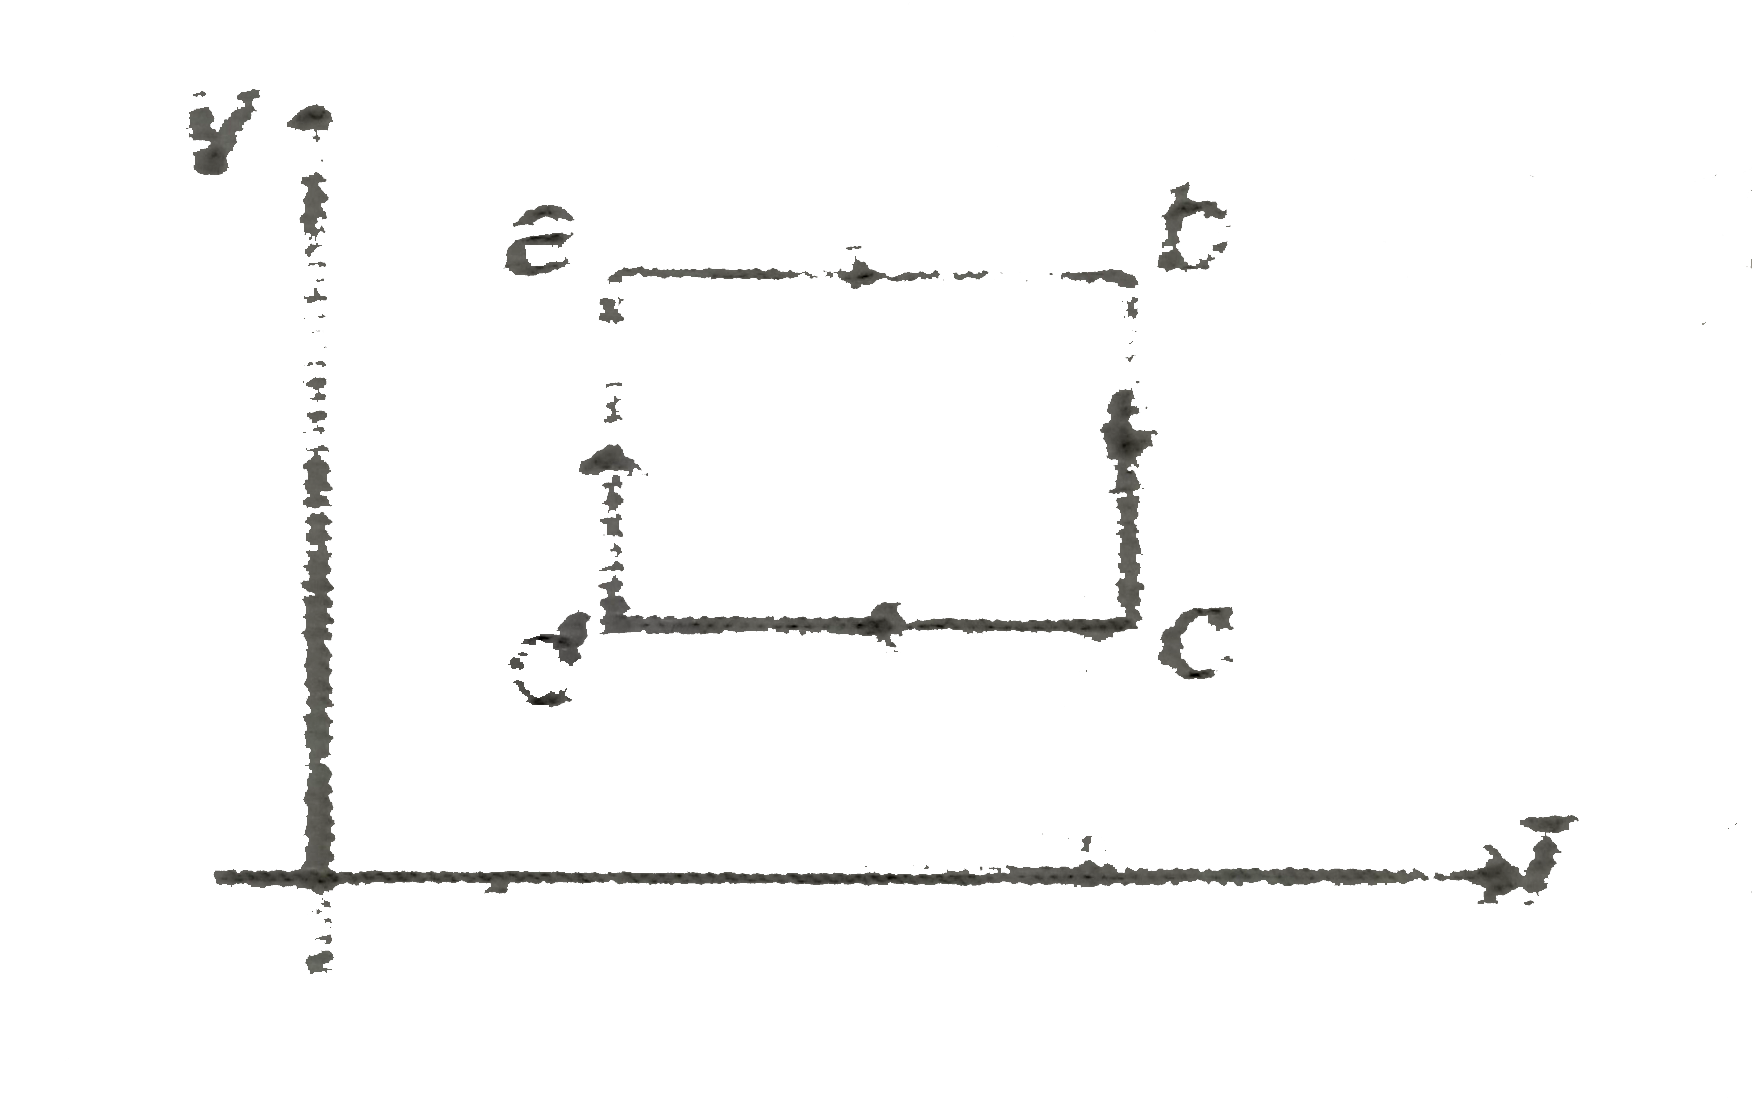
Heat is supplied to the gas in process (s).
View SolutionConsider p-V diagram for an ideal gas shown in figure.

Out of the following diagrams, which figure represents the T−p diagram ?
(i)
View SolutionFor P-V diagram of a thermodynamic cycle as shown in figure,process BC and DA are isothermal. Which of the corresponding graphs is correct?
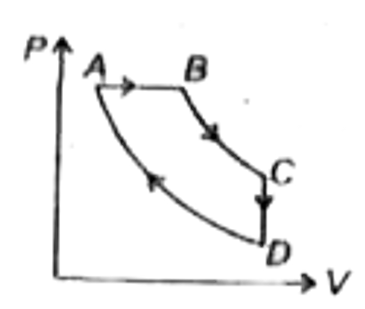
View SolutionThe graph of pressure and temperature for an ideal gas is as shown in figure. The given process is
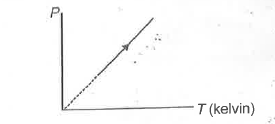
View SolutionP – V graph of an ideal gas is as shown in the diagram . Work done by the gas in the process ABCD is
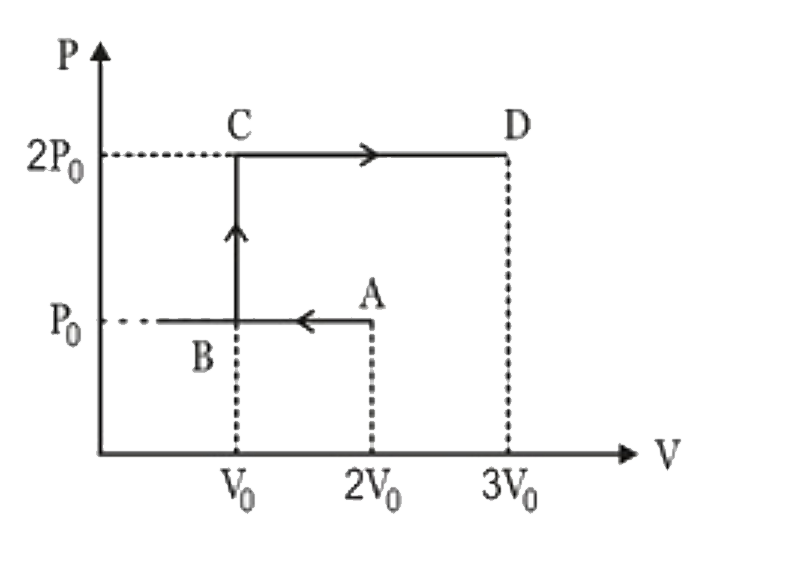
View SolutionP−T diagram is shown in Fig. Choose the corresponding V−T diagram.
View Solution

