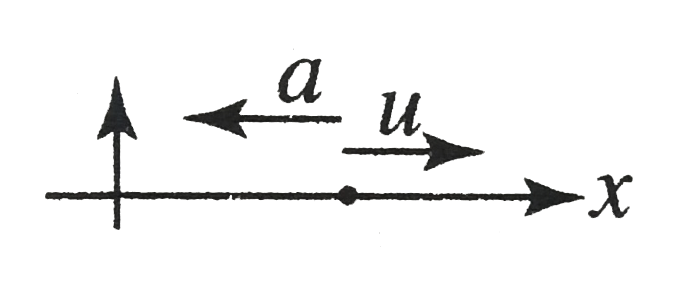
A particle is moving along x-direction with a constant acceleration a. The particle starts from x=x0 position with initial velocity u. We can define the position of the particle with time by the relation
x=x0+ut+12at2
plot the position of the particle in relation with time is following situations
(i) If initial position of the particle is on negativ x-axis, initial velocity is positive and acceleration is negative.
(ii) If initial position is positive, initial velocity is negative and acceleration is positive.
To solve the problem, we will analyze the two situations described and plot the position of the particle as a function of time using the given equation:
x=x0+ut+12at2
Situation (i):
- Initial position: x0<0 (negative x-axis)
- Initial velocity: u>0 (positive)
- Acceleration: a<0 (negative)
1. Understanding the equation: The equation is quadratic in time t. The term 12at2 will dominate the behavior of the particle's position as time increases, especially since a is negative.
2. Behavior at t=0: When t=0, the position x=x0, which is negative. Thus, the starting point on the graph is below the origin.
3. Behavior as t increases:
- The positive initial velocity u will initially cause the position to increase.
- However, the negative acceleration a will eventually slow down the particle and cause it to decrease in position after reaching a maximum point.
4. Shape of the graph: Since the coefficient of t2 (which is 12a) is negative, the parabola opens downwards.
Plot for Situation (i):
- The graph starts from a negative value at t=0, rises due to the positive initial velocity, reaches a peak, and then falls back down due to negative acceleration.
Situation (ii):
- Initial position: x0>0 (positive)
- Initial velocity: u<0 (negative)
- Acceleration: a>0 (positive)
1. Understanding the equation: Again, the equation is quadratic in time t. The positive acceleration will influence the position positively over time.
2. Behavior at t=0: When t=0, the position x=x0, which is positive. Thus, the starting point on the graph is above the origin.
3. Behavior as t increases:
- The negative initial velocity u will initially cause the position to decrease.
- However, the positive acceleration a will eventually overcome the negative velocity, causing the position to increase over time.
4. Shape of the graph: Since the coefficient of t2 (which is 12a) is positive, the parabola opens upwards.
Plot for Situation (ii):
- The graph starts from a positive value at t=0, decreases due to the negative initial velocity, reaches a minimum point, and then rises due to positive acceleration.
Summary of Plots:
1. Situation (i): A downward-opening parabola starting from a negative position, rising initially, then falling back down.
2. Situation (ii): An upward-opening parabola starting from a positive position, decreasing initially, then rising.
- Initial position: x0<0 (negative x-axis)
- Initial velocity: u>0 (positive)
- Acceleration: a<0 (negative)
- The positive initial velocity u will initially cause the position to increase.
- However, the negative acceleration a will eventually slow down the particle and cause it to decrease in position after reaching a maximum point.
- The graph starts from a negative value at t=0, rises due to the positive initial velocity, reaches a peak, and then falls back down due to negative acceleration.
- Initial position: x0>0 (positive)
- Initial velocity: u<0 (negative)
- Acceleration: a>0 (positive)
- The negative initial velocity u will initially cause the position to decrease.
- However, the positive acceleration a will eventually overcome the negative velocity, causing the position to increase over time.
- The graph starts from a positive value at t=0, decreases due to the negative initial velocity, reaches a minimum point, and then rises due to positive acceleration.
1. Situation (i): A downward-opening parabola starting from a negative position, rising initially, then falling back down.
2. Situation (ii): An upward-opening parabola starting from a positive position, decreasing initially, then rising.
Similar Questions
A particle of mass m is moving along the line y-b with constant acceleration a. The areal velocity of the position vector of the particle at time t is (u=0)
View SolutionIf a particle starts moving with initial velocity u=1ms−1 and acceleration a=2ms−2, the veloctiy of the particle at any time is given by v=u+at=1+2t. Plot the velocity-time graph of the particle.
View SolutionThe position x of a particle varies with time t as x=at2−bt3.The acceleration of the particle will be zero at time t equal to
View SolutionThe velocity time relation of a particle is given by v =(3t2−2t−1)m/s Calculate the position and acceleration of the particle when velocity of the particle is zero . Given the initial position of the particle is 5m .
View Solution

For a particle moving along straight line with constant acceleration (a), we define velocity of the particle with time as
v=u+at, (u=initial velocity)
Draw the velocity-time graph of the particle in following situations.
(i) Velocity is decresing with time (i.e., acceleration in negative)
(ii) Initial velocity is negative but acceleration is positive
View SolutionA particle is moving with constant speed v along x - axis in positive direction. Find the angular velocity of the particle about the point (0, b), when position of the particle is (a, 0).
View SolutionA particle is moving along the x-axis with an acceleration a = 2x where a is in ms–2andx is in metre. If the particle starts from rest at x=1 m, find its velocity when it reaches the position x = 3.
View SolutionThe position x of a particle varies with time t as x=at2−bt3. The acceleration at time t of the particle will be equal to zero, where (t) is equal to .
View SolutionThe position x of a particle varies with time t as x=at2−bt3. The acceleration at time t of the particle will be equal to zero, where (t) is equal to .
View SolutionFigure shows the position of a particle moving on the X-axis as a function of time.

View Solution
