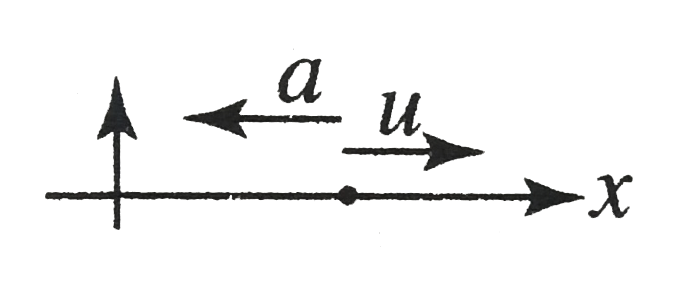
If a particle starts moving with initial velocity and acceleration , the veloctiy of the particle at any time is given by . Plot the velocity-time graph of the particle.
To solve the problem of plotting the velocity-time graph for a particle with an initial velocity u=1m/s and acceleration a=2m/s2, we can follow these steps:
Step 1: Write the equation for velocity
The velocity v of the particle at any time t can be expressed using the formula:
v=u+at
Substituting the given values:
v=1+2t
Step 2: Identify the parameters for the graph
In the equation v=1+2t:
- The initial velocity u=1m/s corresponds to the y-intercept of the graph.
- The acceleration a=2m/s2 represents the slope of the line.
Step 3: Determine points for the graph
To plot the graph, we can calculate the velocity at different time intervals. Let's choose a few values for t:
- For t=0:
v=1+2(0)=1m/s
- For t=1:
v=1+2(1)=3m/s
- For t=2:
v=1+2(2)=5m/s
- For t=3:
v=1+2(3)=7m/s
This gives us the following points to plot:
- (0,1)
- (1,3)
- (2,5)
- (3,7)
Step 4: Plot the points on the graph
1. Draw the axes: Time t on the x-axis and Velocity v on the y-axis.
2. Mark the points calculated above on the graph.
3. Connect the points with a straight line since the relationship is linear.
Step 5: Label the graph
- Label the y-intercept at (0,1).
- Indicate the slope of the line as 2 (rise over run).
- Title the graph as "Velocity-Time Graph".
Final Graph
The graph will be a straight line starting from the point (0,1) and increasing linearly with a slope of 2.
---
The velocity v of the particle at any time t can be expressed using the formula:
v=u+at
Substituting the given values:
v=1+2t
In the equation v=1+2t:
- The initial velocity u=1m/s corresponds to the y-intercept of the graph.
- The acceleration a=2m/s2 represents the slope of the line.
To plot the graph, we can calculate the velocity at different time intervals. Let's choose a few values for t:
v=1+2(0)=1m/s
- For t=1:
v=1+2(1)=3m/s
- For t=2:
v=1+2(2)=5m/s
- For t=3:
v=1+2(3)=7m/s
- (0,1)
- (1,3)
- (2,5)
- (3,7)
1. Draw the axes: Time t on the x-axis and Velocity v on the y-axis.
2. Mark the points calculated above on the graph.
3. Connect the points with a straight line since the relationship is linear.
- Label the y-intercept at (0,1).
- Indicate the slope of the line as 2 (rise over run).
- Title the graph as "Velocity-Time Graph".
The graph will be a straight line starting from the point (0,1) and increasing linearly with a slope of 2.
Topper's Solved these Questions
- BOOK - CENGAGE PHYSICS ENGLISHCHAPTER - BASIC MATHEMATICSEXERCISE - Exercise 2.32videos
BASIC MATHEMATICS
- BOOK - CENGAGE PHYSICS ENGLISHCHAPTER - BASIC MATHEMATICSEXERCISE - Exercise 2.46videos
BASIC MATHEMATICS
- BOOK - CENGAGE PHYSICS ENGLISHCHAPTER - BASIC MATHEMATICSEXERCISE - Exercise 2.12videos
BASIC MATHEMATICS
- BOOK - CENGAGE PHYSICS ENGLISHCHAPTER - ARCHIVES 2 VOLUME 6EXERCISE - Integer4videos
ARCHIVES 2 VOLUME 6
- BOOK - CENGAGE PHYSICS ENGLISHCHAPTER - CALORIMETRYEXERCISE - Solved Example13videos
CALORIMETRY
Similar Questions
A particle starts moving with initial velocity u=25ms−1 and retardation a=−2ms−2. Draw the velocity-time graph.
View Solution

For a particle moving along straight line with constant acceleration (a), we define velocity of the particle with time as
v=u+at, (u=initial velocity)
Draw the velocity-time graph of the particle in following situations.
(i) Velocity is decresing with time (i.e., acceleration in negative)
(ii) Initial velocity is negative but acceleration is positiveView Solution
Knowledge Check
- Question 1 - Select One
The velocity of the particle at any time t is given by vu=2t(3−t)ms−1. At what time is its velocity maximum?
A2 sB3 sC2/3 sD3/2 s
If acceleration of a particle at any time is given by a=2t+5
Calculate the velocity after 5 s, if it starts from restView SolutionIf a particle starts moving along x-axis from the origin with initial velocity u=1ms−1 and acceleration a=2ms−2, the relationship between displacement and time is
x=ut+12at2=1×t+12×2×t2=t+r2
Draw the displacement (x)-time (t) graph.View SolutionA particle moves rectilinearly with initial velocity u and constant acceleration a. Find the average velocity of the particle in a time interval from t=0 to t=t second of its motion.
View SolutionA particle is moving along x-direction with a constant acceleration a. The particle starts from x=x0 position with initial velocity u. We can define the position of the particle with time by the relation
x=x0+ut+12at2
plot the position of the particle in relation with time is following situations
(i) If initial position of the particle is on negativ x-axis, initial velocity is positive and acceleration is negative.
(ii) If initial position is positive, initial velocity is negative and acceleration is positive.View SolutionIf acceleration a(t)=3t2 and initial velocity u=0 m/s , then the velocity of the particle after time t=4 s
View SolutionA particle moves with initial velocity v0 and retardation αv, where v is velocity at any instant t. Then the particle
View SolutionThe acceleration versus time graph of a particle moving in a straight line is show in. The velocity-time graph of the particle would be
 .View Solution

