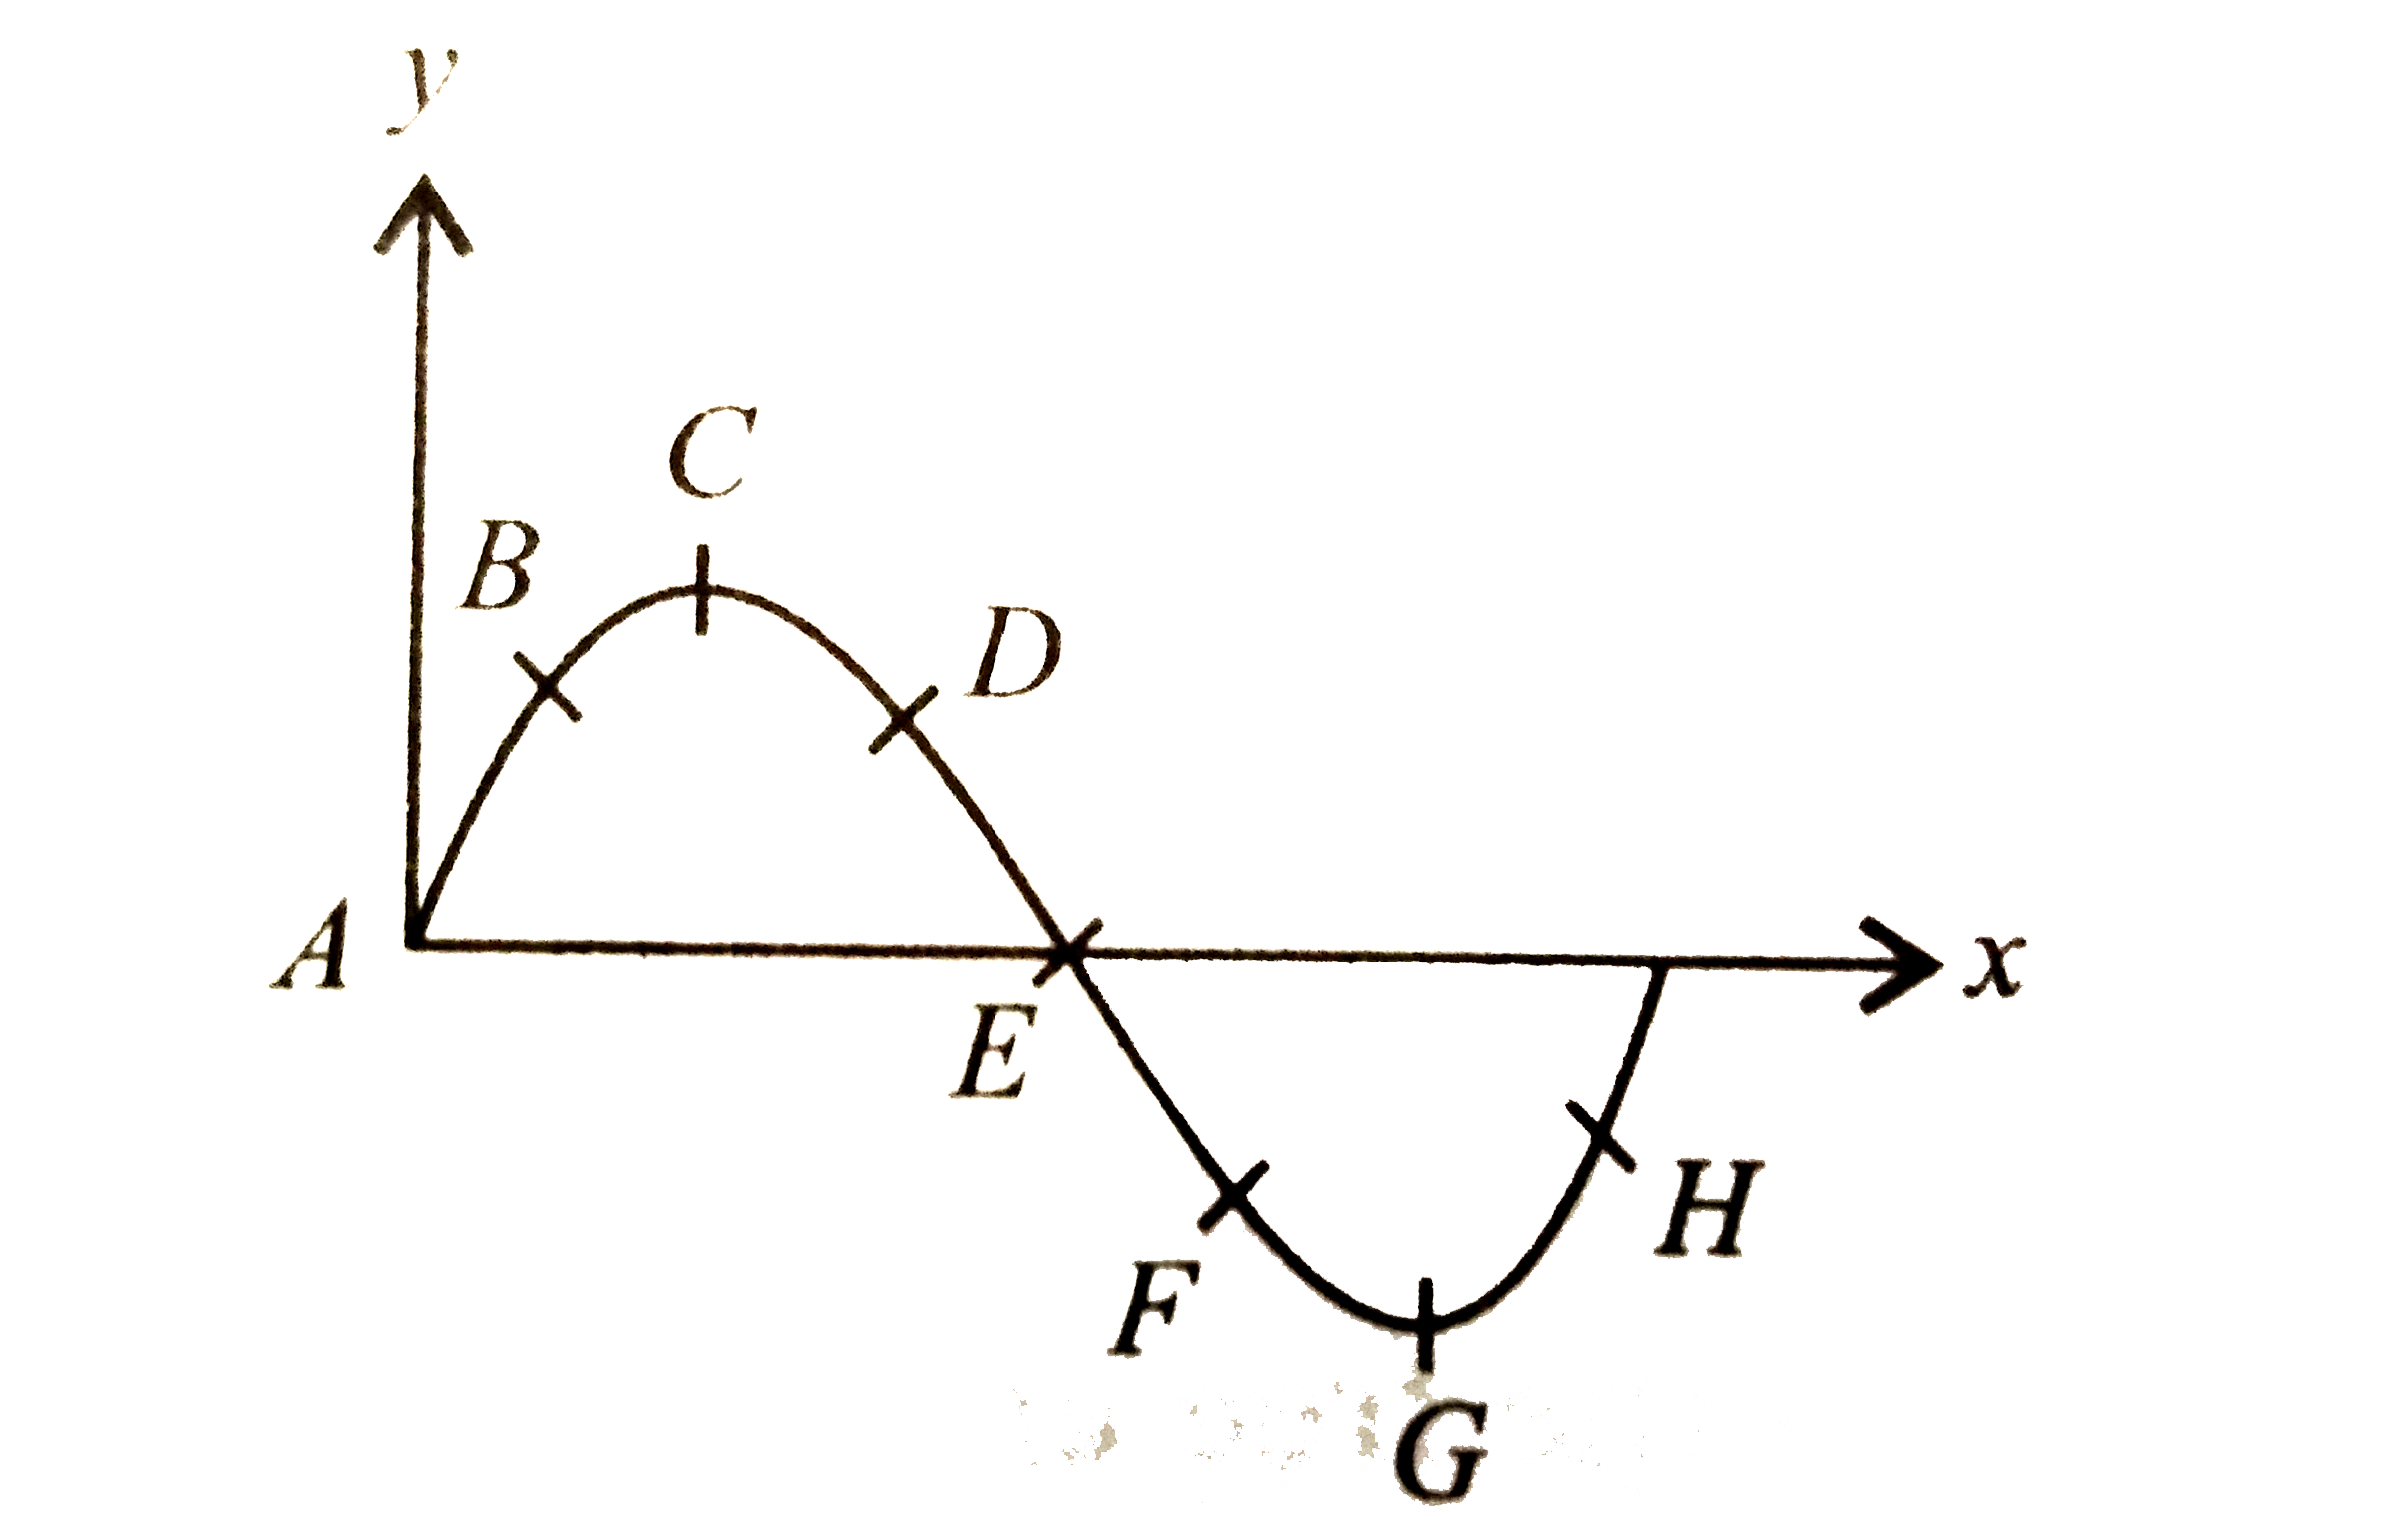
The diagram below shows an instantaneous position of a string as a transverse progressive wave travels along it from left to right Which one of the following correctly shows the direction of the velocity of the points 1,2 and 3 on the string?
→ → →
← ← →
↓ ↓ ↓
↓ ↑ ↓
The correct Answer is:C
Step by step video & image solution for The diagram below shows an instantaneous position of a string as a transverse progressive wave travels along it from left to right Which one of the following correctly shows the direction of the velocity of the points 1,2 and 3 on the string? by Physics experts to help you in doubts & scoring excellent marks in Class 11 exams.
Updated on:21/07/2023Similar Questions
Knowledge Check
A transverse wave is travelling along a string from left to right. The figure below represents the shape of the string at a given instant. At this instant, among the following, choose the wrong statement.
 APoints D, E, F have upward positive velocity.BPoints A, B and H have downward negative velocityCPoint C and G have zero velocity.DPoints A and E have minimum velocity.
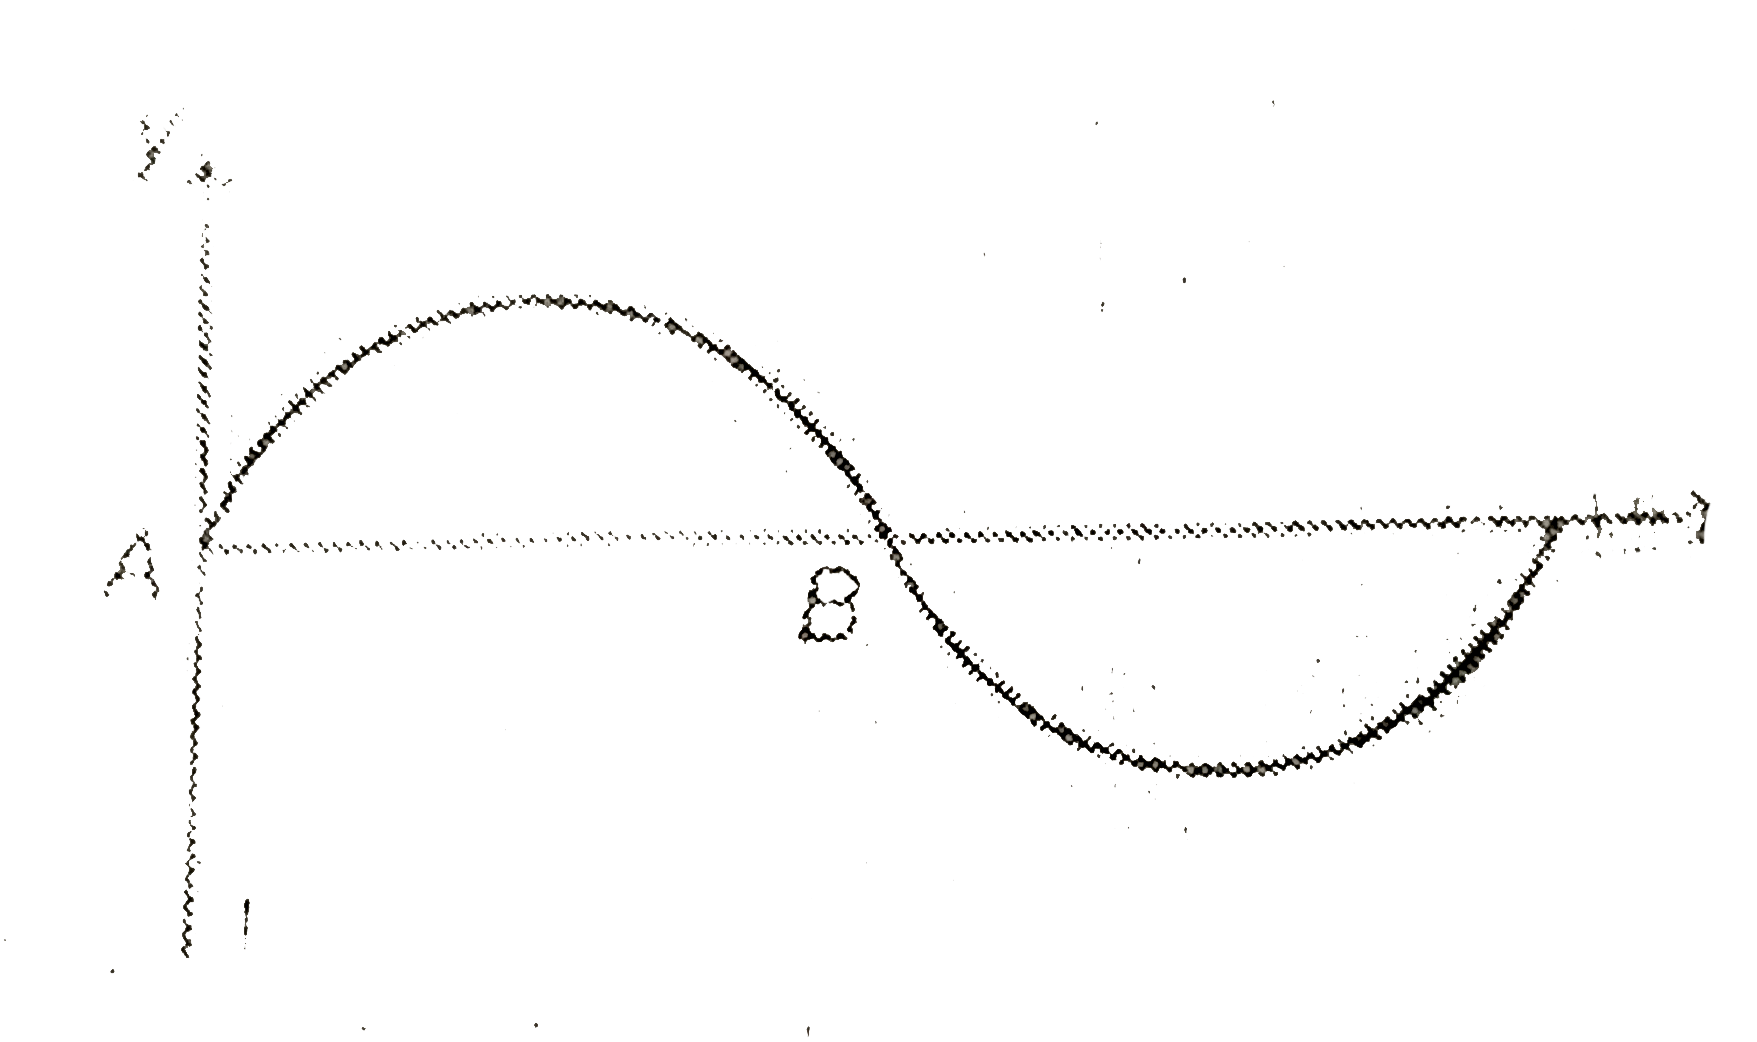
The diagram below (Fig. 15.13.1) show the propagation of a wave. Which points are in phase ?
 AA, BBB, CCB, DDE, B
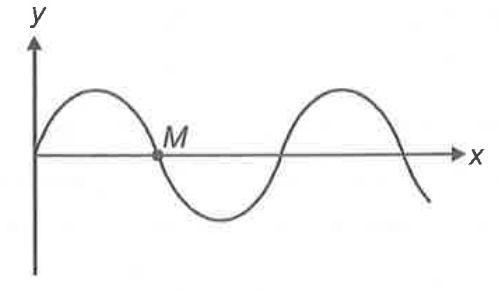
Figure shows the shape of part of a long string in which transverse waves are produced by attaching one end of the string to tuning fork of frequency 250 Hz. What is the velocity of the waves?

View SolutionTwo strings, A and B, of lengths 4L and L respectively and same mass M each, are tied together to form a knot 'O' and stretched under the same tension. A transverse wave puise is sent along the composite string from the side A, as shown to the right. Which of the following diagrams correctly shows the reflected and transmitted waves pulses near the knot 'O' ?
_S01_011_Q01.png)
View SolutionConsider a standing wave formed on a string . It results due to the superposition of two waves travelling in opposite directions . The waves are travelling along the length of the string in the x - direction and displacements of elements on the string are along the y - direction . Individual equations of the two waves can be expressed as
Y1=6(cm)sin[5(rad/cm)x−4(rad/s)t]
Y2=6(cm)sin[5(rad/cm)x+4(rad/s)t] Here x and y are in cm.
Answer the following questions.
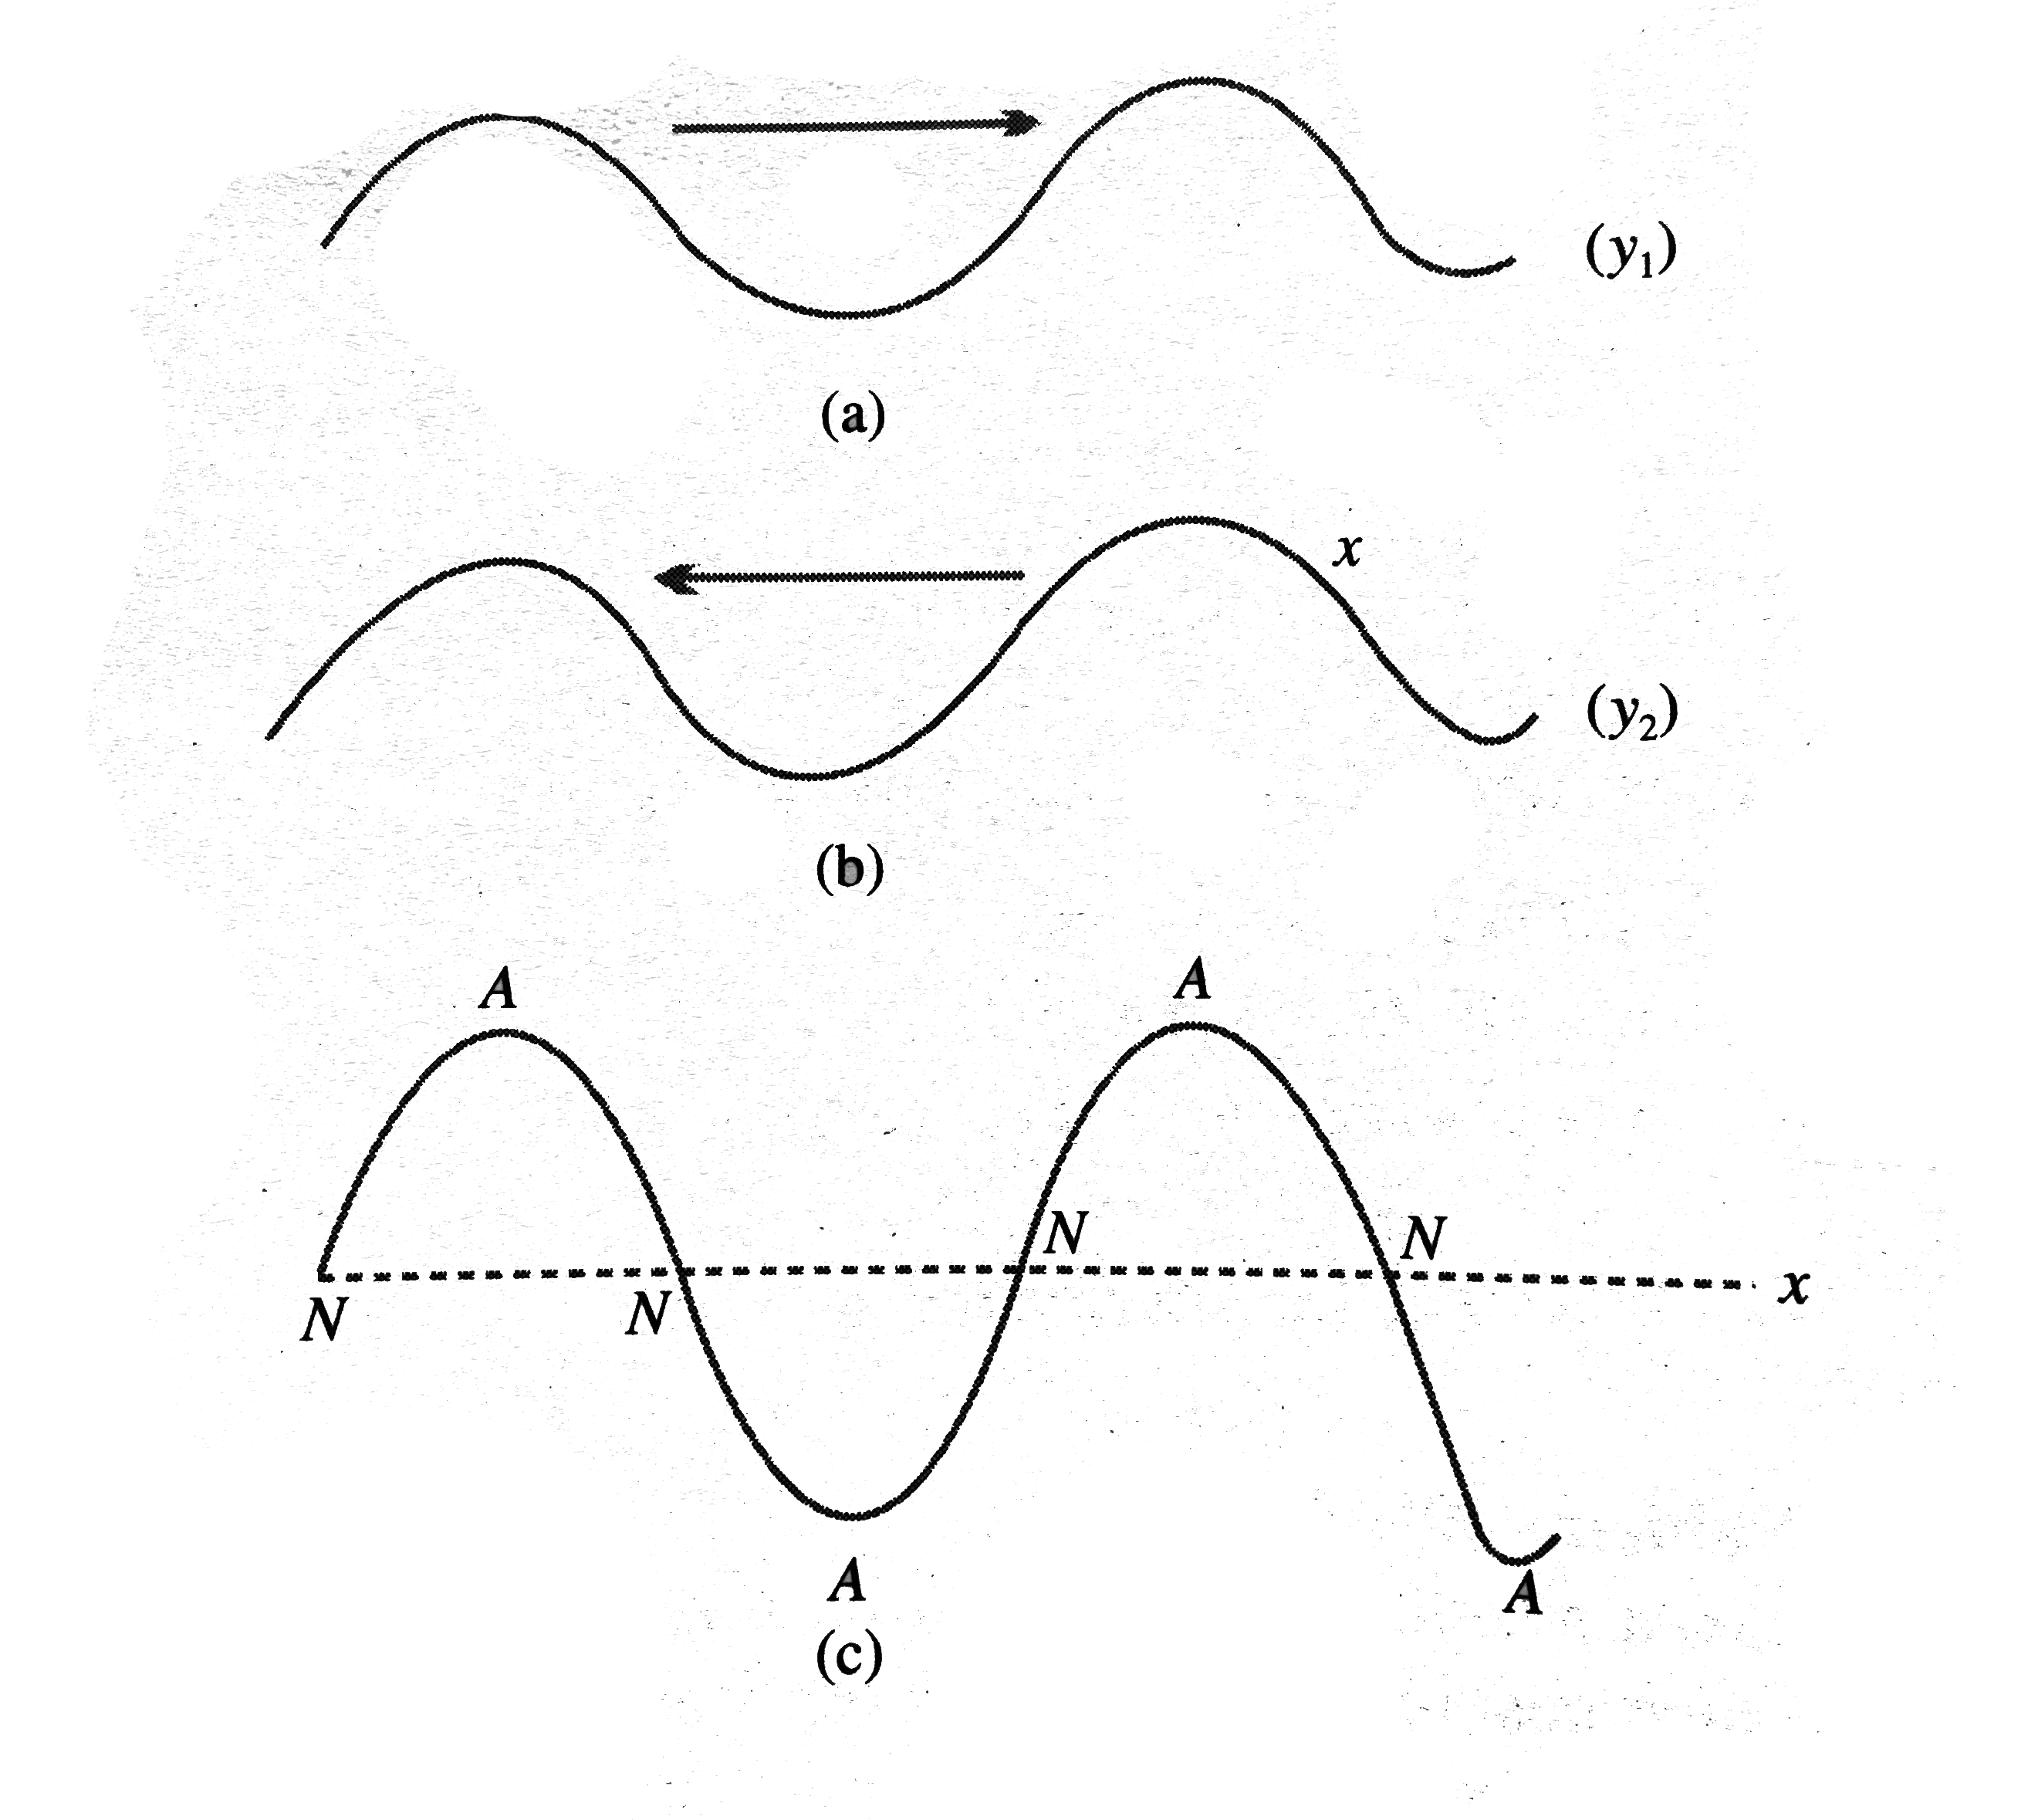
Figure 7.104( c) shows the standing wave pattern at t=0 due to superposition of waves given by y1 and y2 in Figs.7.104(a) and (b) . In Fig. 7.104 (c ) , N is a node and A and antinode . At this instant say t=0 , instantaneous velocity of points on the string named as A

View SolutionConsider a standing wave formed on a string . It results due to the superposition of two waves travelling in opposite directions . The waves are travelling along the length of the string in the x - direction and displacements of elements on the string are along the y - direction . Individual equations of the two waves can be expressed as
Y1=6(cm)sin[5(rad/cm)x−4(rad/s)t]
Y2=6(cm)sin[5(rad/cm)x+4(rad/s)t] Here x and y are in cm.
Answer the following questions.
If one end of the string is at x=0 , positions of the nodes can be described as
View SolutionConsider a standing wave formed on a string . It results due to the superposition of two waves travelling in opposite directions . The waves are travelling along the length of the string in the x - direction and displacements of elements on the string are along the y - direction . Individual equations of the two waves can be expressed as
Y1=6(cm)sin[5(rad/cm)x−4(rad/s)t]
Y2=6(cm)sin[5(rad/cm)x+4(rad/s)t] Here x and y are in cm.
Answer the following questions.
Amplitude of simple harmonic motion of a point on the string that is located at x=1.8cm will be
View SolutionA bob of mass m is connected by string of length L to point P. The system is released from rest with the pendulum bob in a horizontal position. Which of the following graph is correctly showing the variation of T (tension) with Ɵ?
View Solution


