A bob of mass m is connected by string of length L to point P. The system is released from rest with the pendulum bob in a horizontal position. Which of the following graph is correctly showing the variation of T (tension) with Ɵ?
To solve the problem, we need to analyze the relationship between the tension (T) in the string and the angle (θ) that the string makes with the vertical when the pendulum bob is released from a horizontal position.
1. Understanding the Setup:
- We have a pendulum bob of mass m attached to a string of length L.
- The pendulum is released from rest when the bob is in a horizontal position (θ = 90°).
2. Forces Acting on the Bob:
- When the bob is at an angle θ from the vertical, two forces act on it:
- The gravitational force mg acting downwards.
- The tension T in the string acting along the string towards the pivot point.
3. Free Body Diagram:
- Draw a free body diagram showing the forces acting on the bob. The gravitational force can be resolved into two components:
- One component acting along the string (which is balanced by tension).
- Another component acting perpendicular to the string, which contributes to the pendulum's motion.
4. Expression for Tension:
- The vertical component of the tension must balance the weight of the bob when it is at an angle θ:
Tcos(θ)=mg
- The horizontal component of the tension provides the centripetal force necessary for circular motion:
Tsin(θ)=mv2L
- However, for small angles, we can simplify our analysis.
5. Small Angle Approximation:
- For small angles, sin(θ)≈θ (in radians). Thus, we can substitute this into our tension equation:
T=mgcos(θ)+mv2L
- As the pendulum swings down, the angle θ increases, which affects the tension.
6. Graph of Tension vs. Angle:
- As θ increases from 0 to 90°, the tension T will decrease because the component of the gravitational force acting along the string increases.
- Therefore, the graph of T versus θ will show a downward trend.
7. Identifying the Correct Graph:
- Based on the analysis, the correct graph will show that as θ increases, T decreases. Among the options provided, option 3 shows this relationship correctly.
Conclusion:
The correct graph showing the variation of tension T with angle θ is option 3, which depicts a downward trend as θ increases.
- We have a pendulum bob of mass m attached to a string of length L.
- The pendulum is released from rest when the bob is in a horizontal position (θ = 90°).
- When the bob is at an angle θ from the vertical, two forces act on it:
- The gravitational force mg acting downwards.
- The tension T in the string acting along the string towards the pivot point.
- Draw a free body diagram showing the forces acting on the bob. The gravitational force can be resolved into two components:
- One component acting along the string (which is balanced by tension).
- Another component acting perpendicular to the string, which contributes to the pendulum's motion.
- The vertical component of the tension must balance the weight of the bob when it is at an angle θ:
Tcos(θ)=mg
- The horizontal component of the tension provides the centripetal force necessary for circular motion:
Tsin(θ)=mv2L
- However, for small angles, we can simplify our analysis.
- For small angles, sin(θ)≈θ (in radians). Thus, we can substitute this into our tension equation:
T=mgcos(θ)+mv2L
- As the pendulum swings down, the angle θ increases, which affects the tension.
- As θ increases from 0 to 90°, the tension T will decrease because the component of the gravitational force acting along the string increases.
- Therefore, the graph of T versus θ will show a downward trend.
- Based on the analysis, the correct graph will show that as θ increases, T decreases. Among the options provided, option 3 shows this relationship correctly.
The correct graph showing the variation of tension T with angle θ is option 3, which depicts a downward trend as θ increases.
Similar Questions
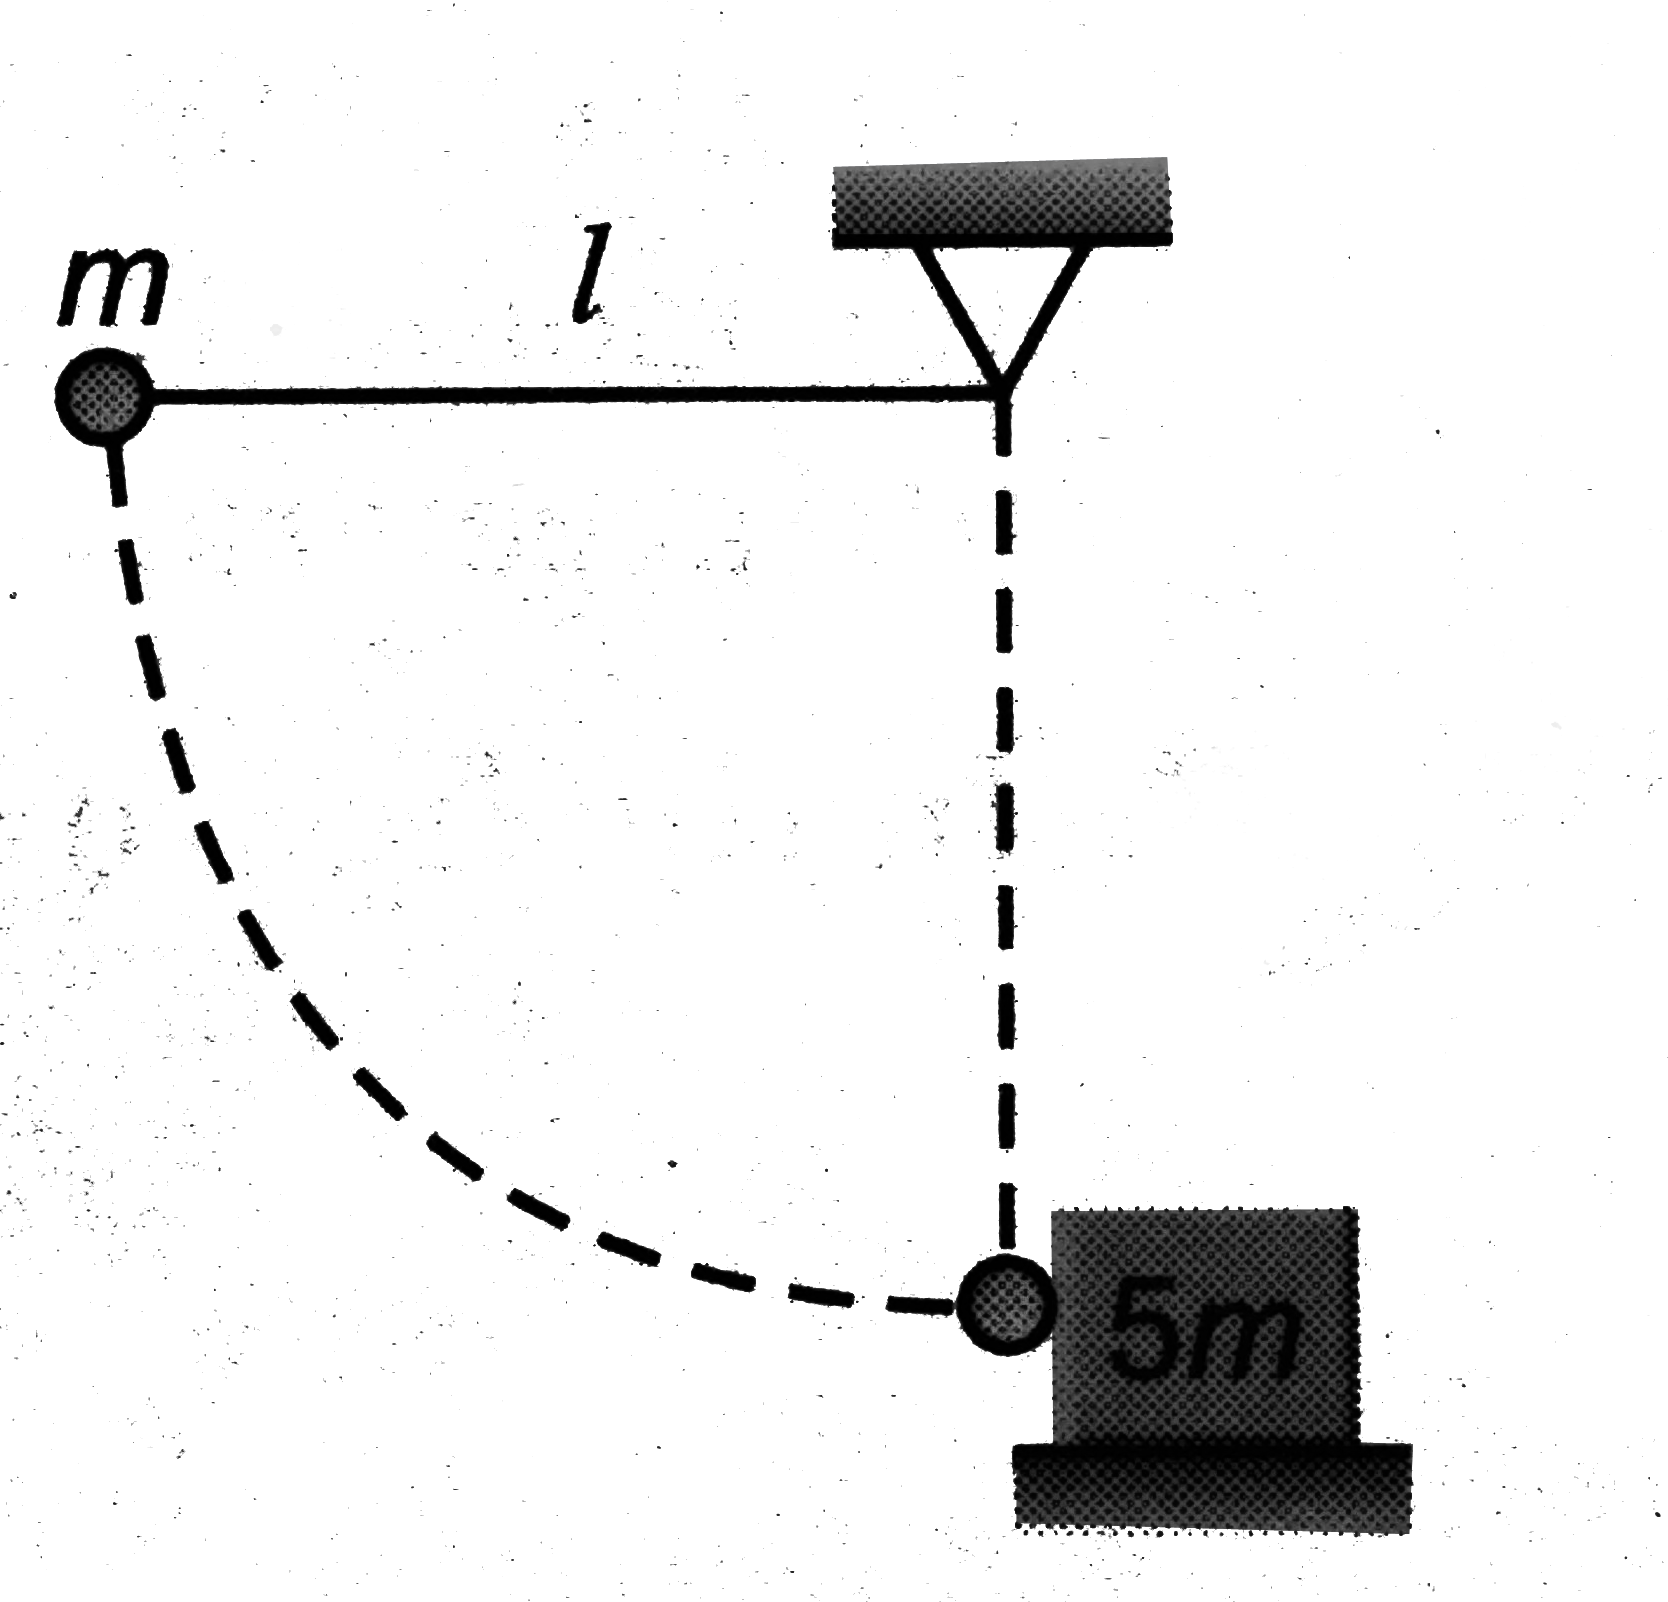
A pendulum bob of mass m connected to the end of material string of length l is released from rest from horizontal position as shown in the figure. At the lowest point the bob makes an elastic collision with a stationary block of mass 5m, which is kept on a frictionless surface. Choose out the correct statement(s) for the instant just after the impact.

View SolutionA bob of mass m attached with a string of length l tied to a point on ceiling is released from a position when its string is horizontal. At the bottom most point of its motion, an identical mass m gently stuck to it. Find the maximum angle from the vertical to which it rotates.
View Solution
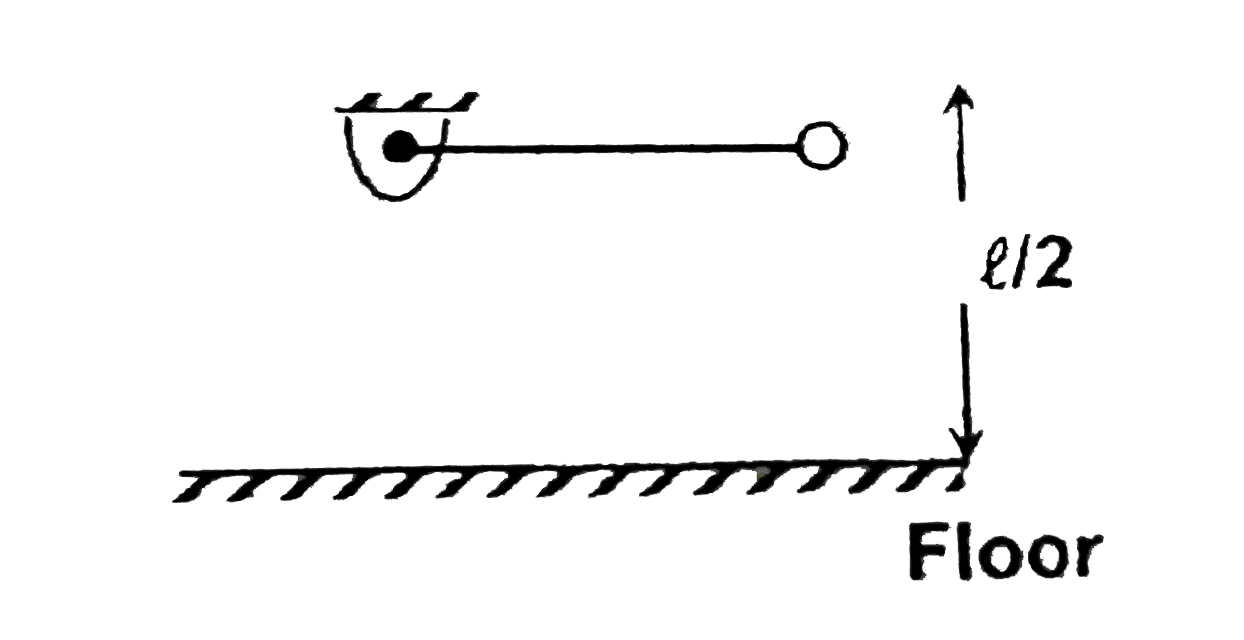
A bob of mass m connected to the end of an inextensible string of length l, is released from position shown in figure. If impacts of bob with smooth floors is perfectly inelastic. Choose the correct options (s)
View SolutionA simple pendulum is constructed by attaching a bob of mass m to a string of length L fixed at its upper end. The bob oscillates in a vertical circle. It is found that the speed of the bob is v when the string makes an angle θ with the vertical. Find the tension in the string at this instant.
View SolutionA bob of mass m attached to an inextensible string of length I is suspended from a vertical support. The bob rotates in a horizontal circle with an angular speed ω red/s about the vertical. About the point of suspension:
View SolutionA bob hangs from a rigid support by an inextensible string of length l. It is released from rest when string makes an agngle 60∘ with vertical . The speed of the bob at the lowest position is
View SolutionA simple pendulum is constructed by attaching a bob of mas m to a string of length L fixed at its upper end. The bob oscillates in a vertical circle. It is found that the speed of the bob is v when the string makes an angle θ with the vertical. Find the tension in the string at this instant.
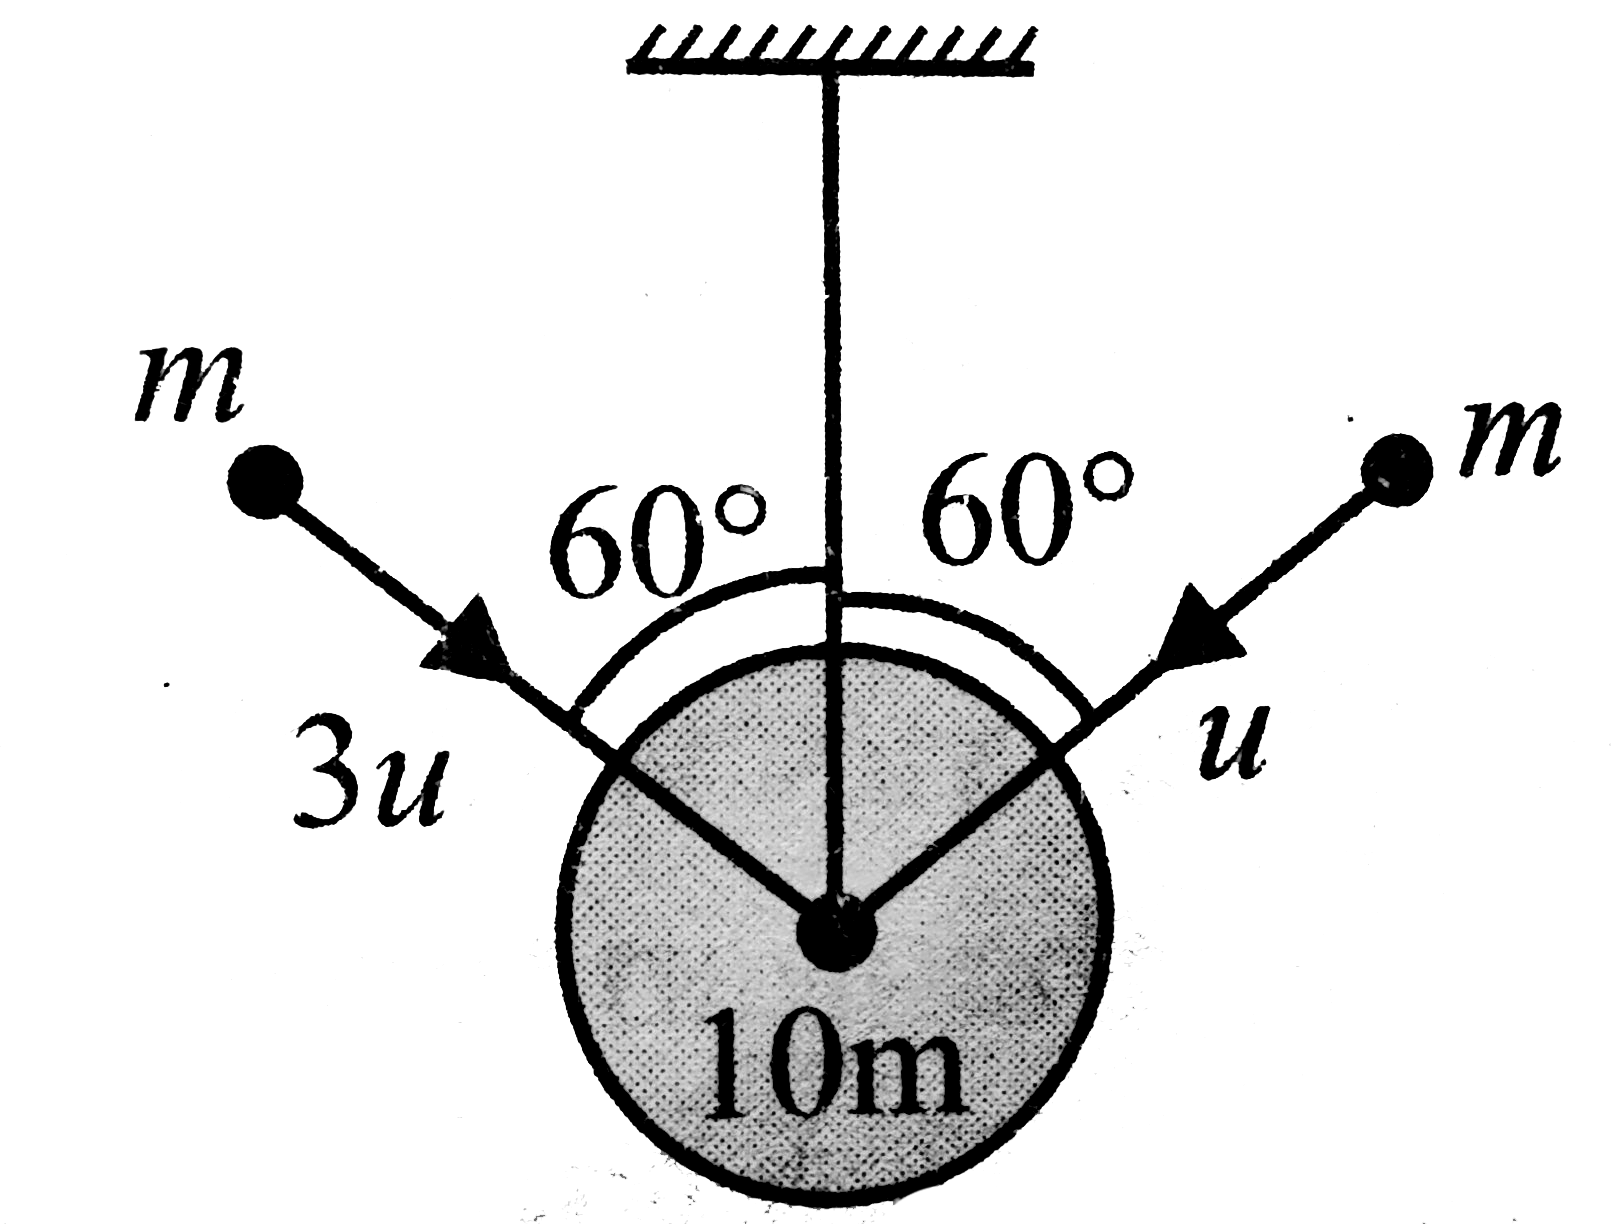
View SolutionA bob of mass 10m is suspended through an inextensible string of length l. When the bob is at rest in equilibrium position, two particles, each of mass m, strike it as shown in Fig. The particles stick after collision. Choose the correct statement from the following:

View SolutionA particle of mass m is tied to a string of length L and whirled into a horizontal plan. If tension in the string is T then the speed of the particle will be :
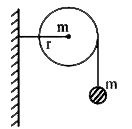
View SolutionAs shown in the figure, a bob of mass m is tied by a massless string whose other end is wound on a fly wheel Ring of radius r and mass m. When released from rest the bob starts falling vertically. When it has covered a distance of h, the speed of the bob will be :

View Solution


