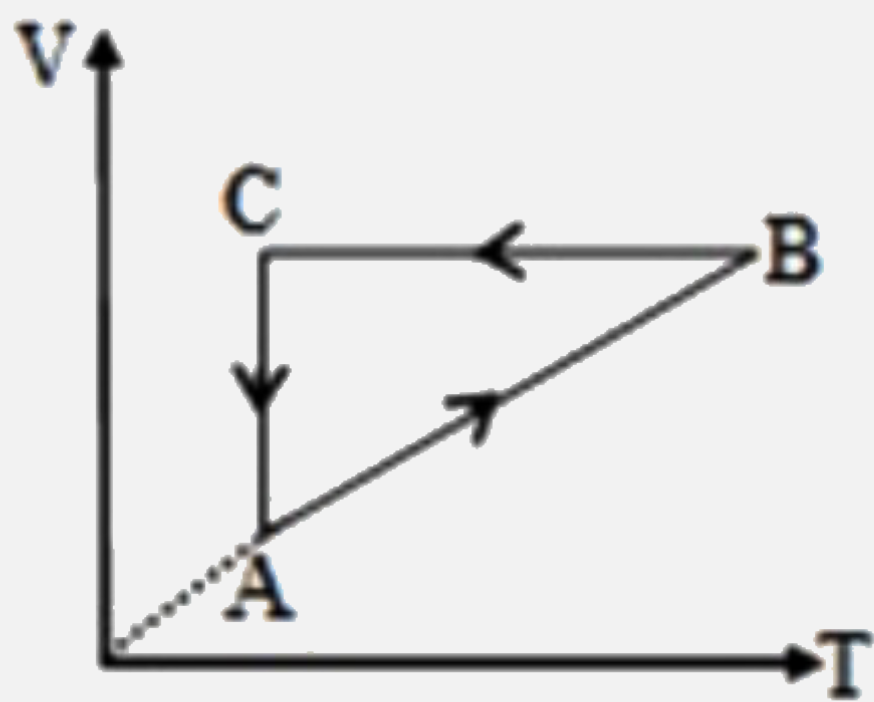
A cyclic process for one mole of an ideal gas is shown in the V-T diagram. The work done in AB, BC and CA repectively are
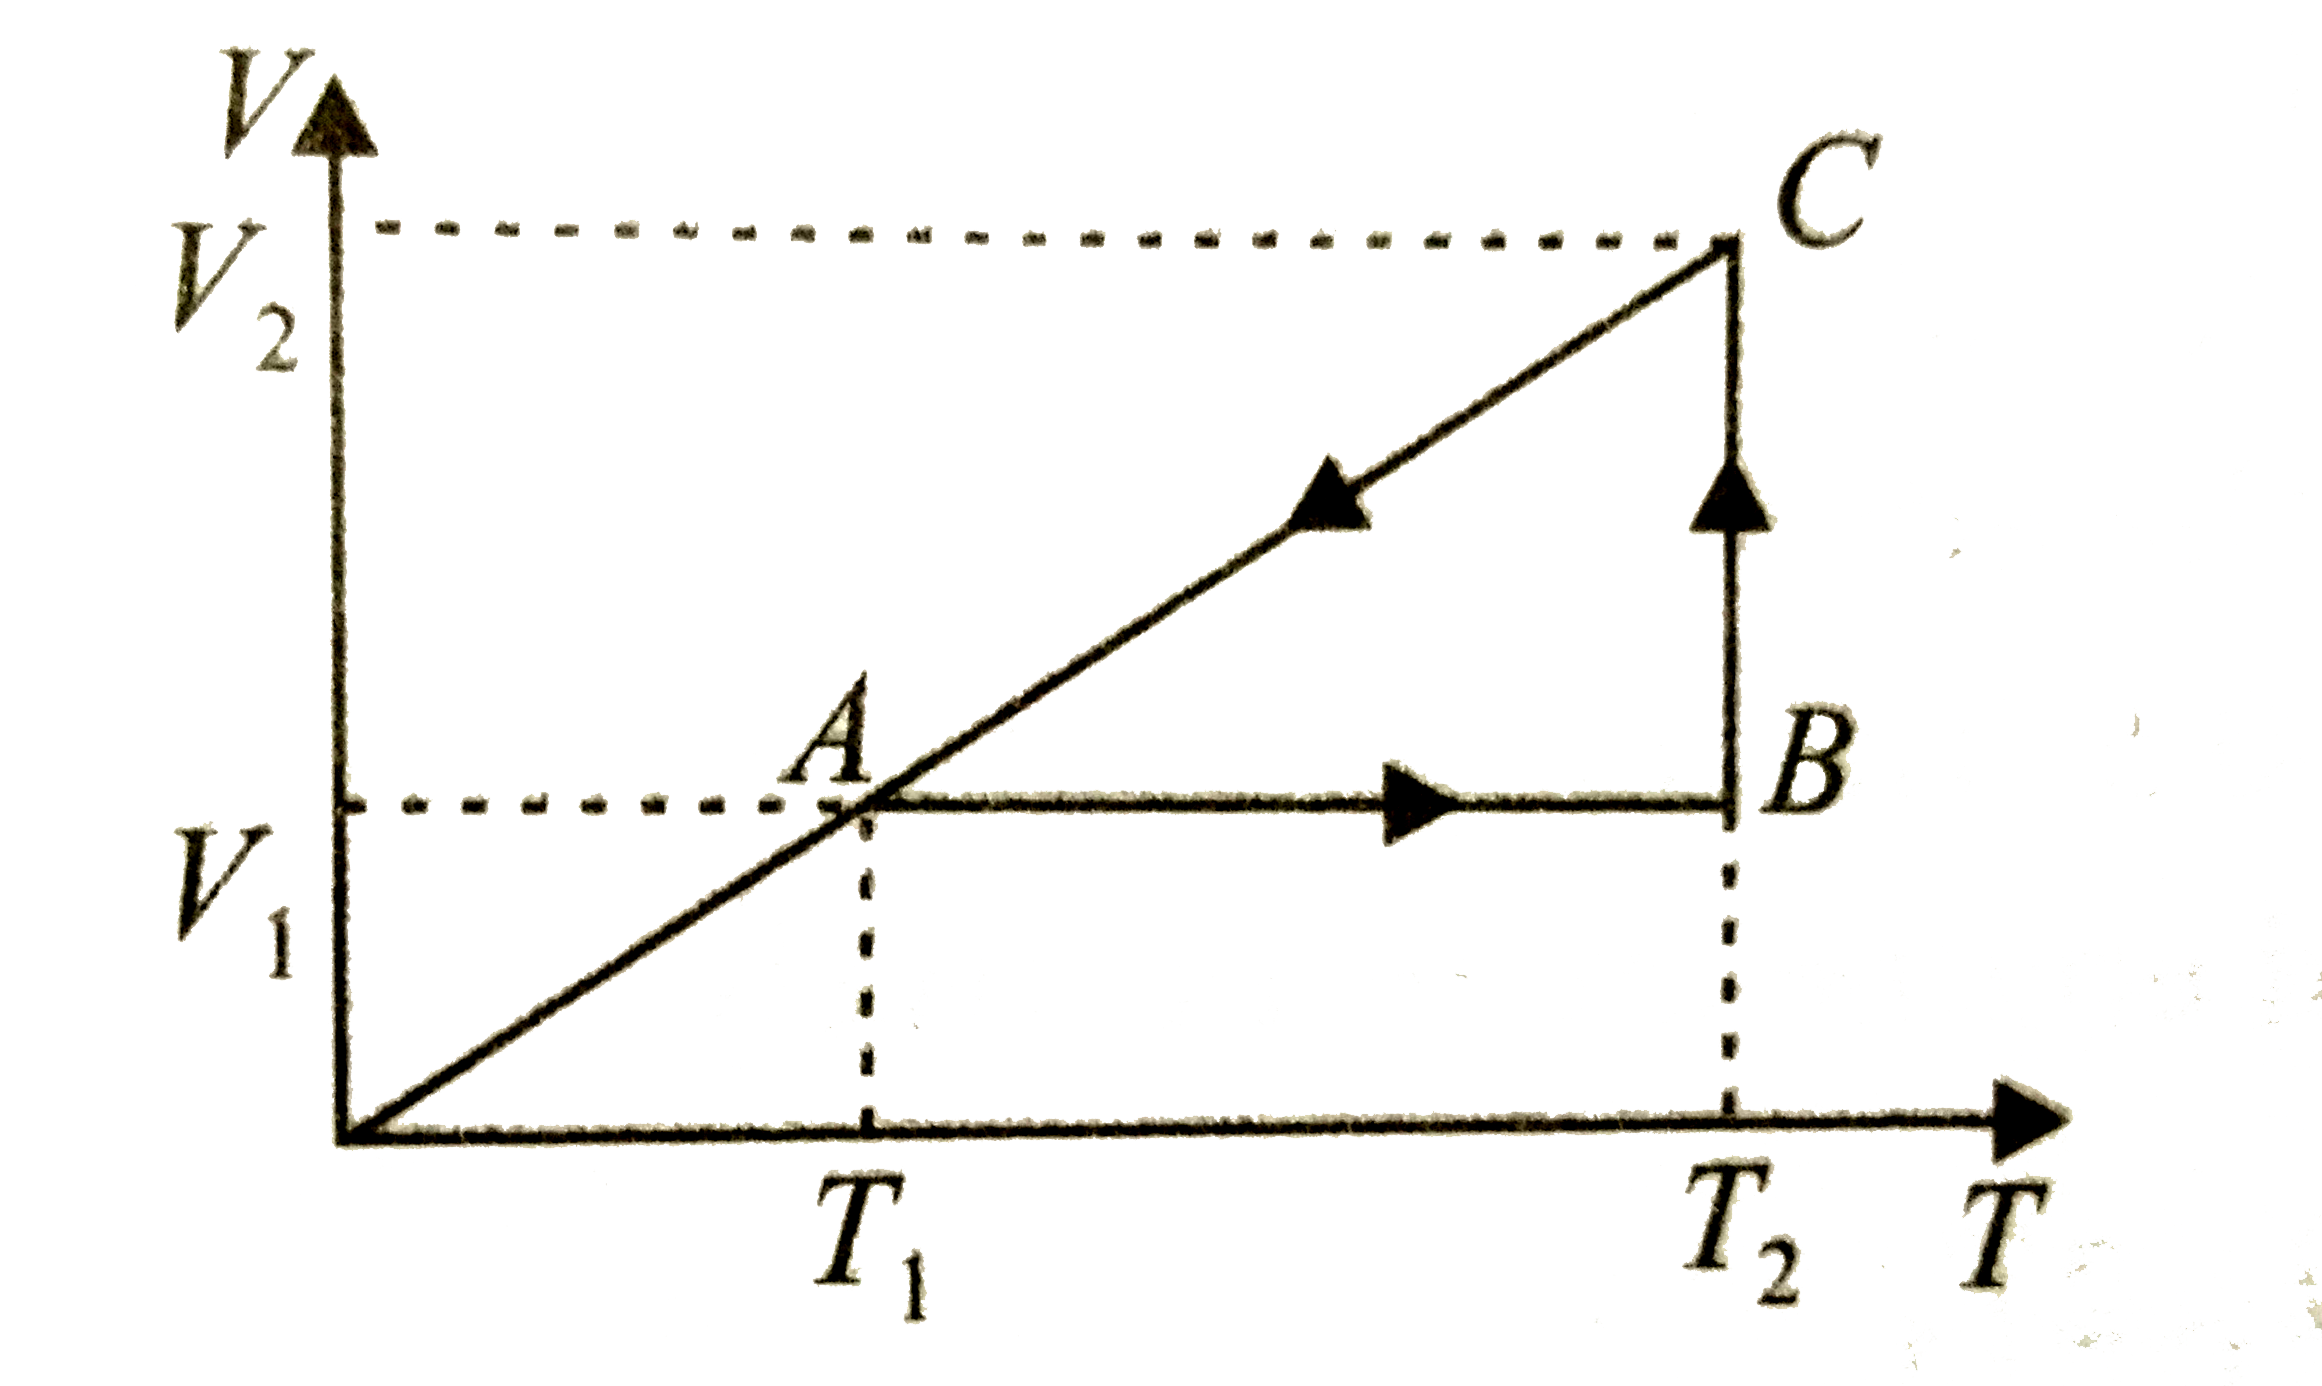
O,RT2ln(V1V2),R(T1−T2)
R(T1−T2),0,RT1lnV1V2
0,RT2ln(V2V1),R(T1−T2)
0,RT2ln(V2V1),R(T2−T1)
The correct Answer is:D
Step by step video & image solution for A cyclic process for one mole of an ideal gas is shown in the V-T diagram. The work done in AB, BC and CA repectively are by Physics experts to help you in doubts & scoring excellent marks in Class 11 exams.
Updated on:21/07/2023Topper's Solved these Questions
- THERMODYNAMICSBOOK - CENGAGE PHYSICS ENGLISHCHAPTER - THERMODYNAMICSEXERCISE - 4
3 Videos
- THERMODYNAMICSBOOK - CENGAGE PHYSICS ENGLISHCHAPTER - THERMODYNAMICSEXERCISE - 5
3 Videos
- THERMODYNAMICSBOOK - CENGAGE PHYSICS ENGLISHCHAPTER - THERMODYNAMICSEXERCISE - 2
3 Videos
- SUPERPOSITION AND STANDING WAVESBOOK - CENGAGE PHYSICS ENGLISHCHAPTER - SUPERPOSITION AND STANDING WAVESEXERCISE - Comprehension Type
5 Videos
- TRANSMISSION OF HEATBOOK - CENGAGE PHYSICS ENGLISHCHAPTER - TRANSMISSION OF HEATEXERCISE - Single correct
9 Videos
Similar Questions
Knowledge Check
The cyclic process for 1 mole of an ideal gas is shown in the V-T diagram. The work done in AB, BC and CA respectively is
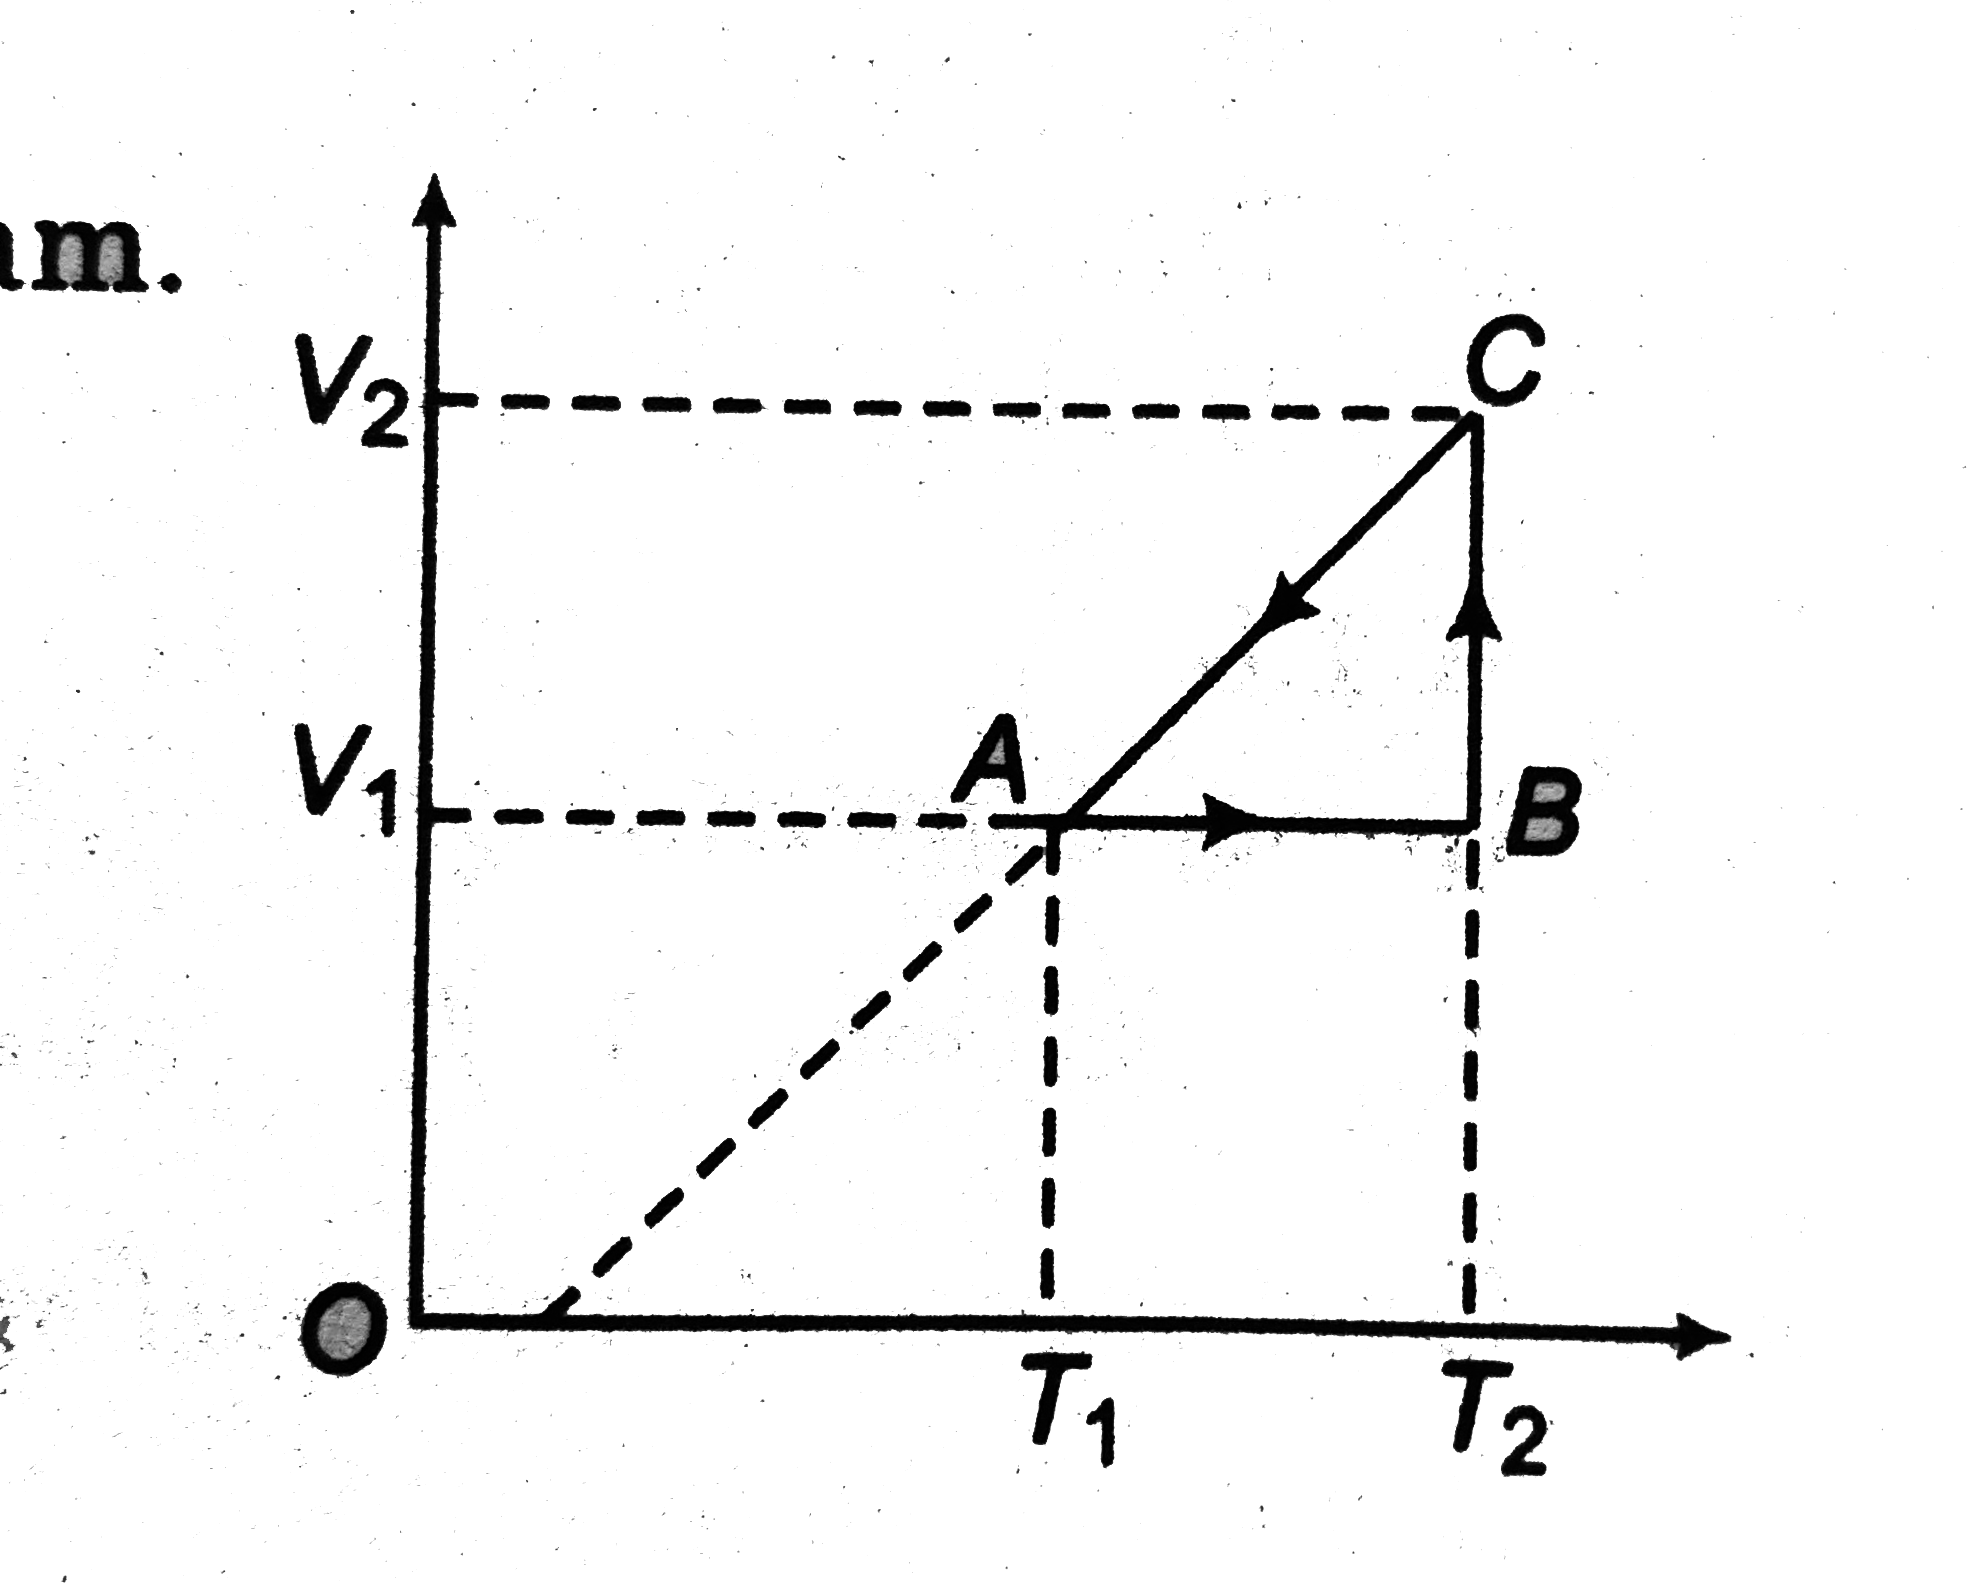 A0,RT1Ln(V1V2),R(T1−T2)BR,(T1−T2)R,RT1In(V1V2)C0,RT2ln(V2V1),RT1V1(V1−V2)D0,RT2ln(V1)V2,R(T1−T2)
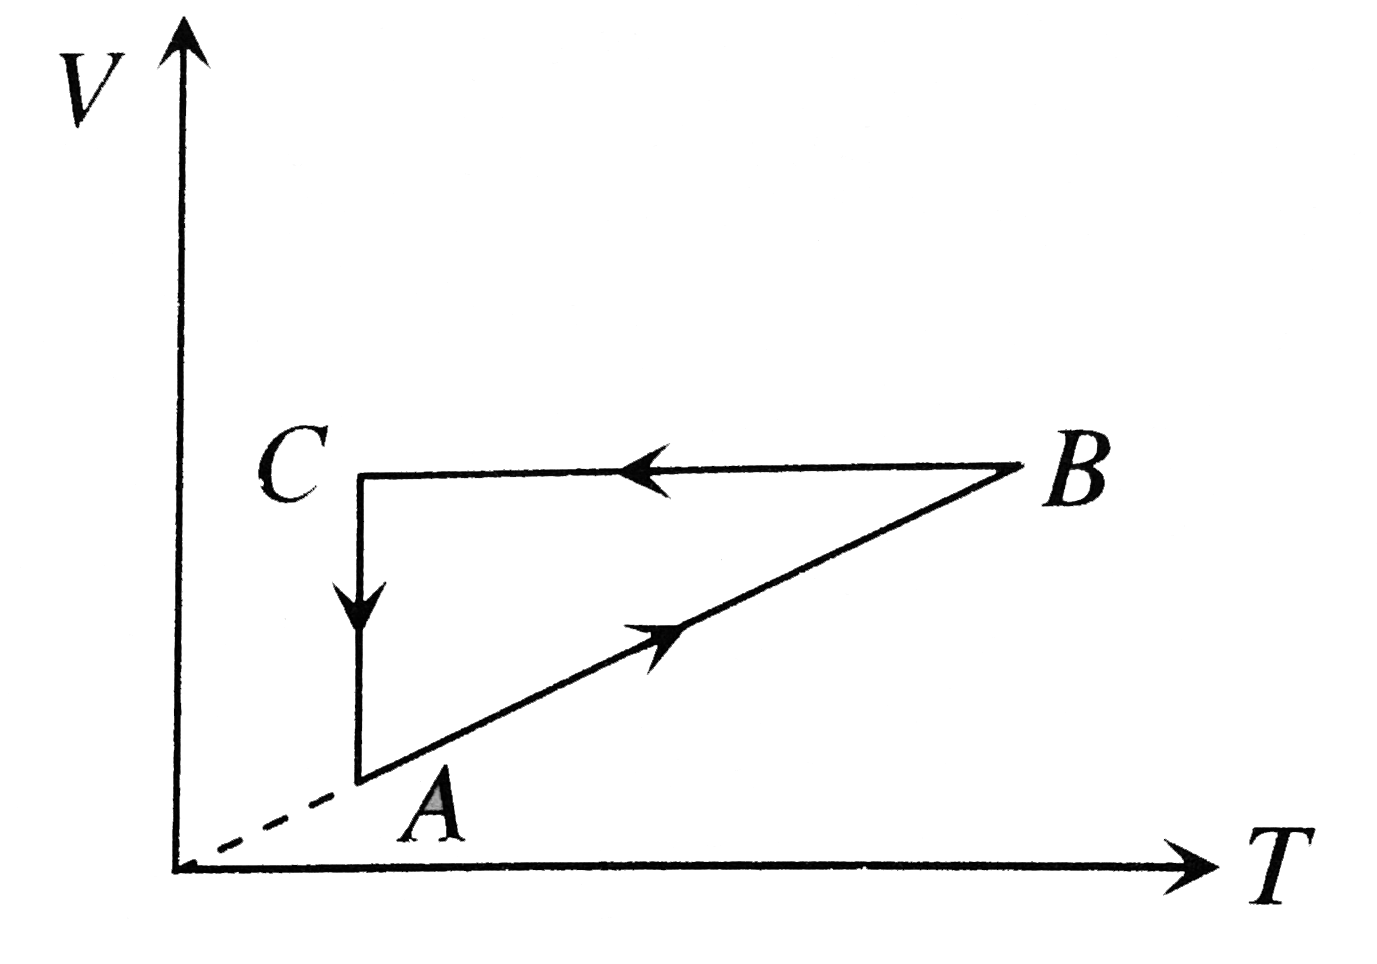
A cyclic process ABCA is shown in the V−T diagram process on the P−V
 A
A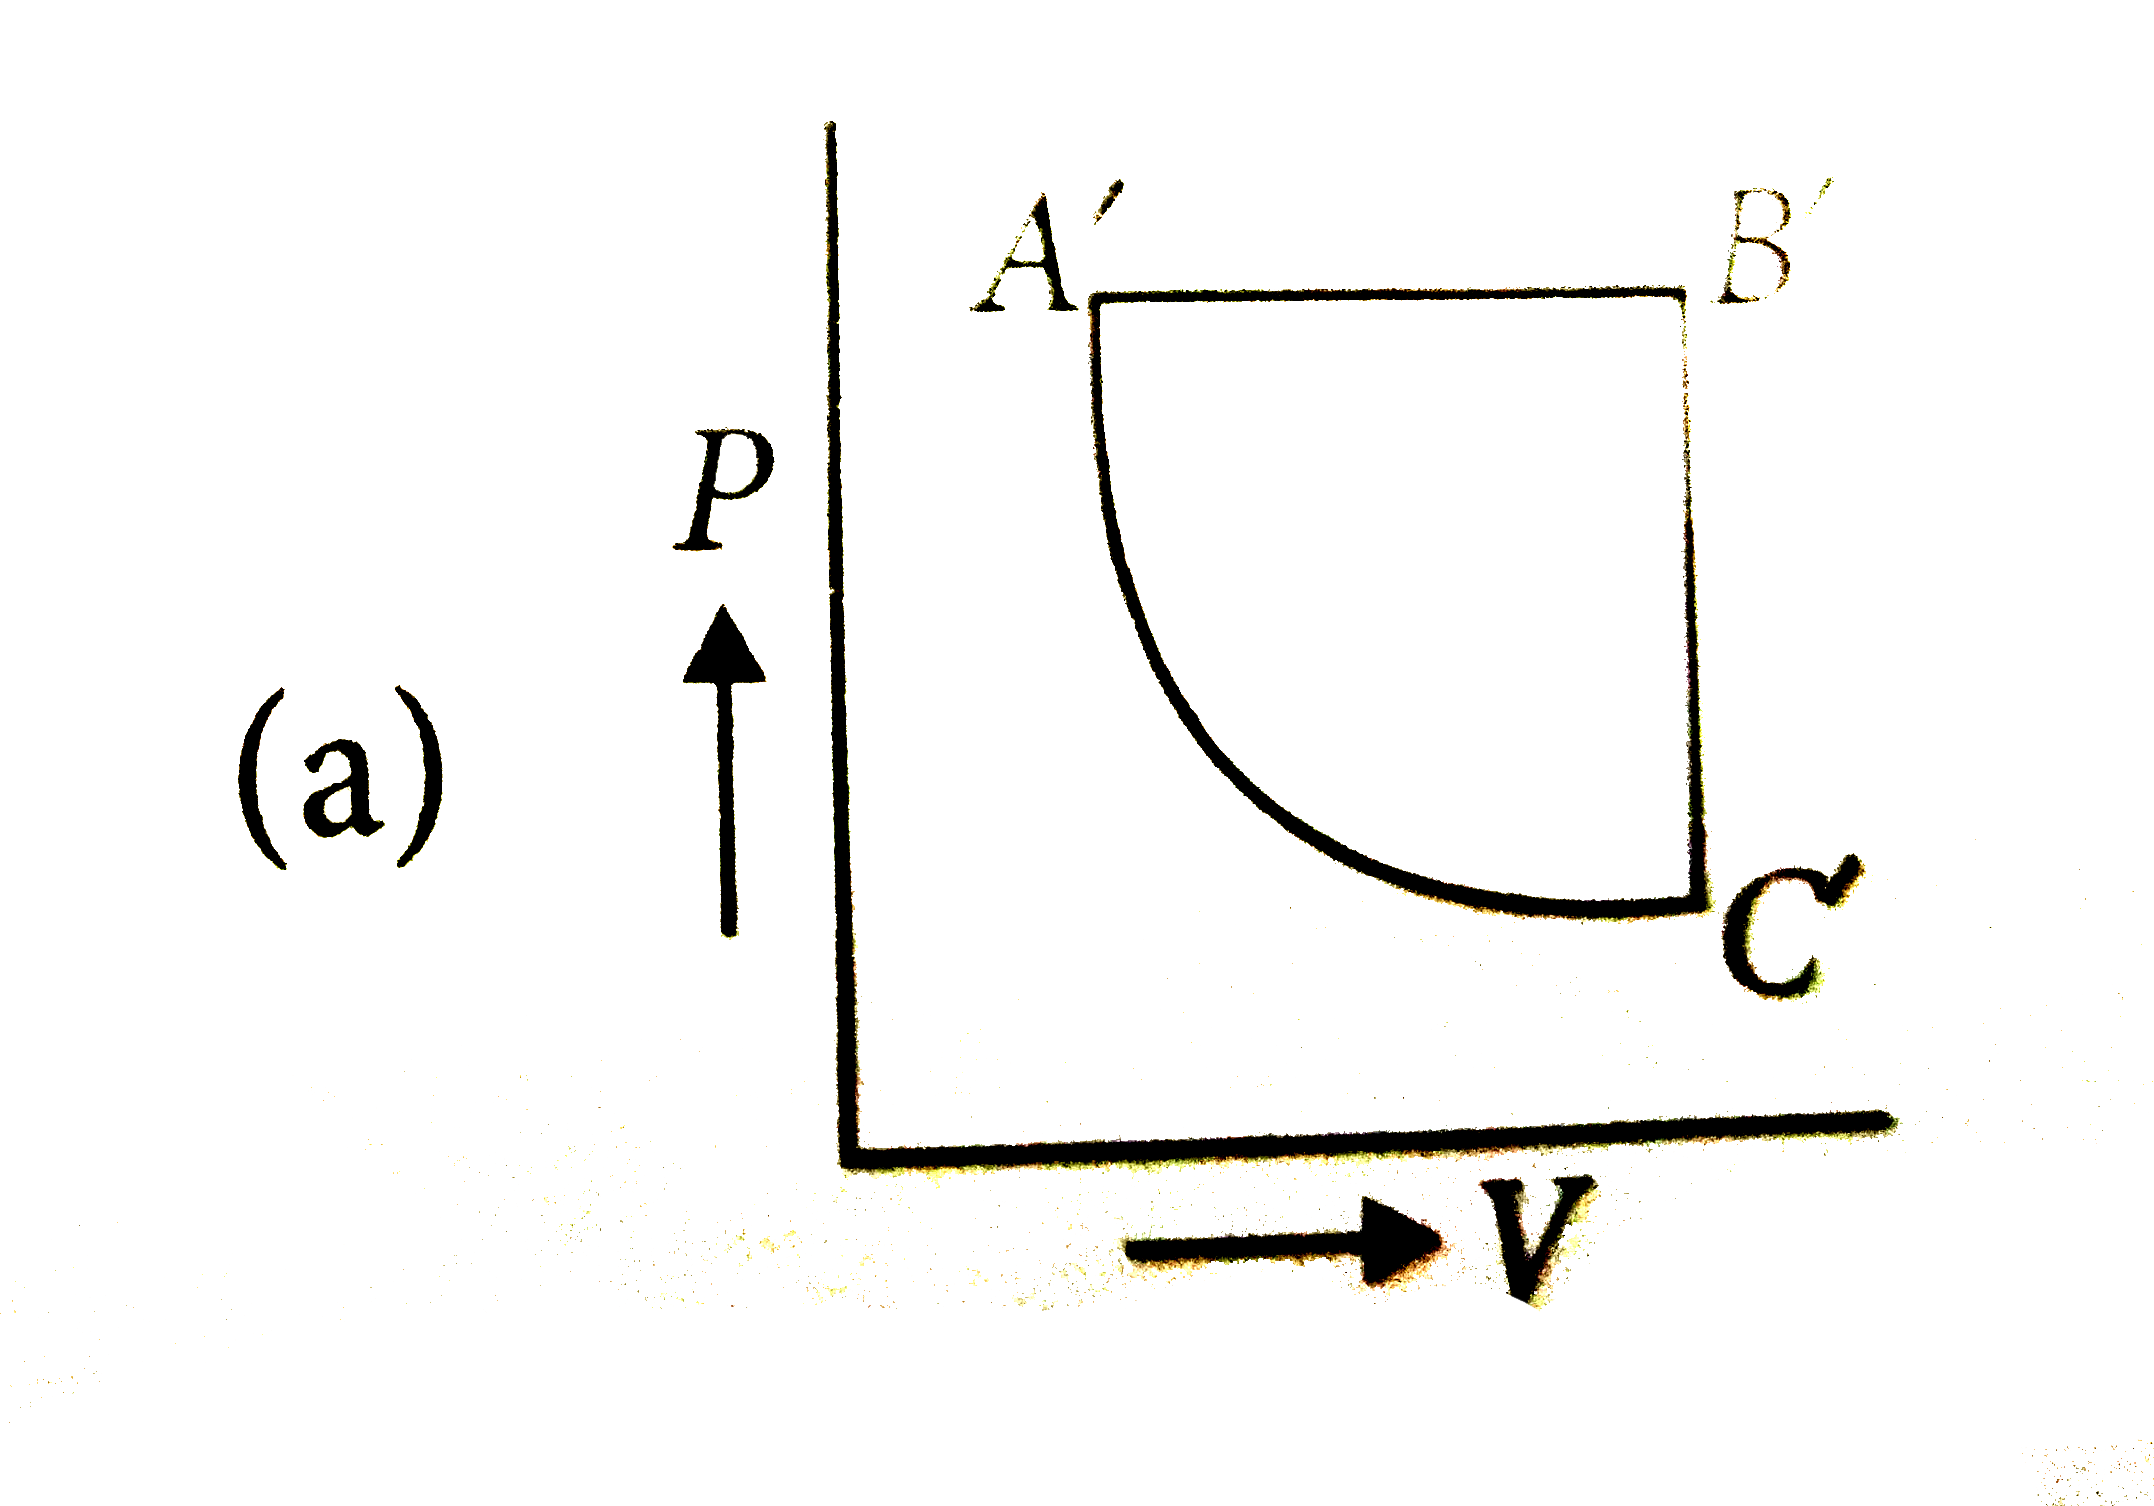 B
B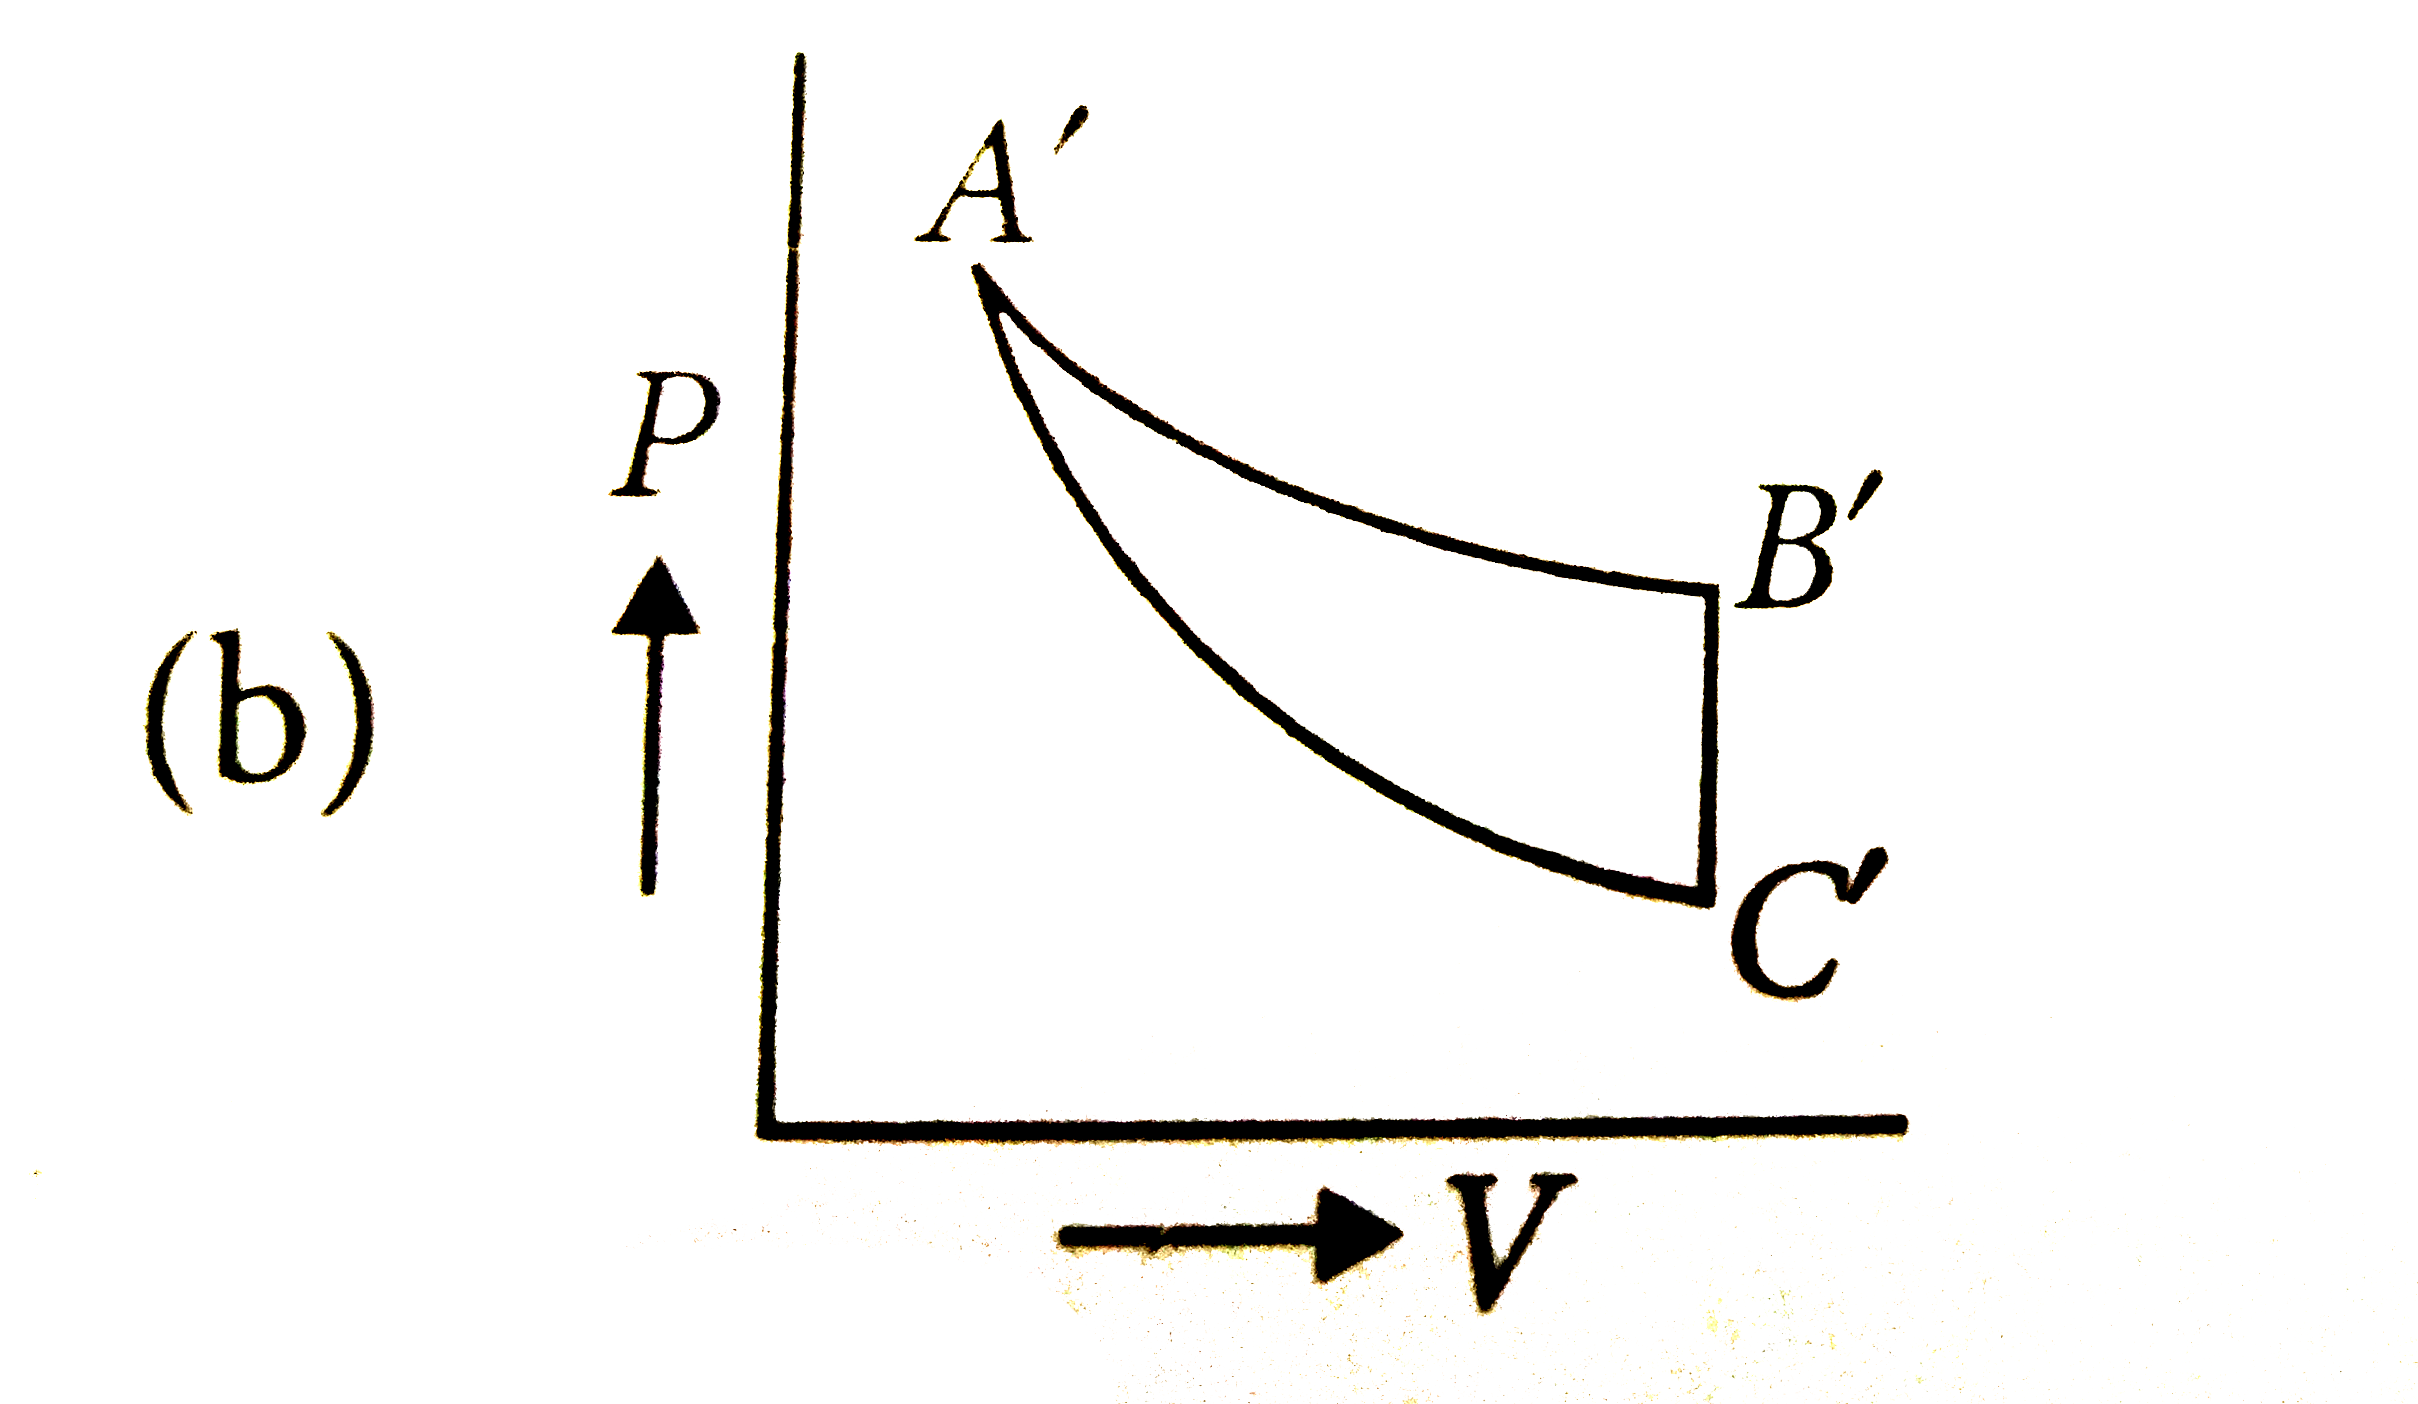 C
C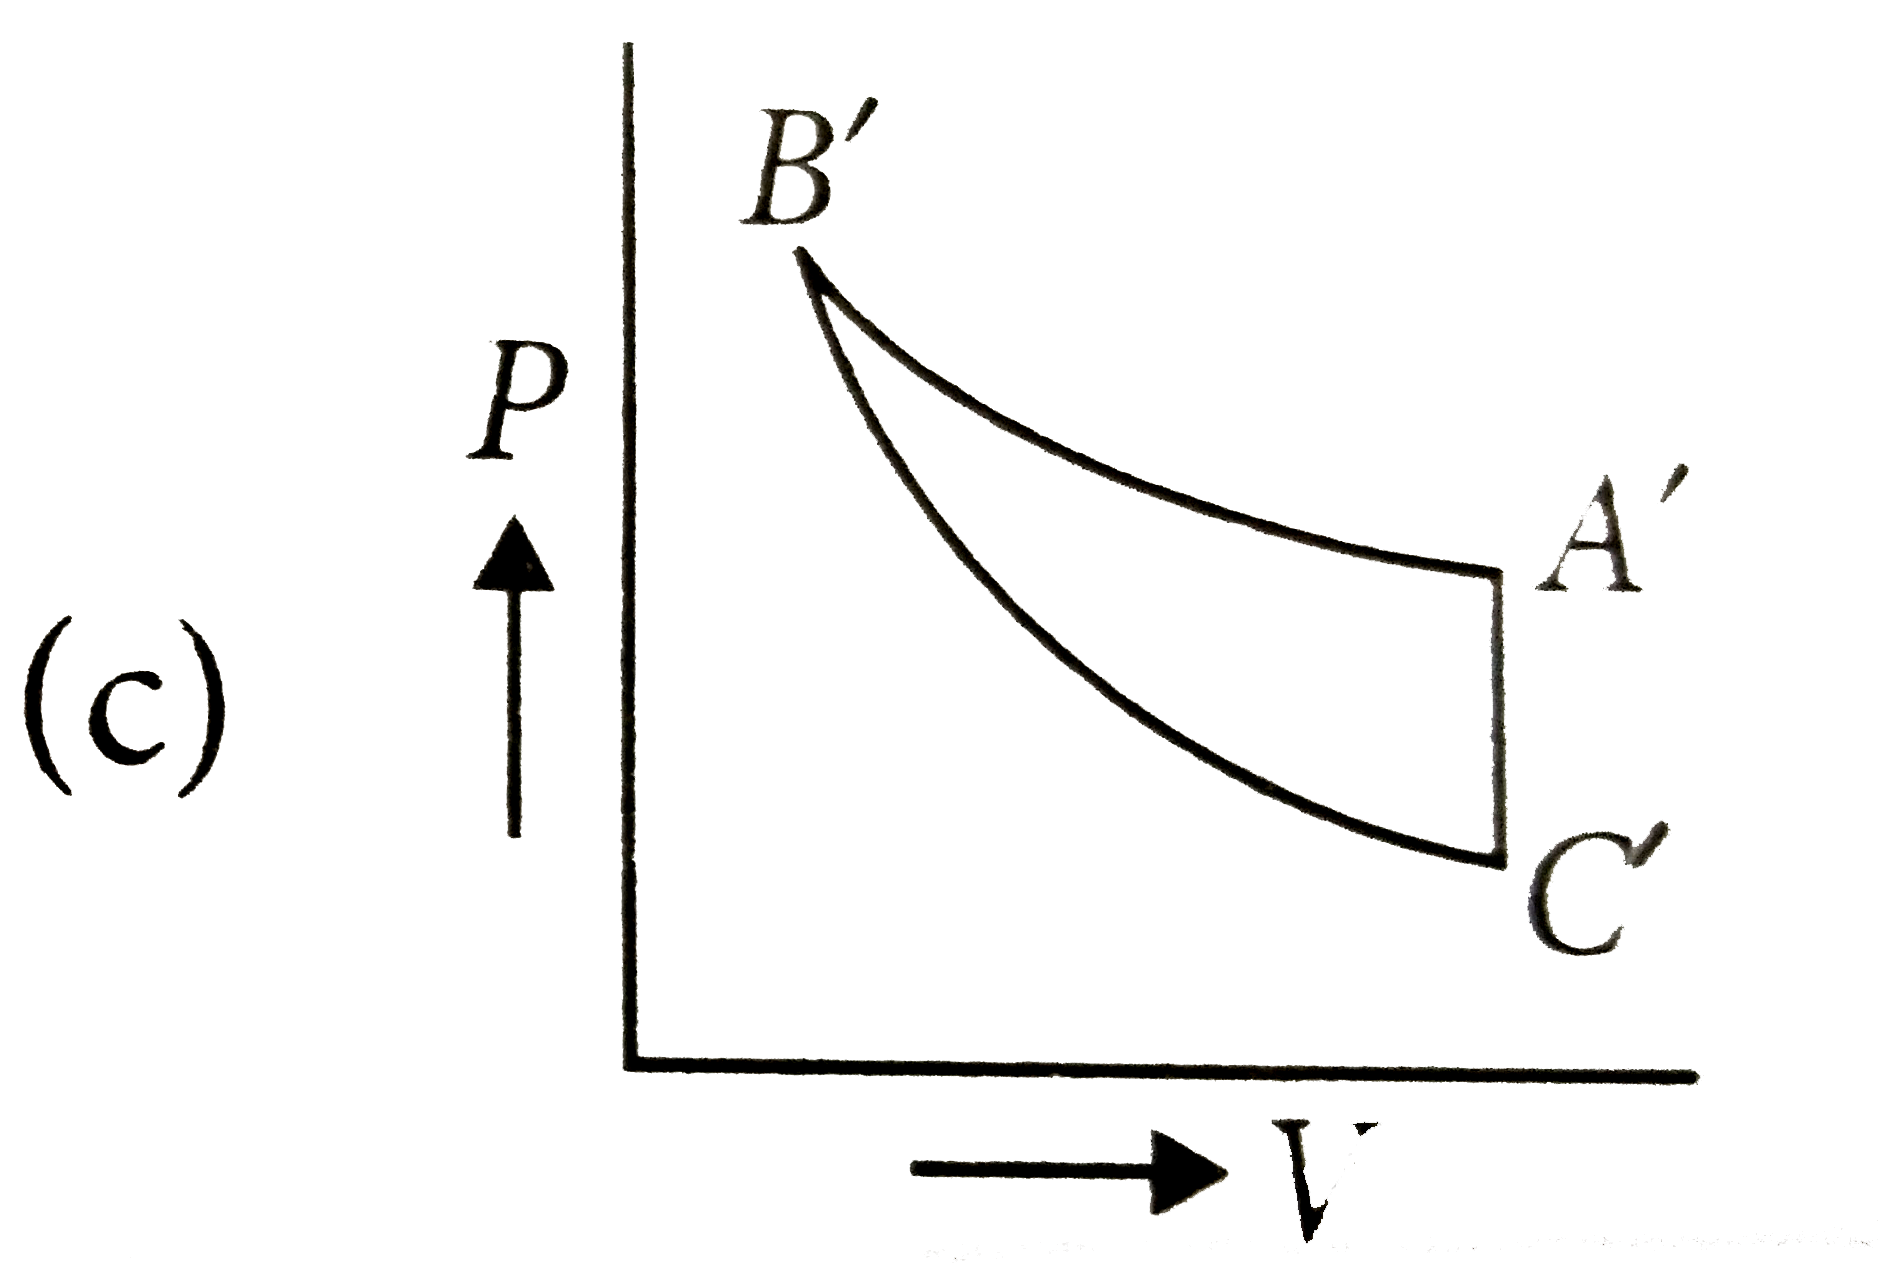 D
D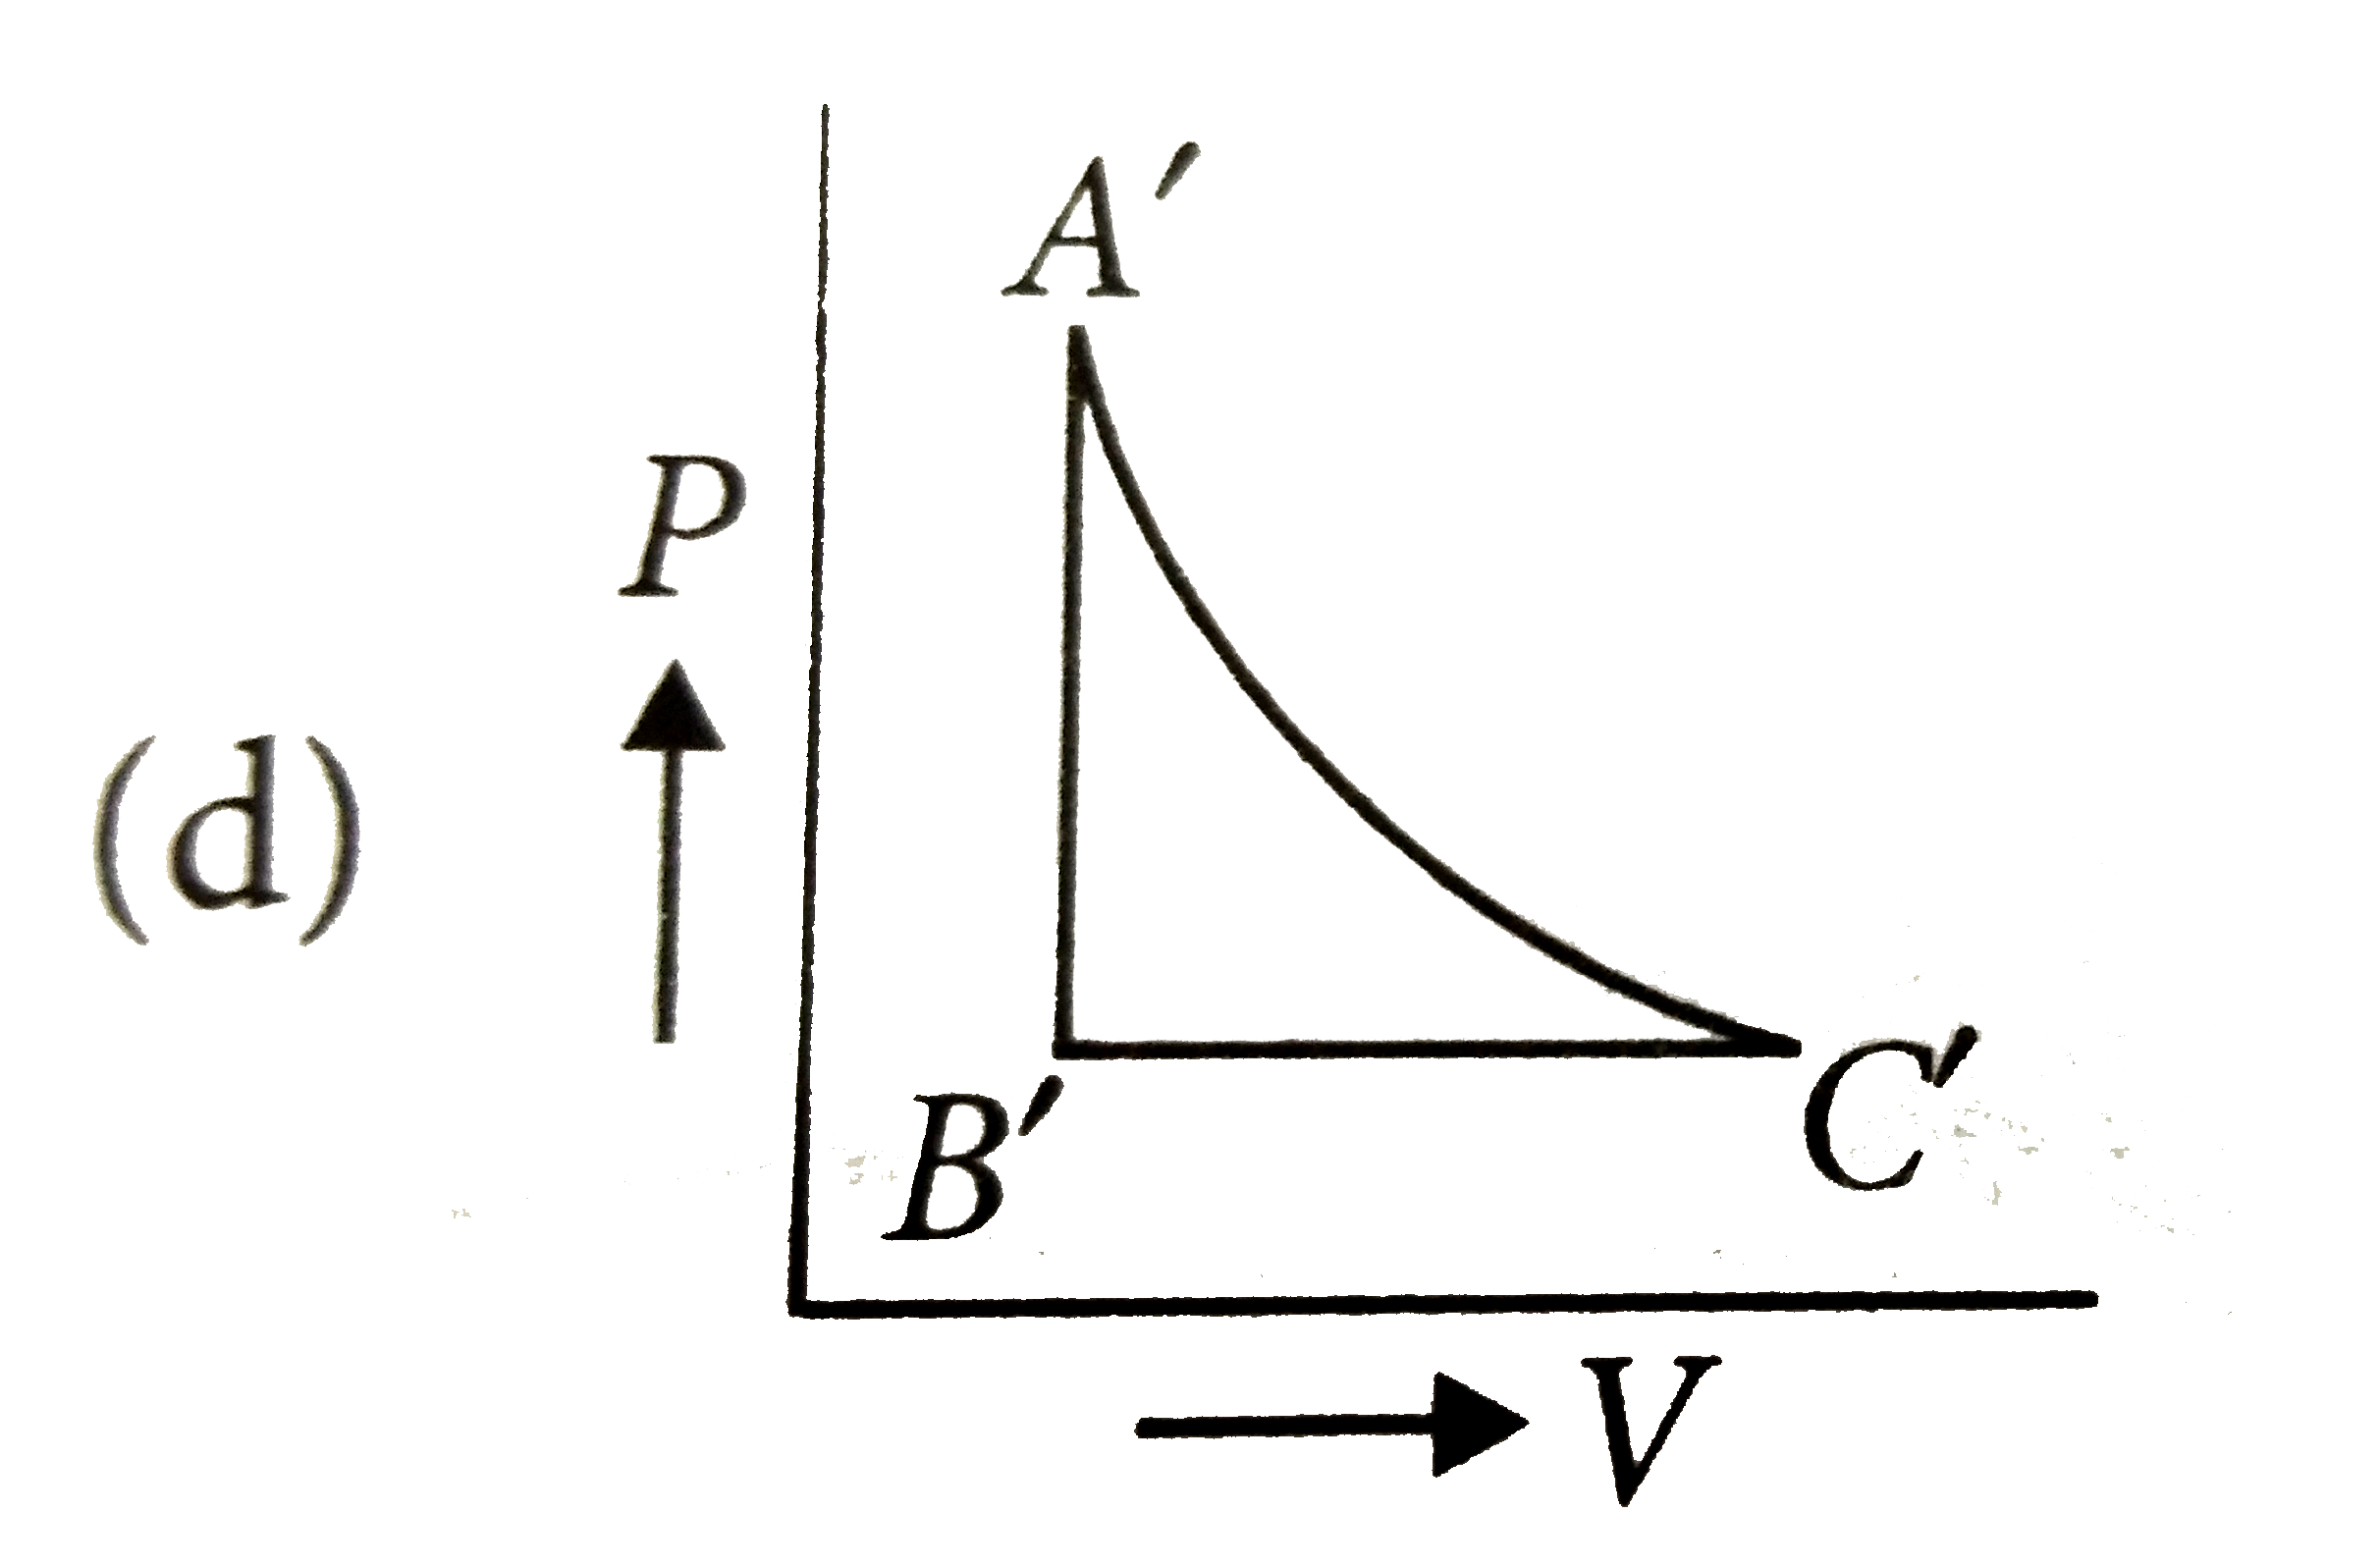
One mole of an ideal gas undergoes a cyclic process ABCDA as shown in the P-V diagram, The net work done in the process is
(1 atm=10^(6) dyne cm^(-2))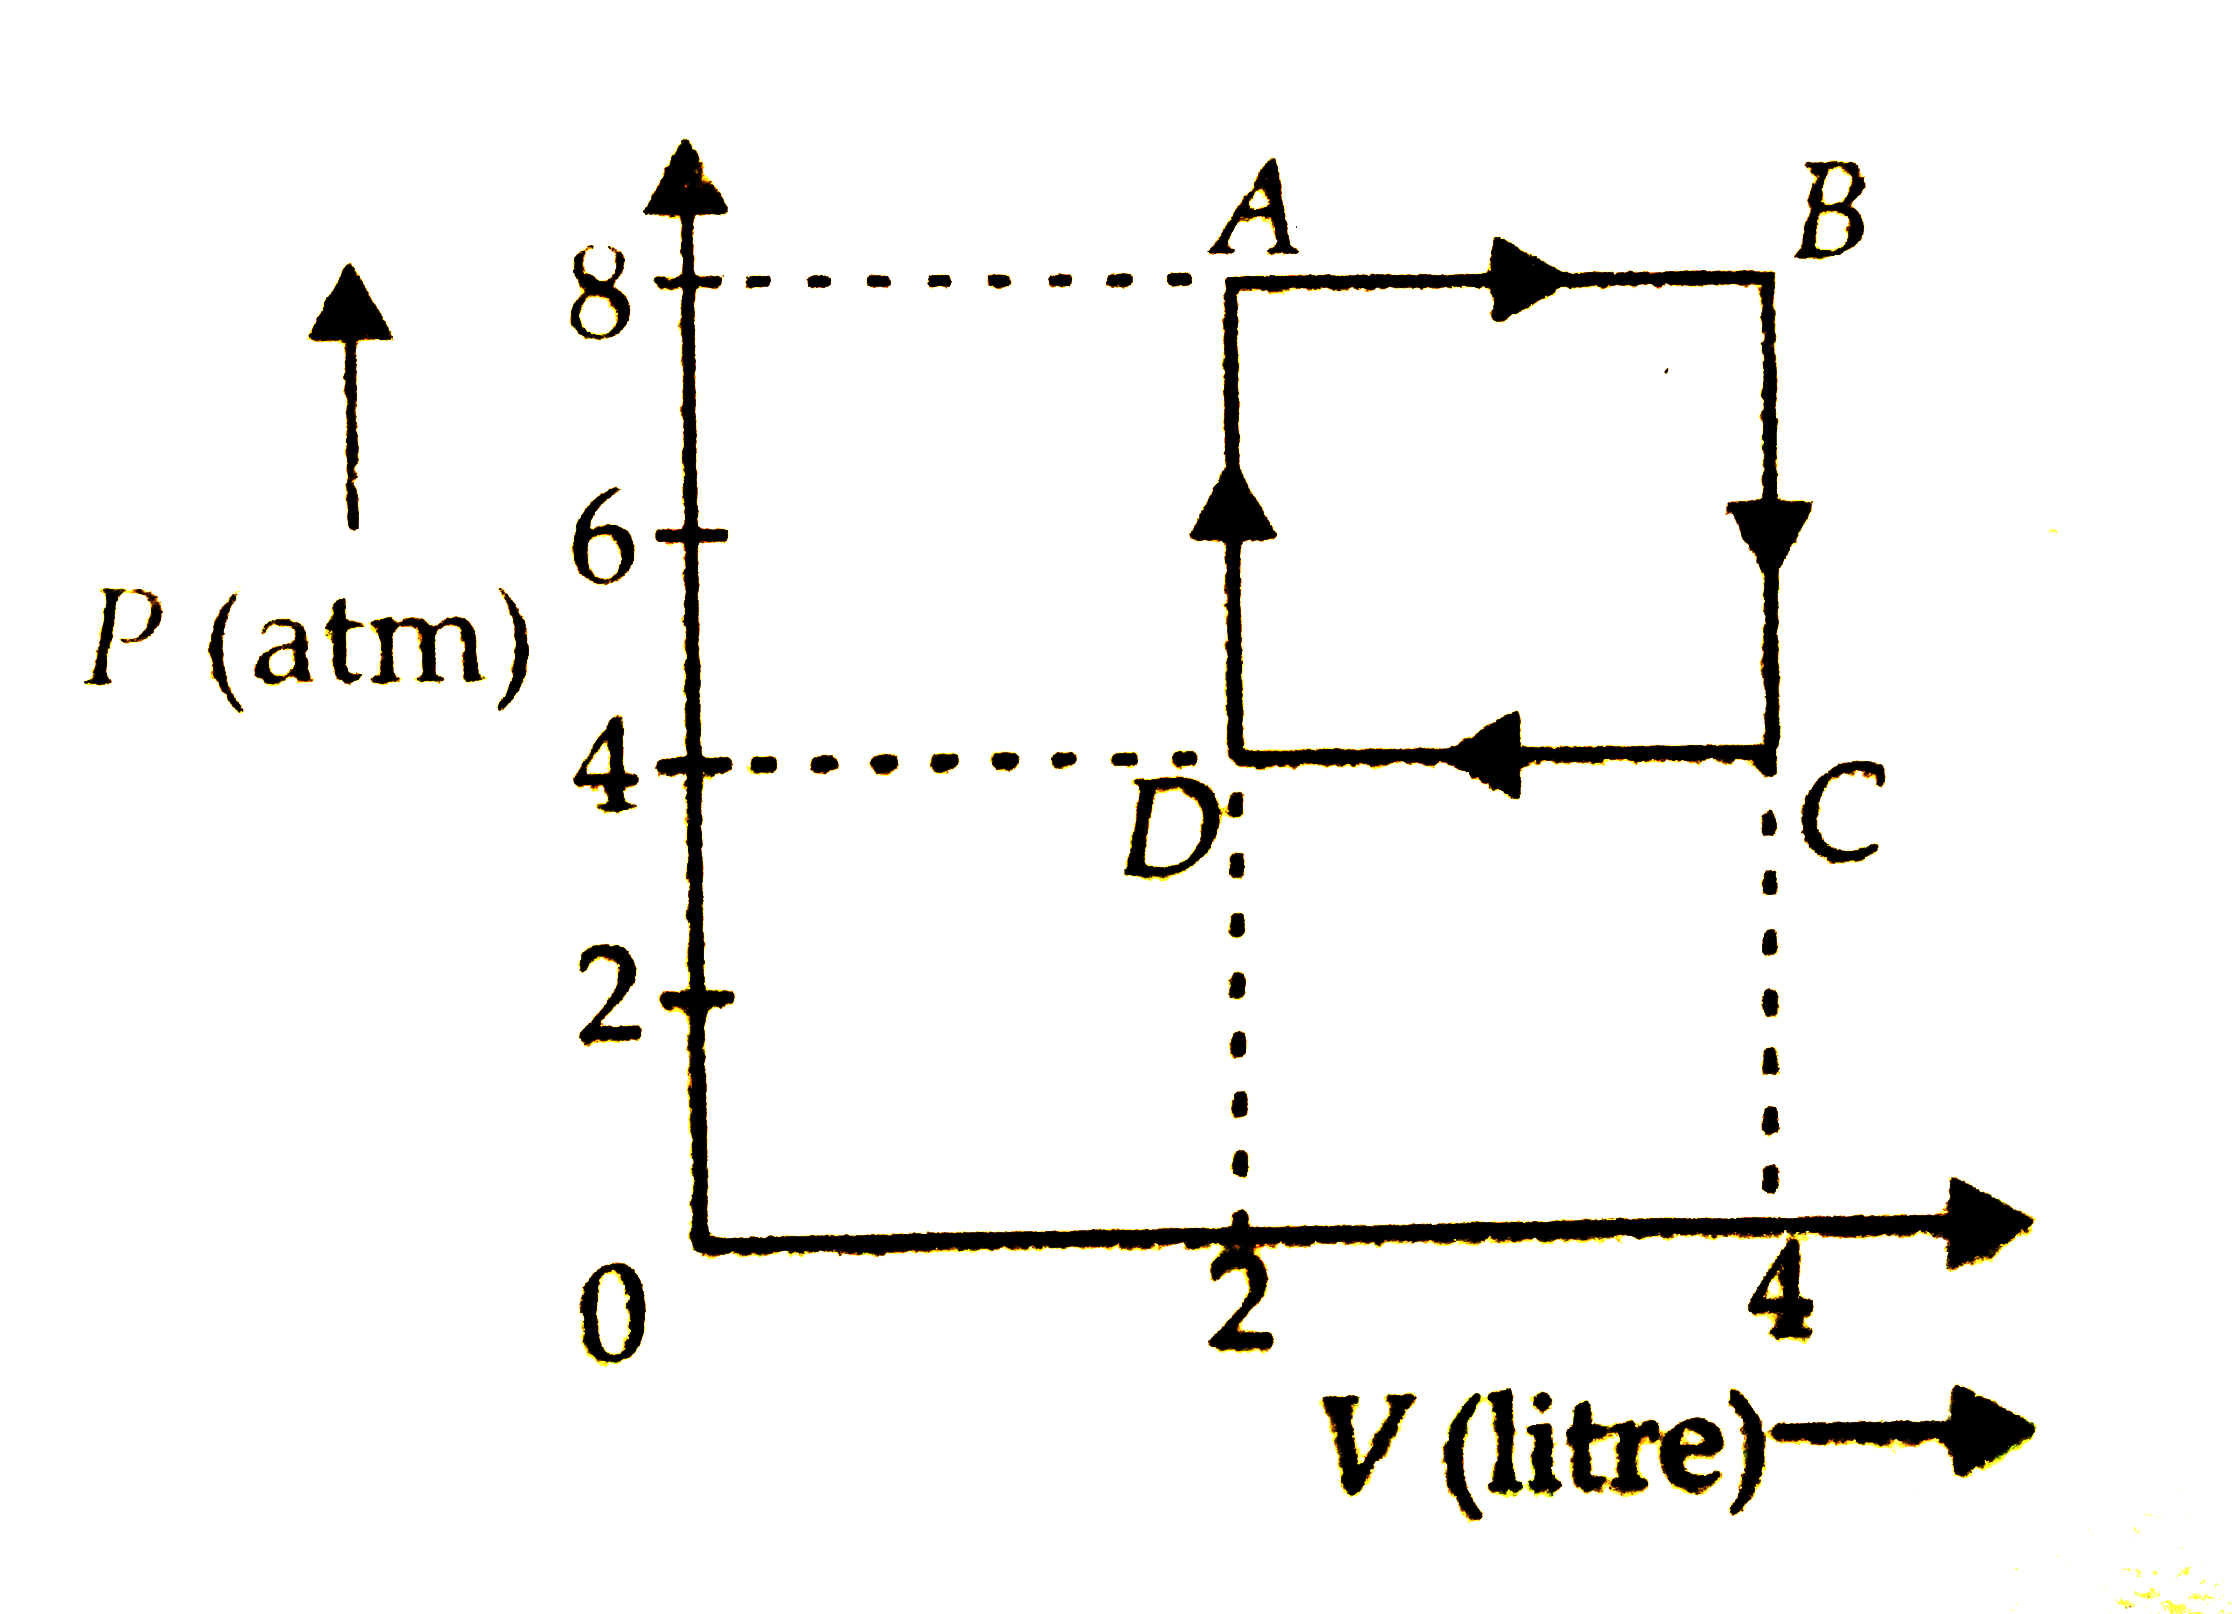 A500 JB700 JC800 JD900 J
P – V graph of an ideal gas is as shown in the diagram . Work done by the gas in the process ABCD is
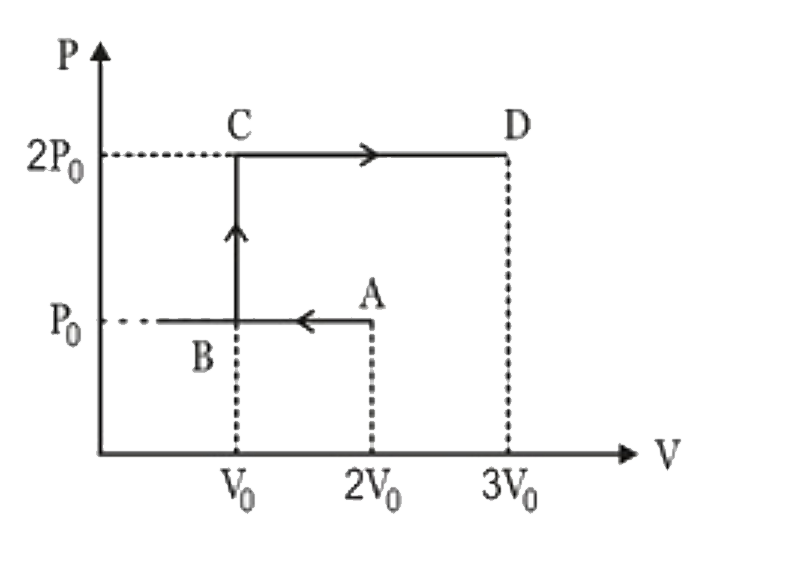
View SolutionAn ideal gas is taken around ABCA as shown in the above P−V diagram. The work done during a cycle is
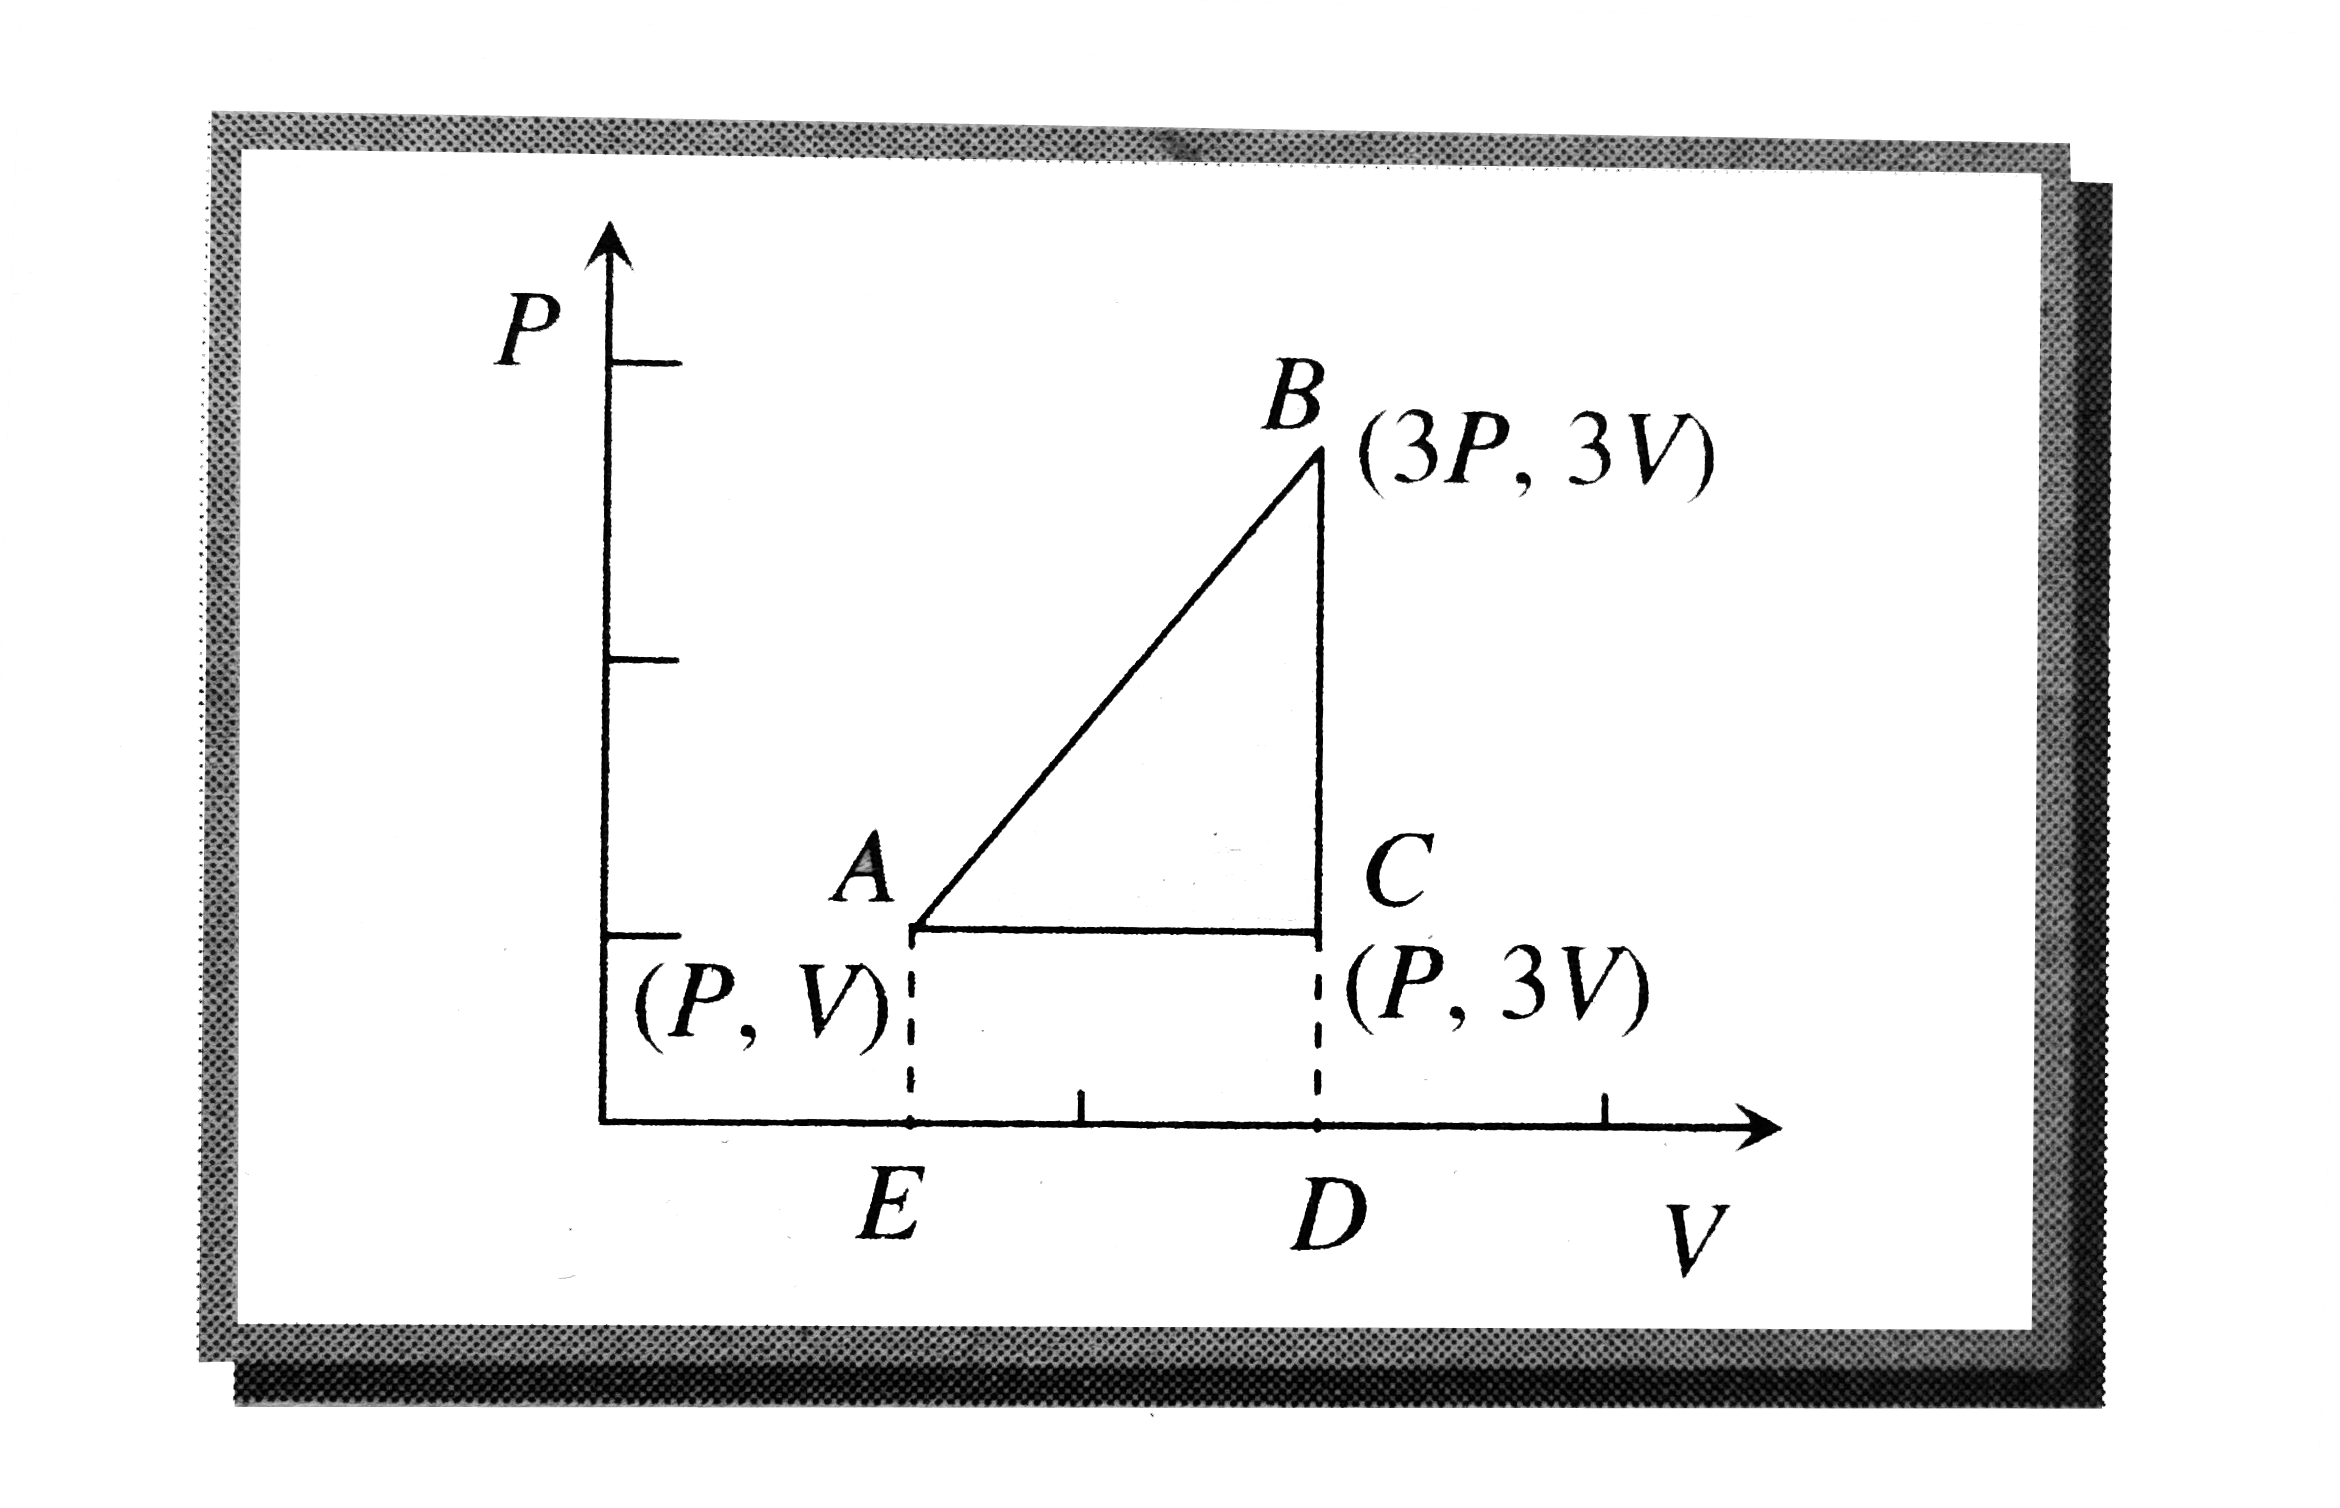
View SolutionA cyclic process ABCA is shown in the V - T diagram . Process on the P – V diagram is
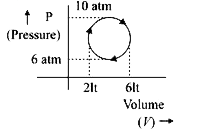
View SolutionAn ideal gas undergoes a cyclic process whose indicator diagram is as shown in the figure. Find the work done by the gas in 1 complete cycle.
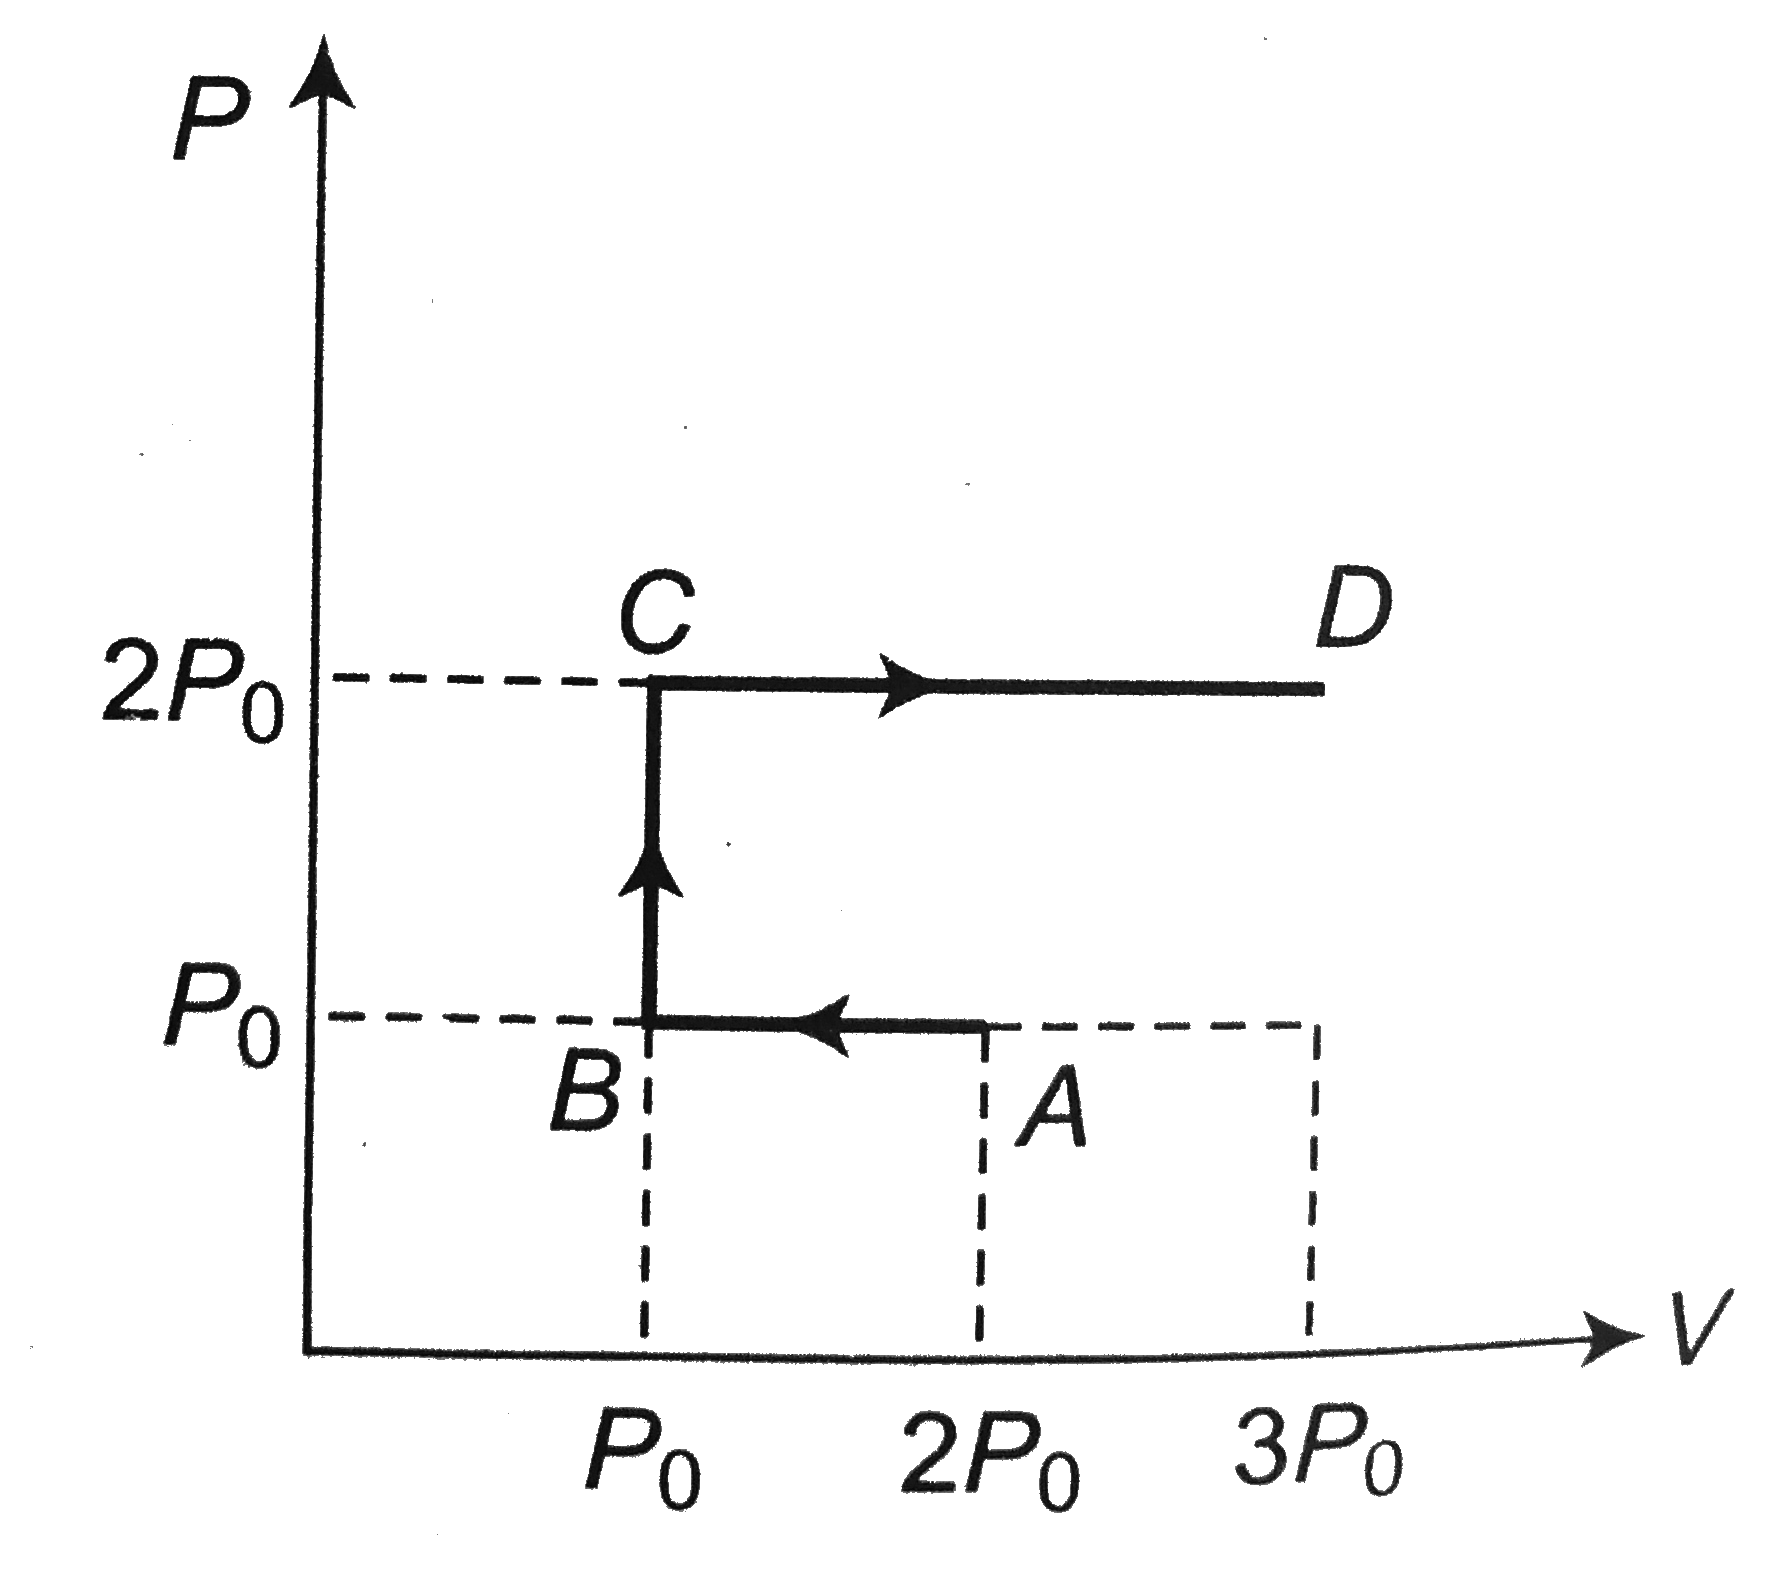
View SolutionP−V diagram of an ideal gas is as shown in figure. Work done by the gas in process ABCD is
View Solution

