In figure the energy levels of the hydrogen atom have been shown along with some transitions marking A,B,C. The trantions A,B, and C respectively represents
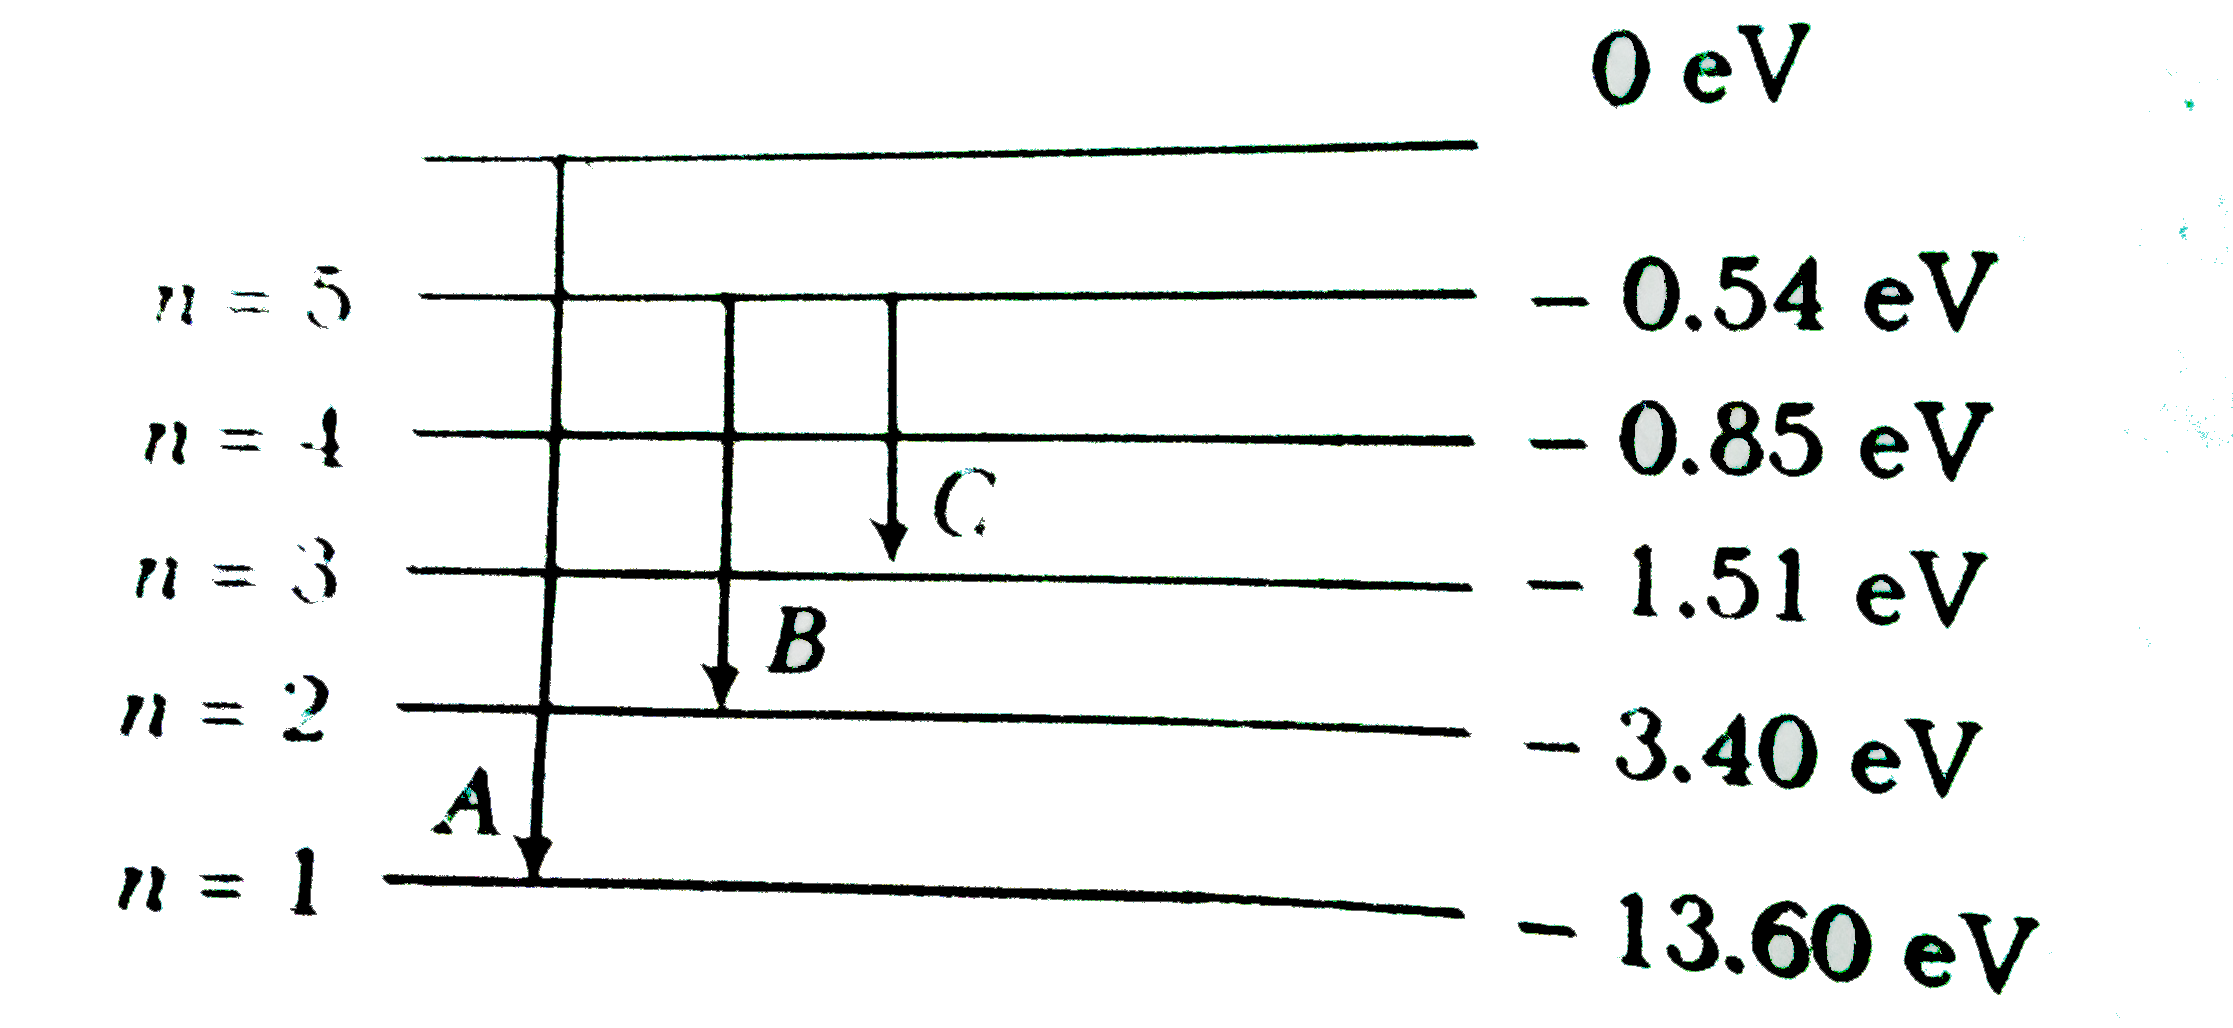
First member of Lyman series, third spectral line of Balmar series and the second spectral line of Paschen series
Ionization potential of hydrogen, second special line of Balmer series and third spectral line of Paschen series
Series limit of Lyman series, third spectral line of Balmer series and second spectral line of Paschen series
Series limit of Lyman series, second spectral line of Balmer series and third spectral line of Paschen series
The correct Answer is:C
Step by step video & image solution for In figure the energy levels of the hydrogen atom have been shown along with some transitions marking A,B,C. The trantions A,B, and C respectively represents by Physics experts to help you in doubts & scoring excellent marks in Class 12 exams.
Updated on:21/07/2023Topper's Solved these Questions
- ATOMIC PHYSICSBOOK - CENGAGE PHYSICS ENGLISHCHAPTER - ATOMIC PHYSICSEXERCISE - ddp.4.3
15 Videos
- ATOMIC PHYSICSBOOK - CENGAGE PHYSICS ENGLISHCHAPTER - ATOMIC PHYSICSEXERCISE - dpp-4.1
15 Videos
- ALTERNATING CURRENTBOOK - CENGAGE PHYSICS ENGLISHCHAPTER - ALTERNATING CURRENTEXERCISE - Single Correct
10 Videos
- CAPACITOR AND CAPACITANCEBOOK - CENGAGE PHYSICS ENGLISHCHAPTER - CAPACITOR AND CAPACITANCEEXERCISE - Integer
5 Videos
Similar Questions
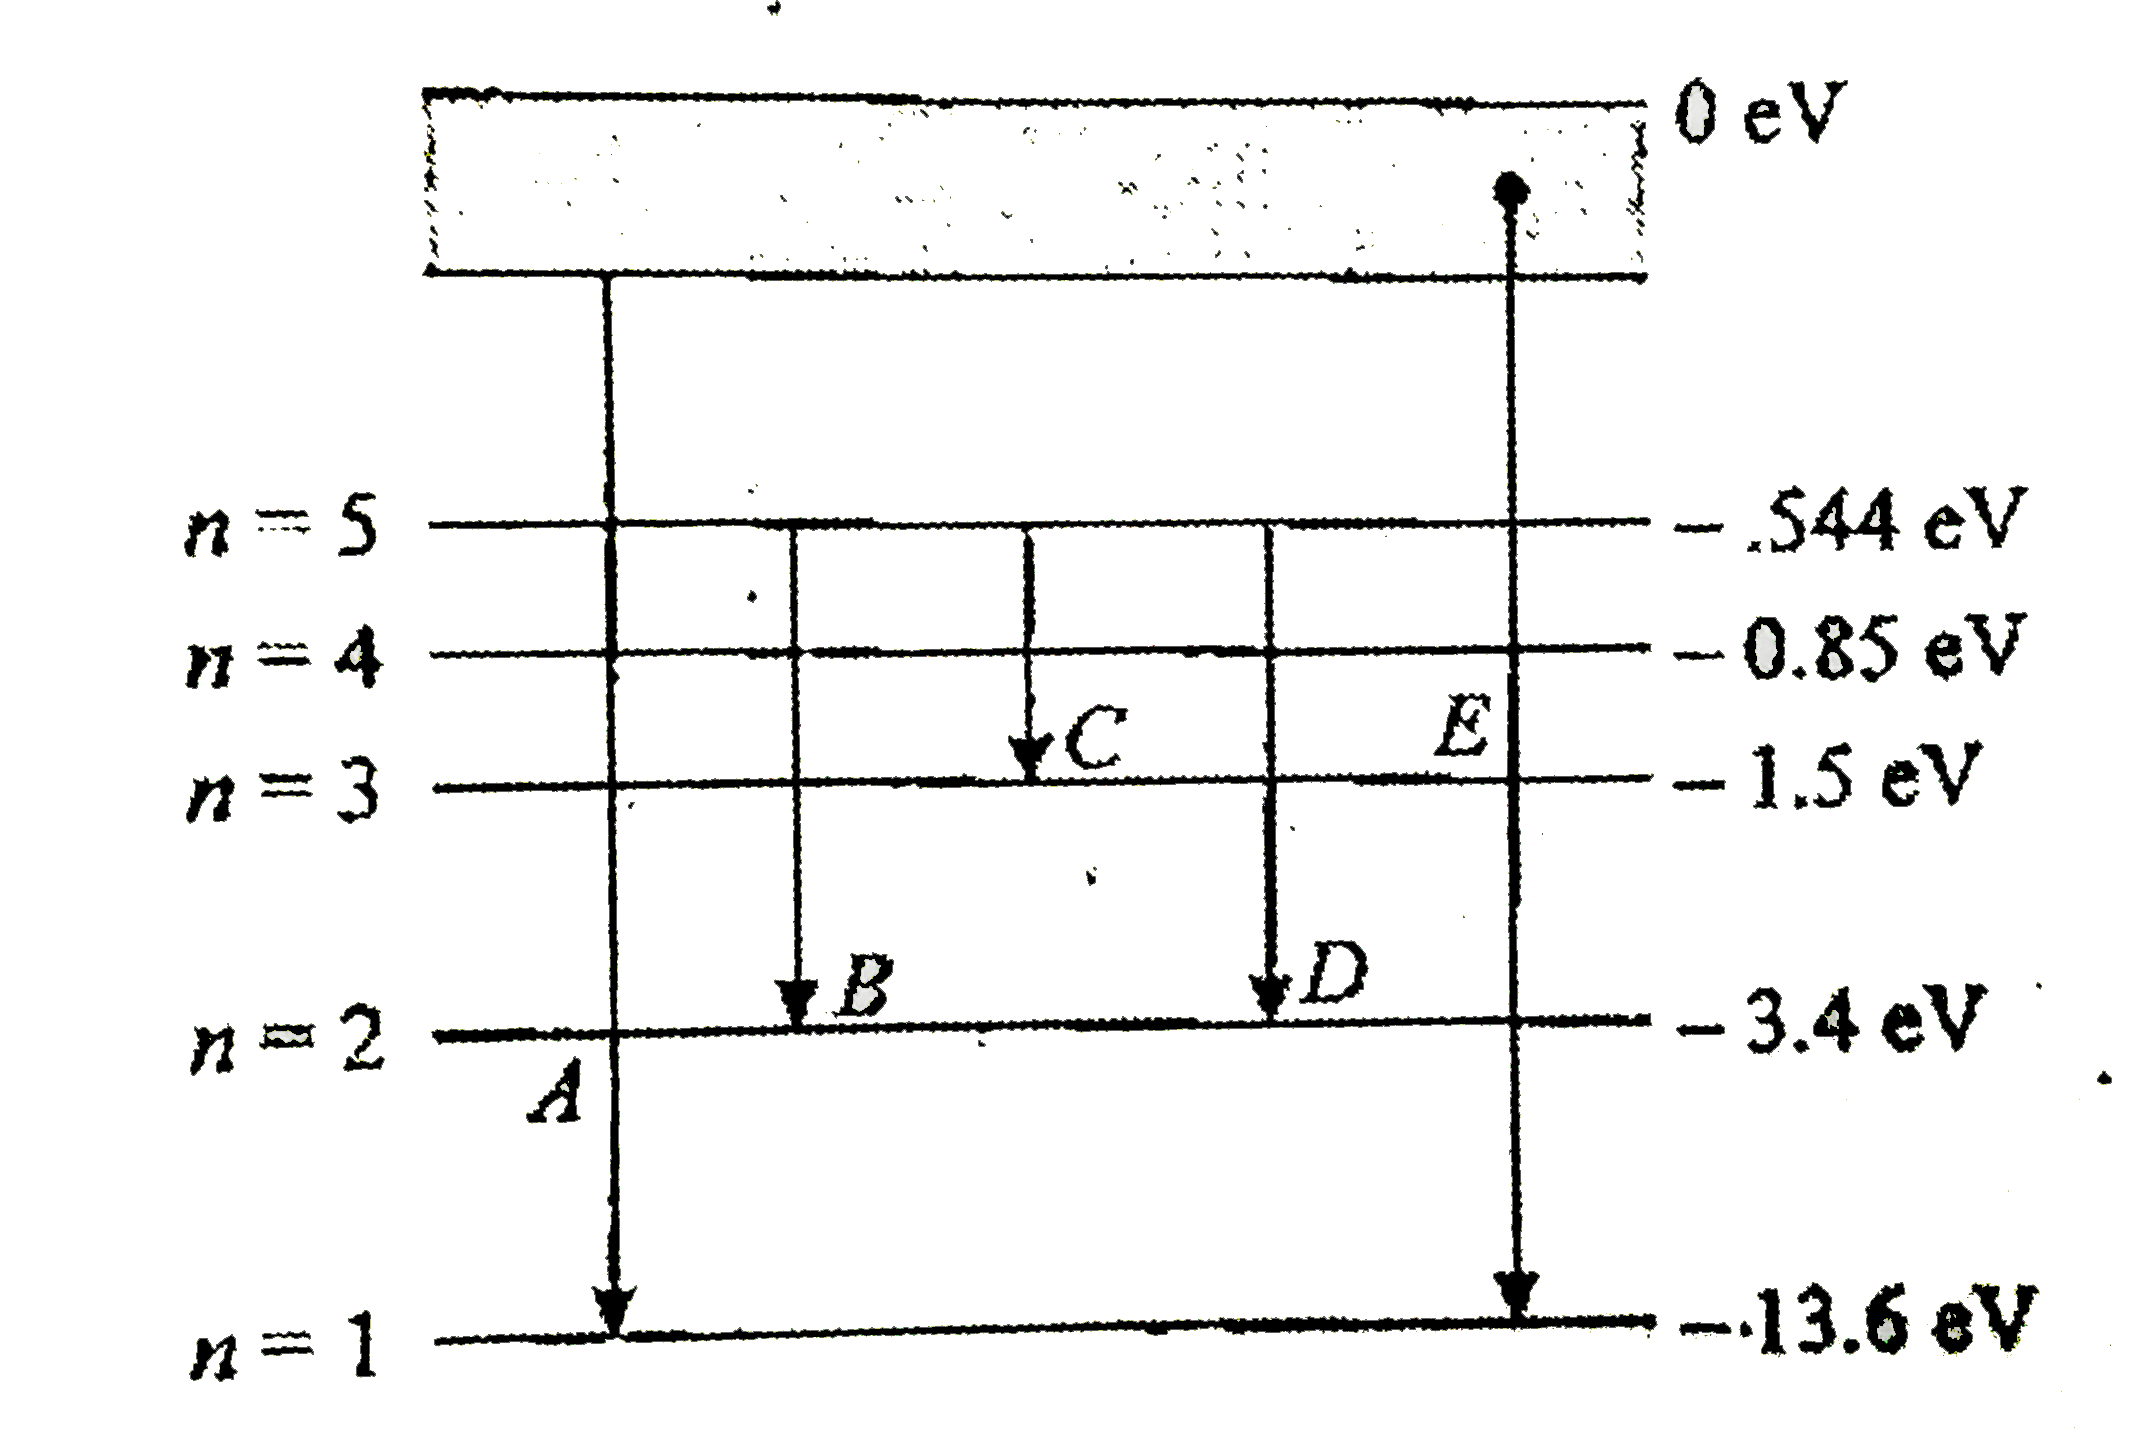
In the following figure the energy levels of hydroge atom have been shown along with some transitions marked A, B,C,D and E.The transitionsy A,B and C respectively represent:
View SolutionThe figure shows an energy level diagram for the hydrogen atom. Several transitions are marked as I, II, III,_____. The diagram is only indicative and not be scale.
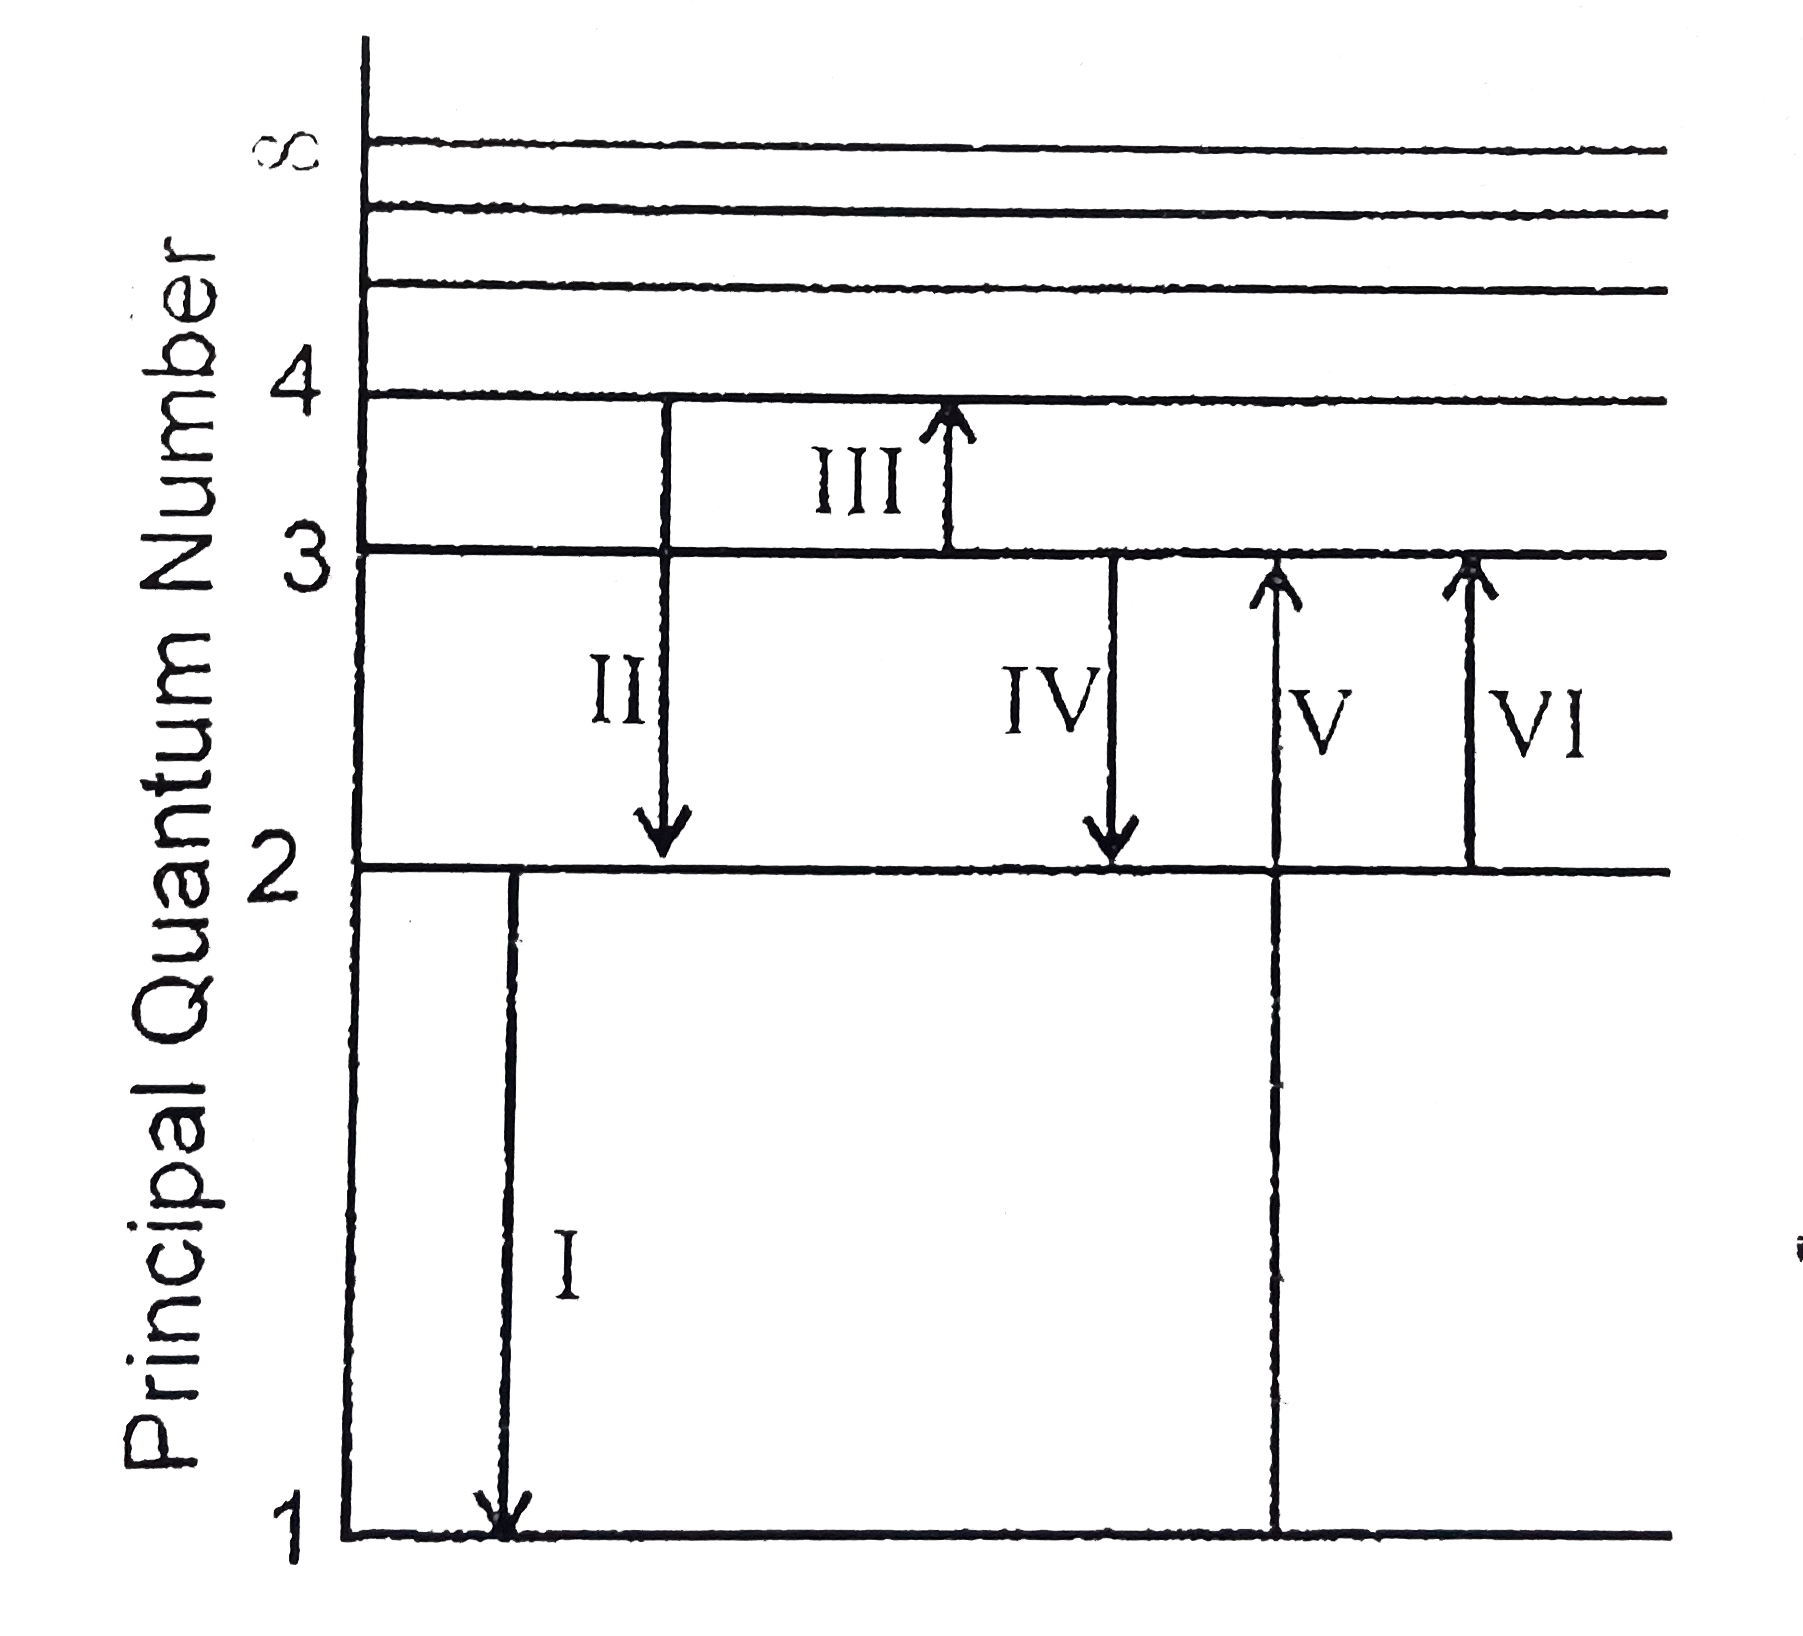
Which transition will occur when a hydrogen atom is irradiated with radiation of wavelength 103nm.
View SolutionThe figure shows an energy level diagram for the hydrogen atom. Several transitions are marked as I, II, III,_____. The diagram is only indicative and not be scale.

Which transition will occur when a hydrogen atom is irradiated with radiation of wavelength 103nm.
View SolutionIn figure E1andE2 represent some of the energy levels of the hydrogen atom.
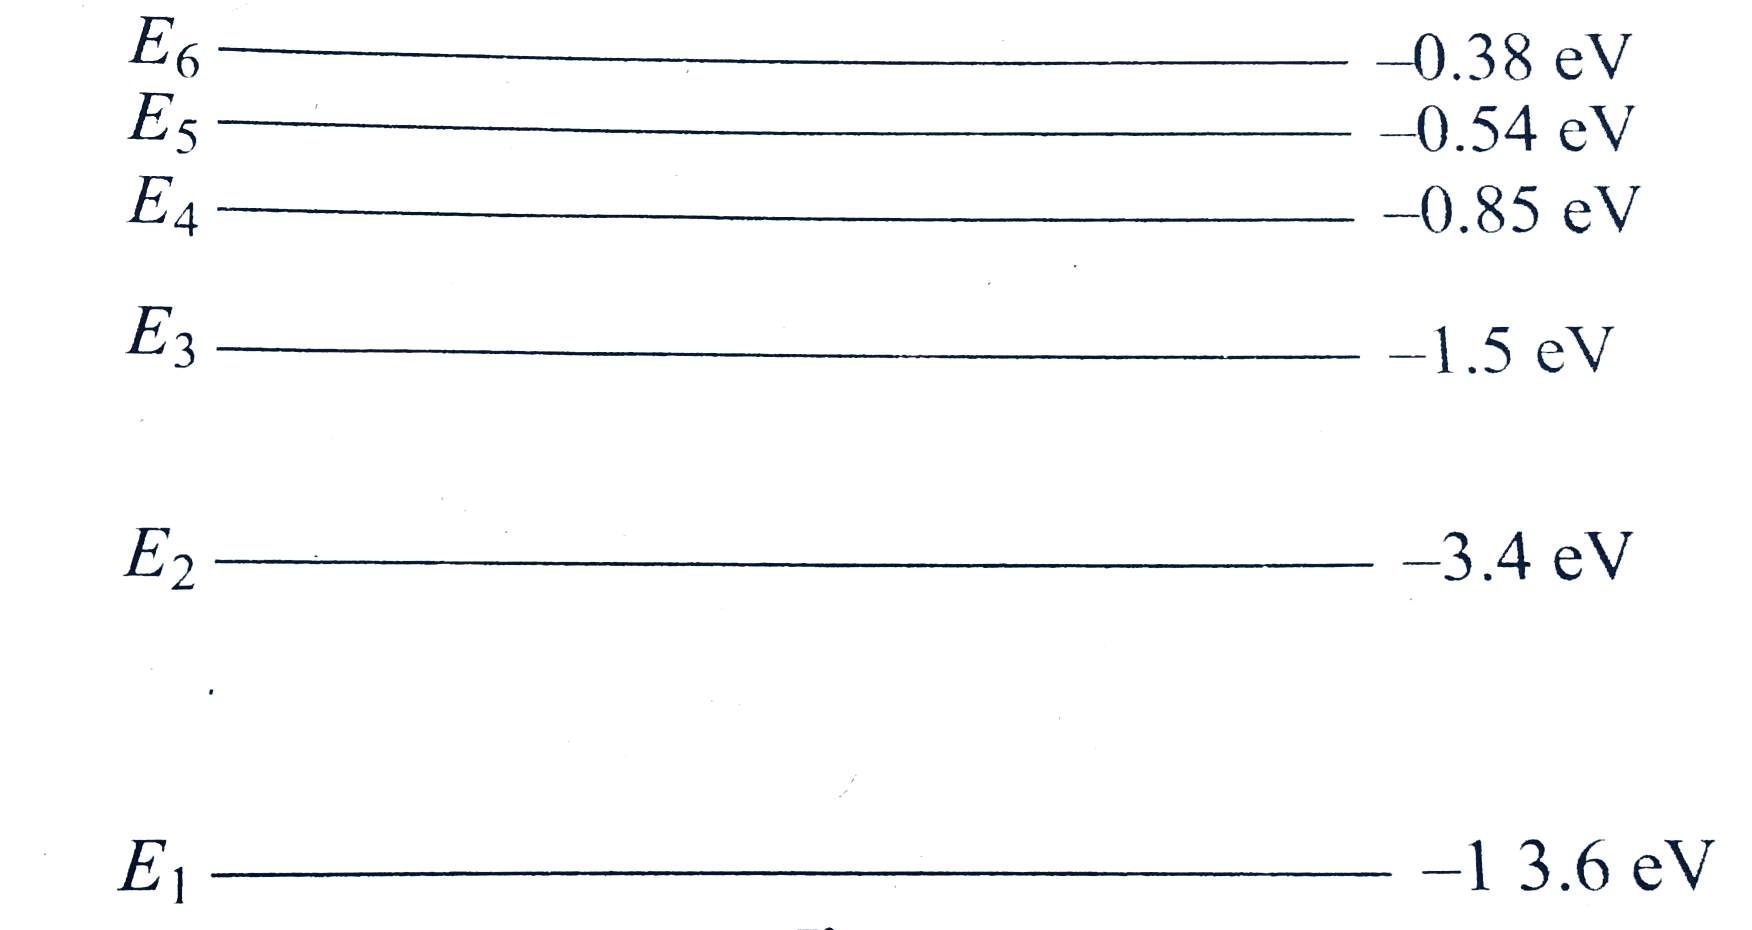
Which one of the following transitions produced a photon of wavelength in the ultraviolet region of the electromagnetic spectrum?
View SolutionThe figure shows an energy level diagram for the hydrogen atom. Several transitions are marked as I, II, III,_____. The diagram is only indicative and not be scale.
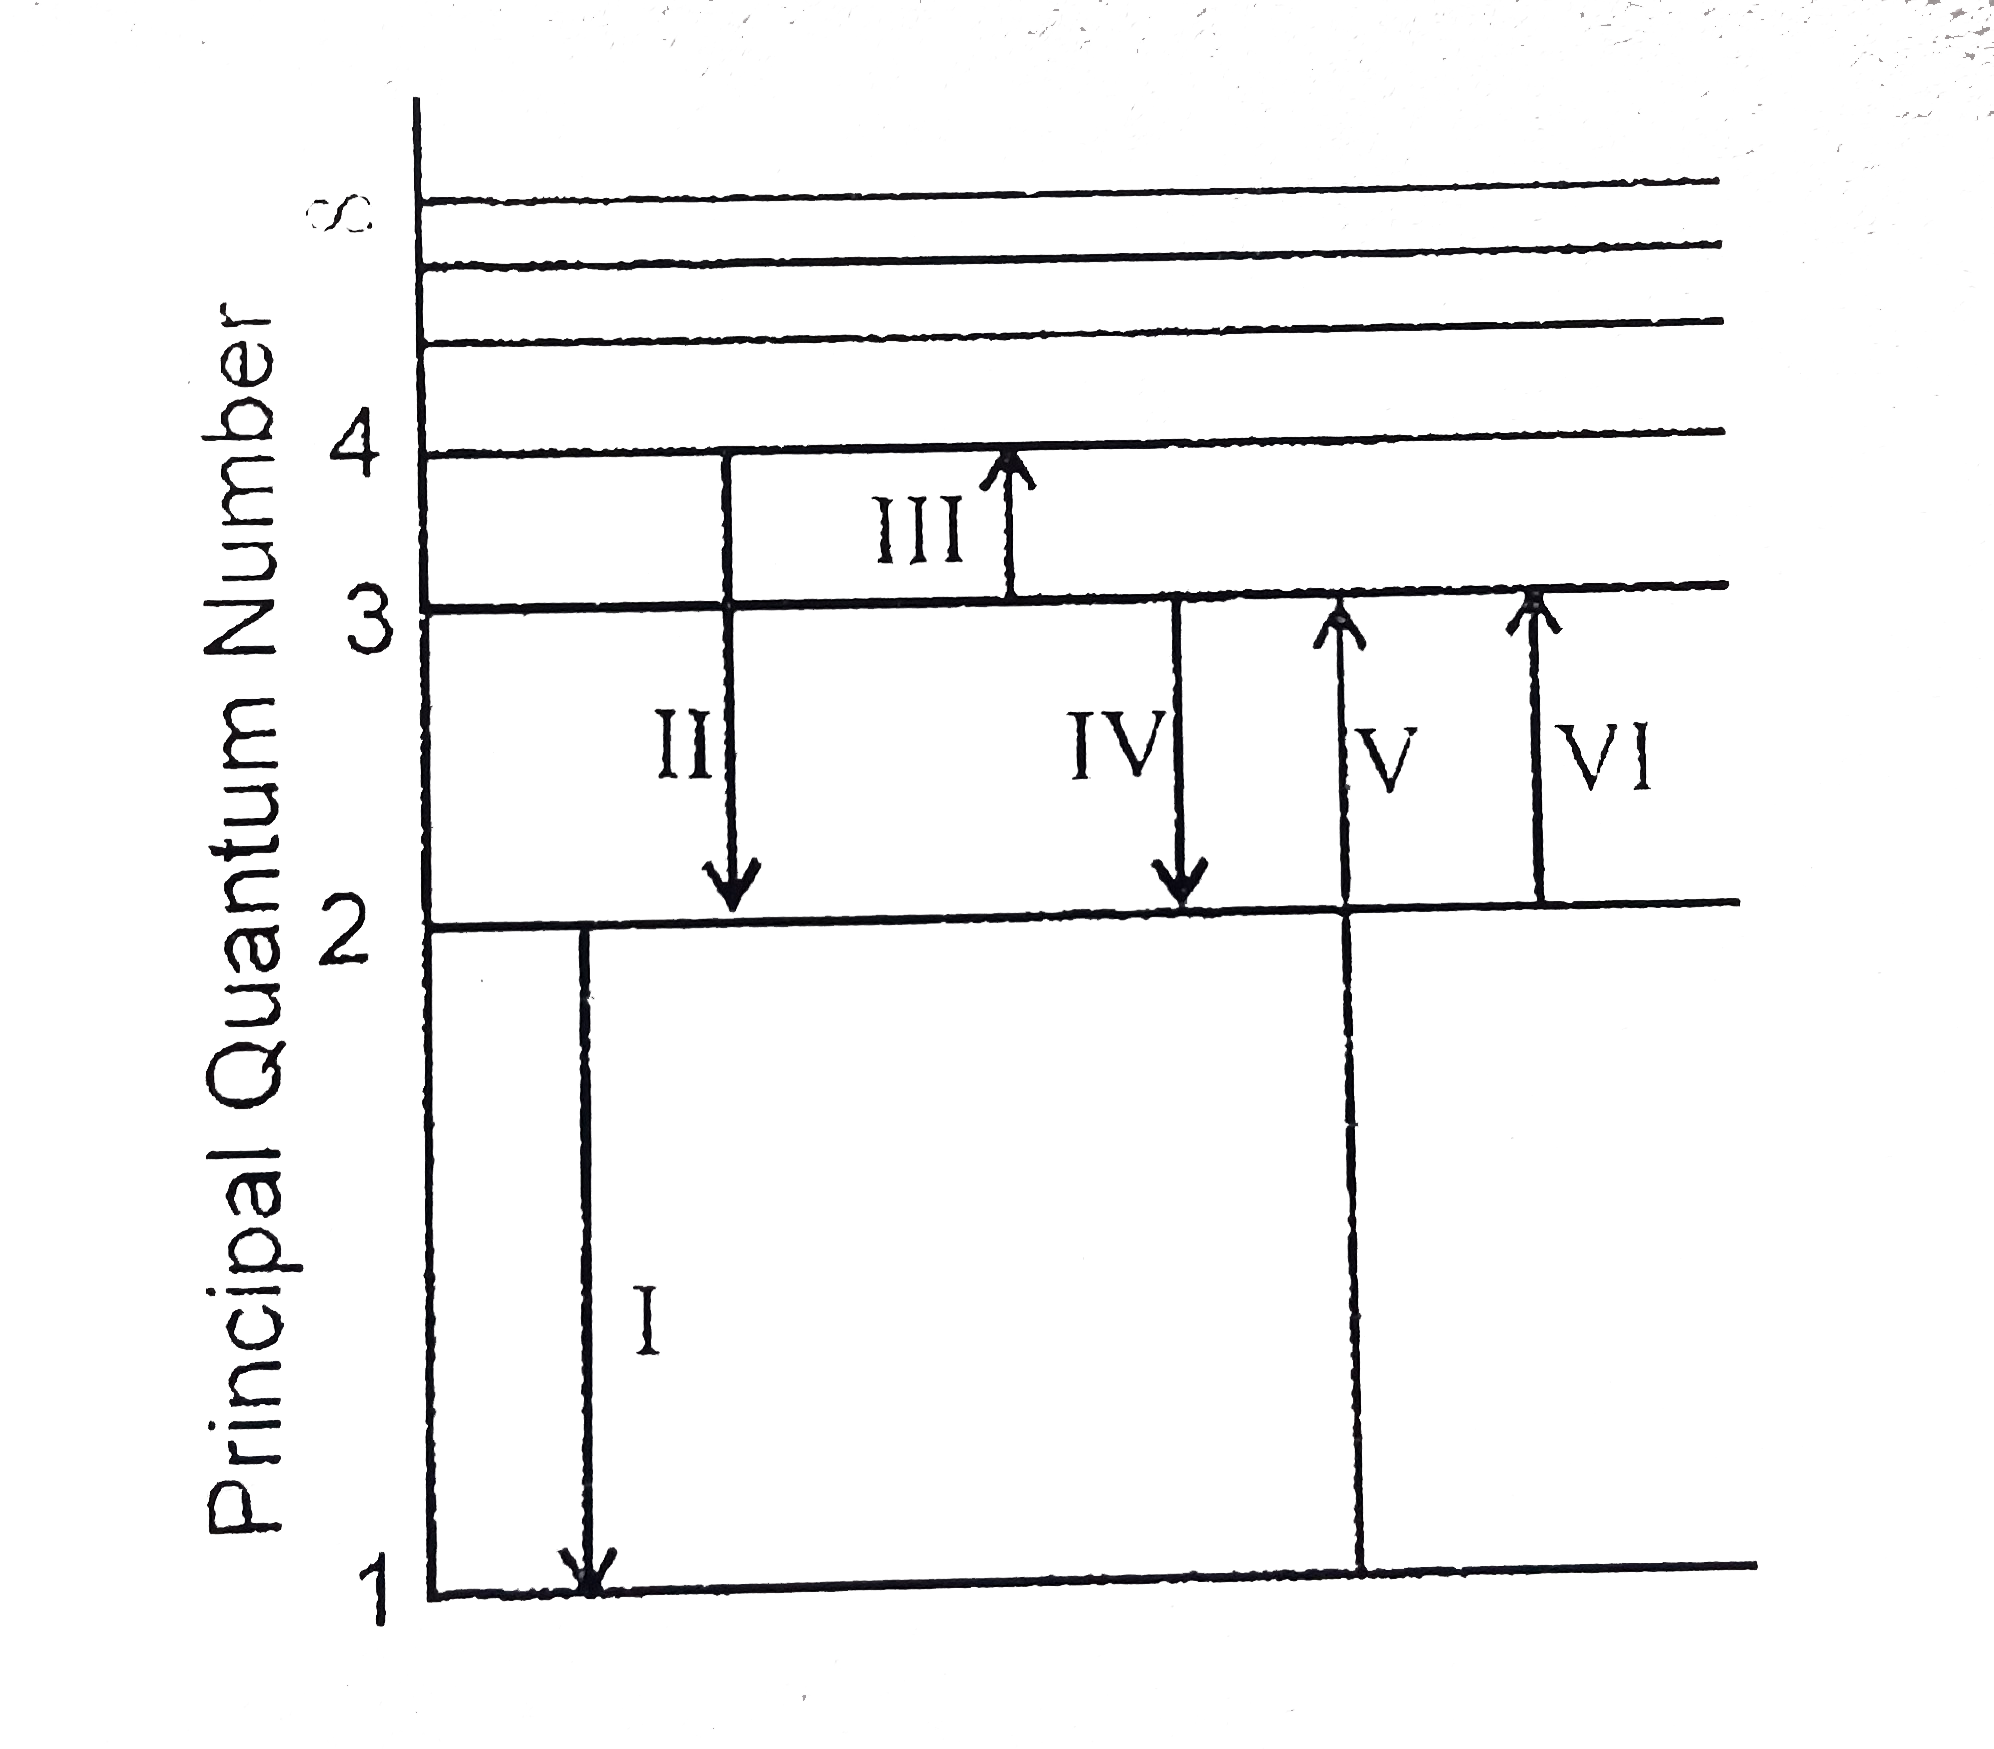
In which transitions is a Balmer photn absorbed?
View SolutionThe energy levels of a hypothetical one electron atom are shown in figure

Find the ionization potential of the atom.
View SolutionThe figure shows an energy level diagram for the hydrogen atom. Several transitions are marked as I,II,III ,______, the diagram is only indicative and not to scale.
_E01_150_Q01.png) .
.
Which transition involves the longest wavelength line in the visible portion of the hydrogen spectrum
View SolutionPertain to the following statement and figure
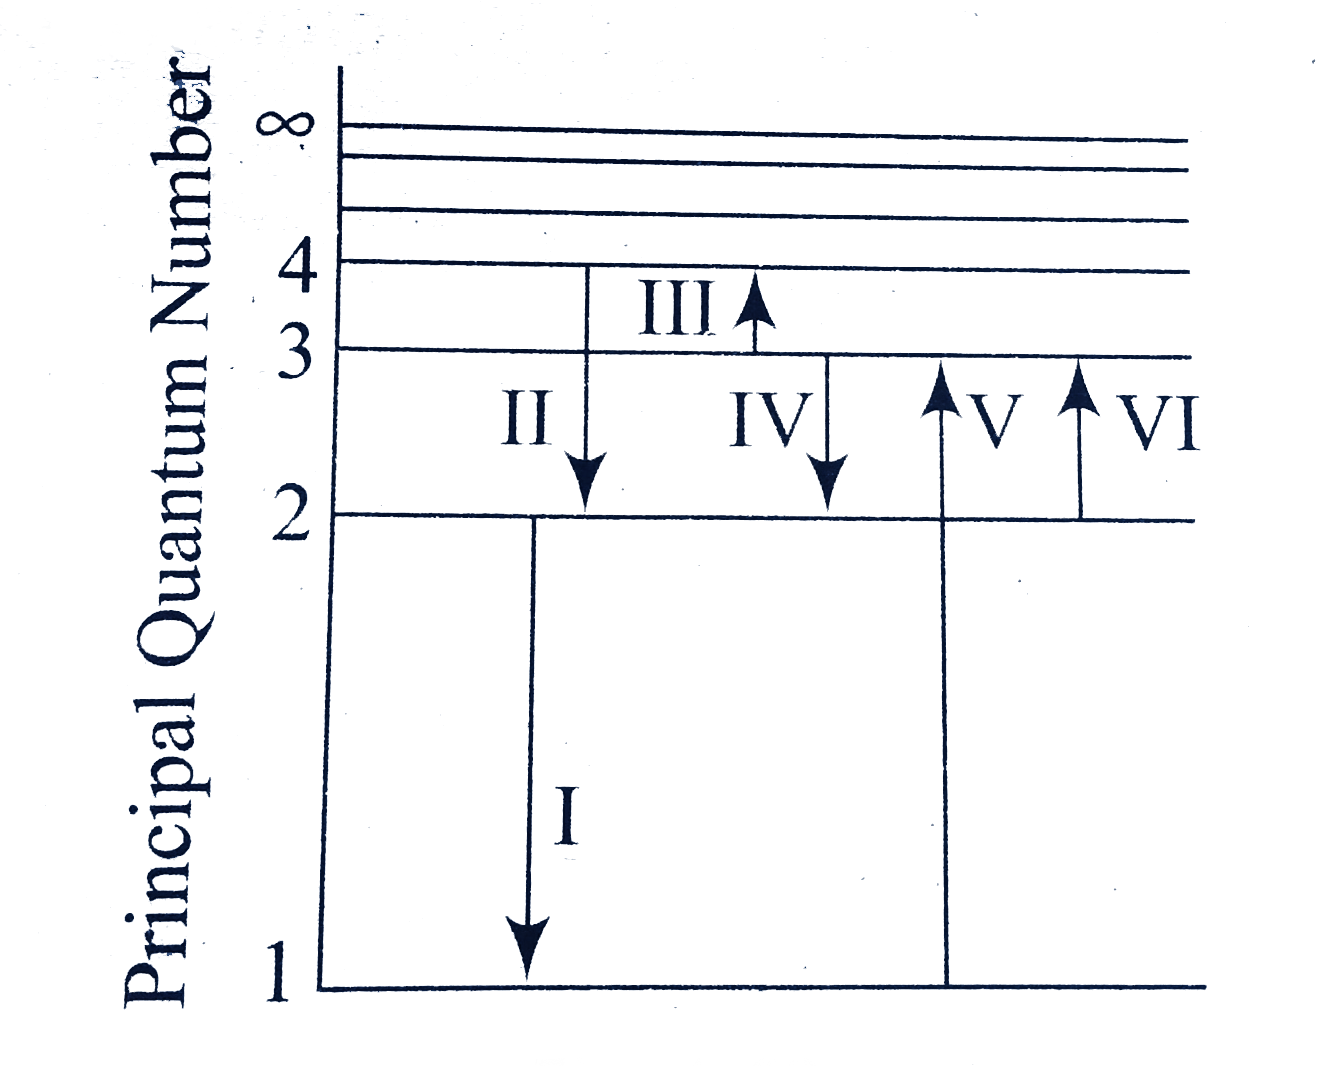
The figure above shown level diagram of the hydrogen atom. Serveral transition are market as I, II, III, … The diagram is only indicative and not to scale.
The wavelength of the radiation involved in transition II is:
View SolutionPertain to the following statement and figure

The figure above shown level diagram of the hydrogen atom. Serveral transition are market as I, II, III, … The diagram is only indicative and not to scale.
The wavelength of the radiation involved in transition II is:
View SolutionPertain to the following statement and figure
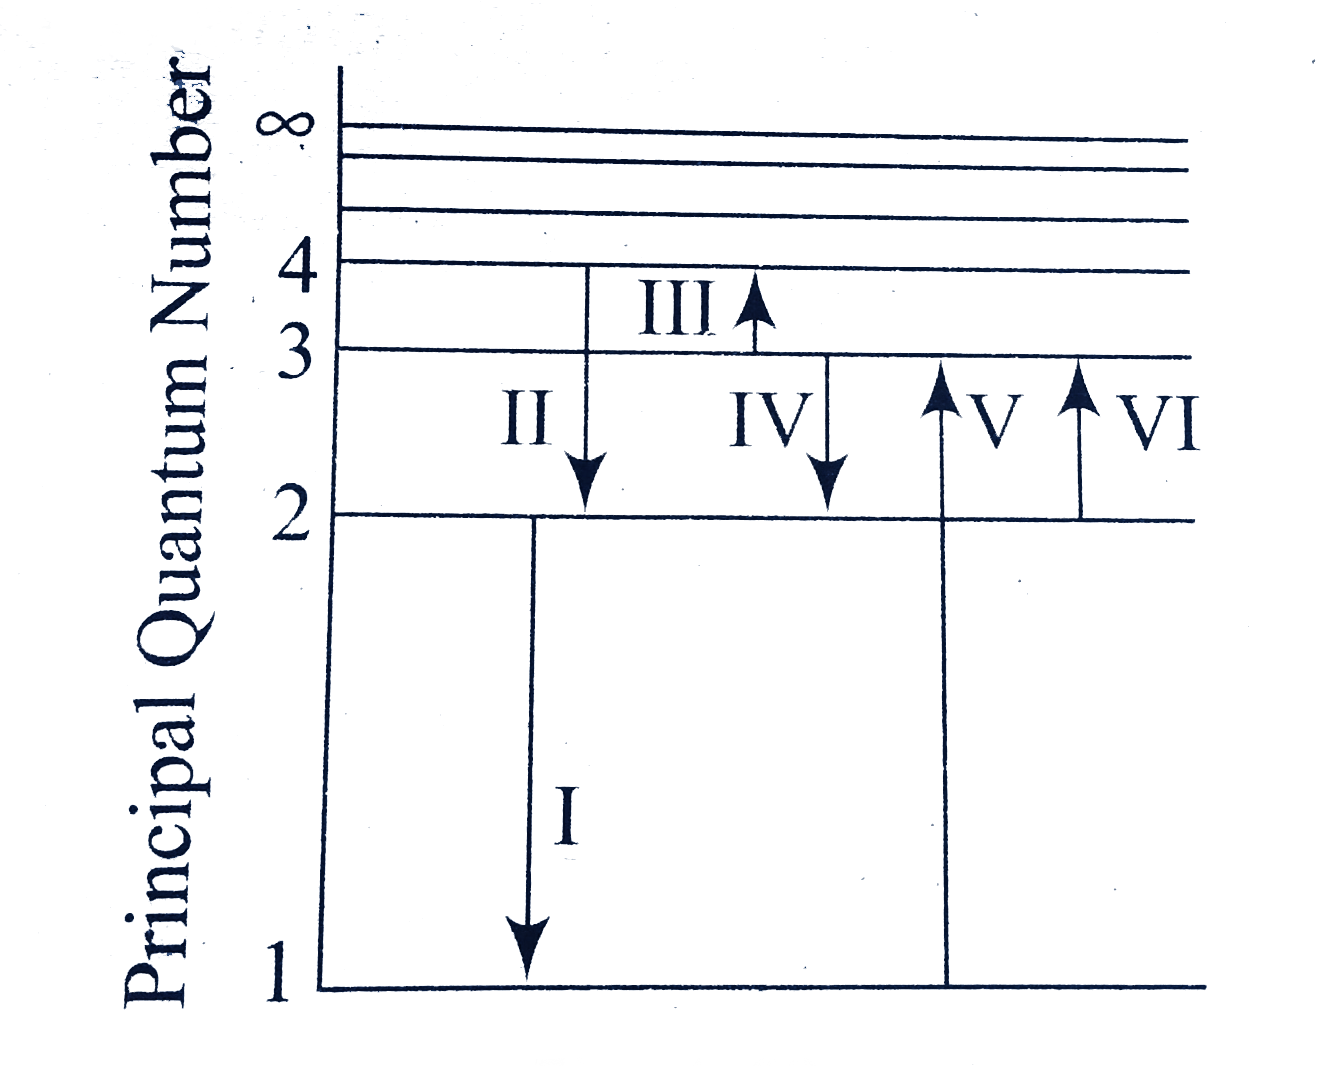
The figure above shown level diagram of the hydrogen atom. Serveral transition are market as I, II, III, … The diagram is only indicative and not to scale.
In which transition ia a Balmer series photon absorbed?
View Solution
