A graph is plotted between logV and logT for 2mol of gas at constant pressure of 0.0821atm. V and T are in litre and K. Which of the following statements are not correct?
(I) The curve is straight line with slope −1.
(II) The curve is straight line with slope +1.
(III) The intercepet on Y−axis is equal to 2.
(IV) The intercepet on Y−axis is equal to 0.3010.
I, II
III, IV
II,IV
I, III
To solve the problem, we need to analyze the relationship between volume (V) and temperature (T) for an ideal gas using the ideal gas law, which is given by:
PV=nRT
Where:
- P = pressure
- V = volume
- n = number of moles
- R = ideal gas constant
- T = temperature in Kelvin
Given that we have 2 moles of gas at a constant pressure of 0.0821 atm, we can rearrange the ideal gas equation to express V in terms of T:
V=nRTP
Substituting the values for n and P:
V=2⋅R⋅T0.0821
Next, we take the logarithm of both sides to plot logV against logT:
logV=log(2RTP)
Using properties of logarithms, we can separate this into:
logV=log(2)+log(R)+log(T)−log(P)
This can be rearranged to:
logV=log(T)+(log(2)+log(R)−log(P))
This equation resembles the linear form y=mx+c, where:
- y=logV
- x=logT
- m=1 (the slope)
- c=log(2R/P) (the intercept)
1. Identify the relationship: From the ideal gas law, we have V=nRTP.
2. Take logarithms: Taking the logarithm gives us logV=log(nR)+logT−logP.
3. Rearrange the equation: This can be rearranged to logV=logT+constant.
4. Determine the slope: The slope m is +1, indicating that the graph of logV vs. logT is a straight line with slope +1.
5. Calculate the intercept: The intercept c is equal to log(nR/P). Substituting n=2 and P=0.0821, we find c=log(2×R/0.0821).
6. Evaluate the intercept: The value of R is approximately 0.0821 L·atm/(K·mol), leading to c≈log(2)≈0.3010.
Conclusion:
- Statement I (slope -1) is incorrect.
- Statement II (slope +1) is correct.
- Statement III (intercept = 2) is incorrect.
- Statement IV (intercept = 0.3010) is correct.
Thus, the statements that are not correct are I and III.
- P = pressure
- V = volume
- n = number of moles
- R = ideal gas constant
- T = temperature in Kelvin
- y=logV
- x=logT
- m=1 (the slope)
- c=log(2R/P) (the intercept)
2. Take logarithms: Taking the logarithm gives us logV=log(nR)+logT−logP.
3. Rearrange the equation: This can be rearranged to logV=logT+constant.
4. Determine the slope: The slope m is +1, indicating that the graph of logV vs. logT is a straight line with slope +1.
5. Calculate the intercept: The intercept c is equal to log(nR/P). Substituting n=2 and P=0.0821, we find c=log(2×R/0.0821).
6. Evaluate the intercept: The value of R is approximately 0.0821 L·atm/(K·mol), leading to c≈log(2)≈0.3010.
- Statement I (slope -1) is incorrect.
- Statement II (slope +1) is correct.
- Statement III (intercept = 2) is incorrect.
- Statement IV (intercept = 0.3010) is correct.
Topper's Solved these Questions
- STATES OF MATTERBOOK - CENGAGE CHEMISTRY ENGLISHCHAPTER - STATES OF MATTEREXERCISE - Exercises (Assertion-Reasoning)
24 Videos
- STATES OF MATTERBOOK - CENGAGE CHEMISTRY ENGLISHCHAPTER - STATES OF MATTEREXERCISE - Exercises (Integer)
10 Videos
- STATES OF MATTERBOOK - CENGAGE CHEMISTRY ENGLISHCHAPTER - STATES OF MATTEREXERCISE - Exercises (Multiple Correcttype)
32 Videos
- SOME BASIC CONCEPTS AND MOLE CONCEPTBOOK - CENGAGE CHEMISTRY ENGLISHCHAPTER - SOME BASIC CONCEPTS AND MOLE CONCEPTEXERCISE - Archives Subjective
11 Videos
- STOICHIOMETRYBOOK - CENGAGE CHEMISTRY ENGLISHCHAPTER - STOICHIOMETRYEXERCISE - Archives Subjective
33 Videos
Similar Questions
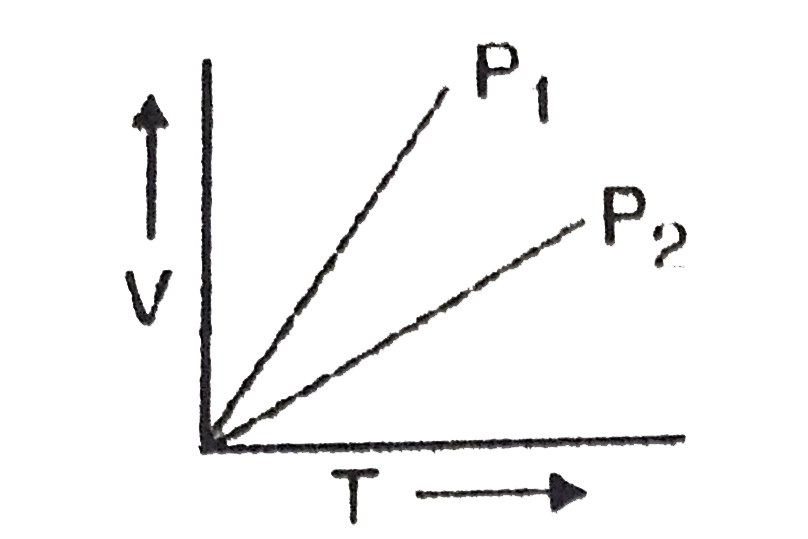
V vs T curves at constant pressure P1 and P2 for an ideal gas are shown in the figure. Which of the following is correct?

View SolutionWhich of the plots of ln K vs (1T) is/are correct?
View SolutionWhat is the type of graph that would result between log(V) and log(T) at constant pressure?
View SolutionIf a graph is plotted between log(a−x) and t, the slope of the straight line is equal to −0.03. The specific reaction rate will be
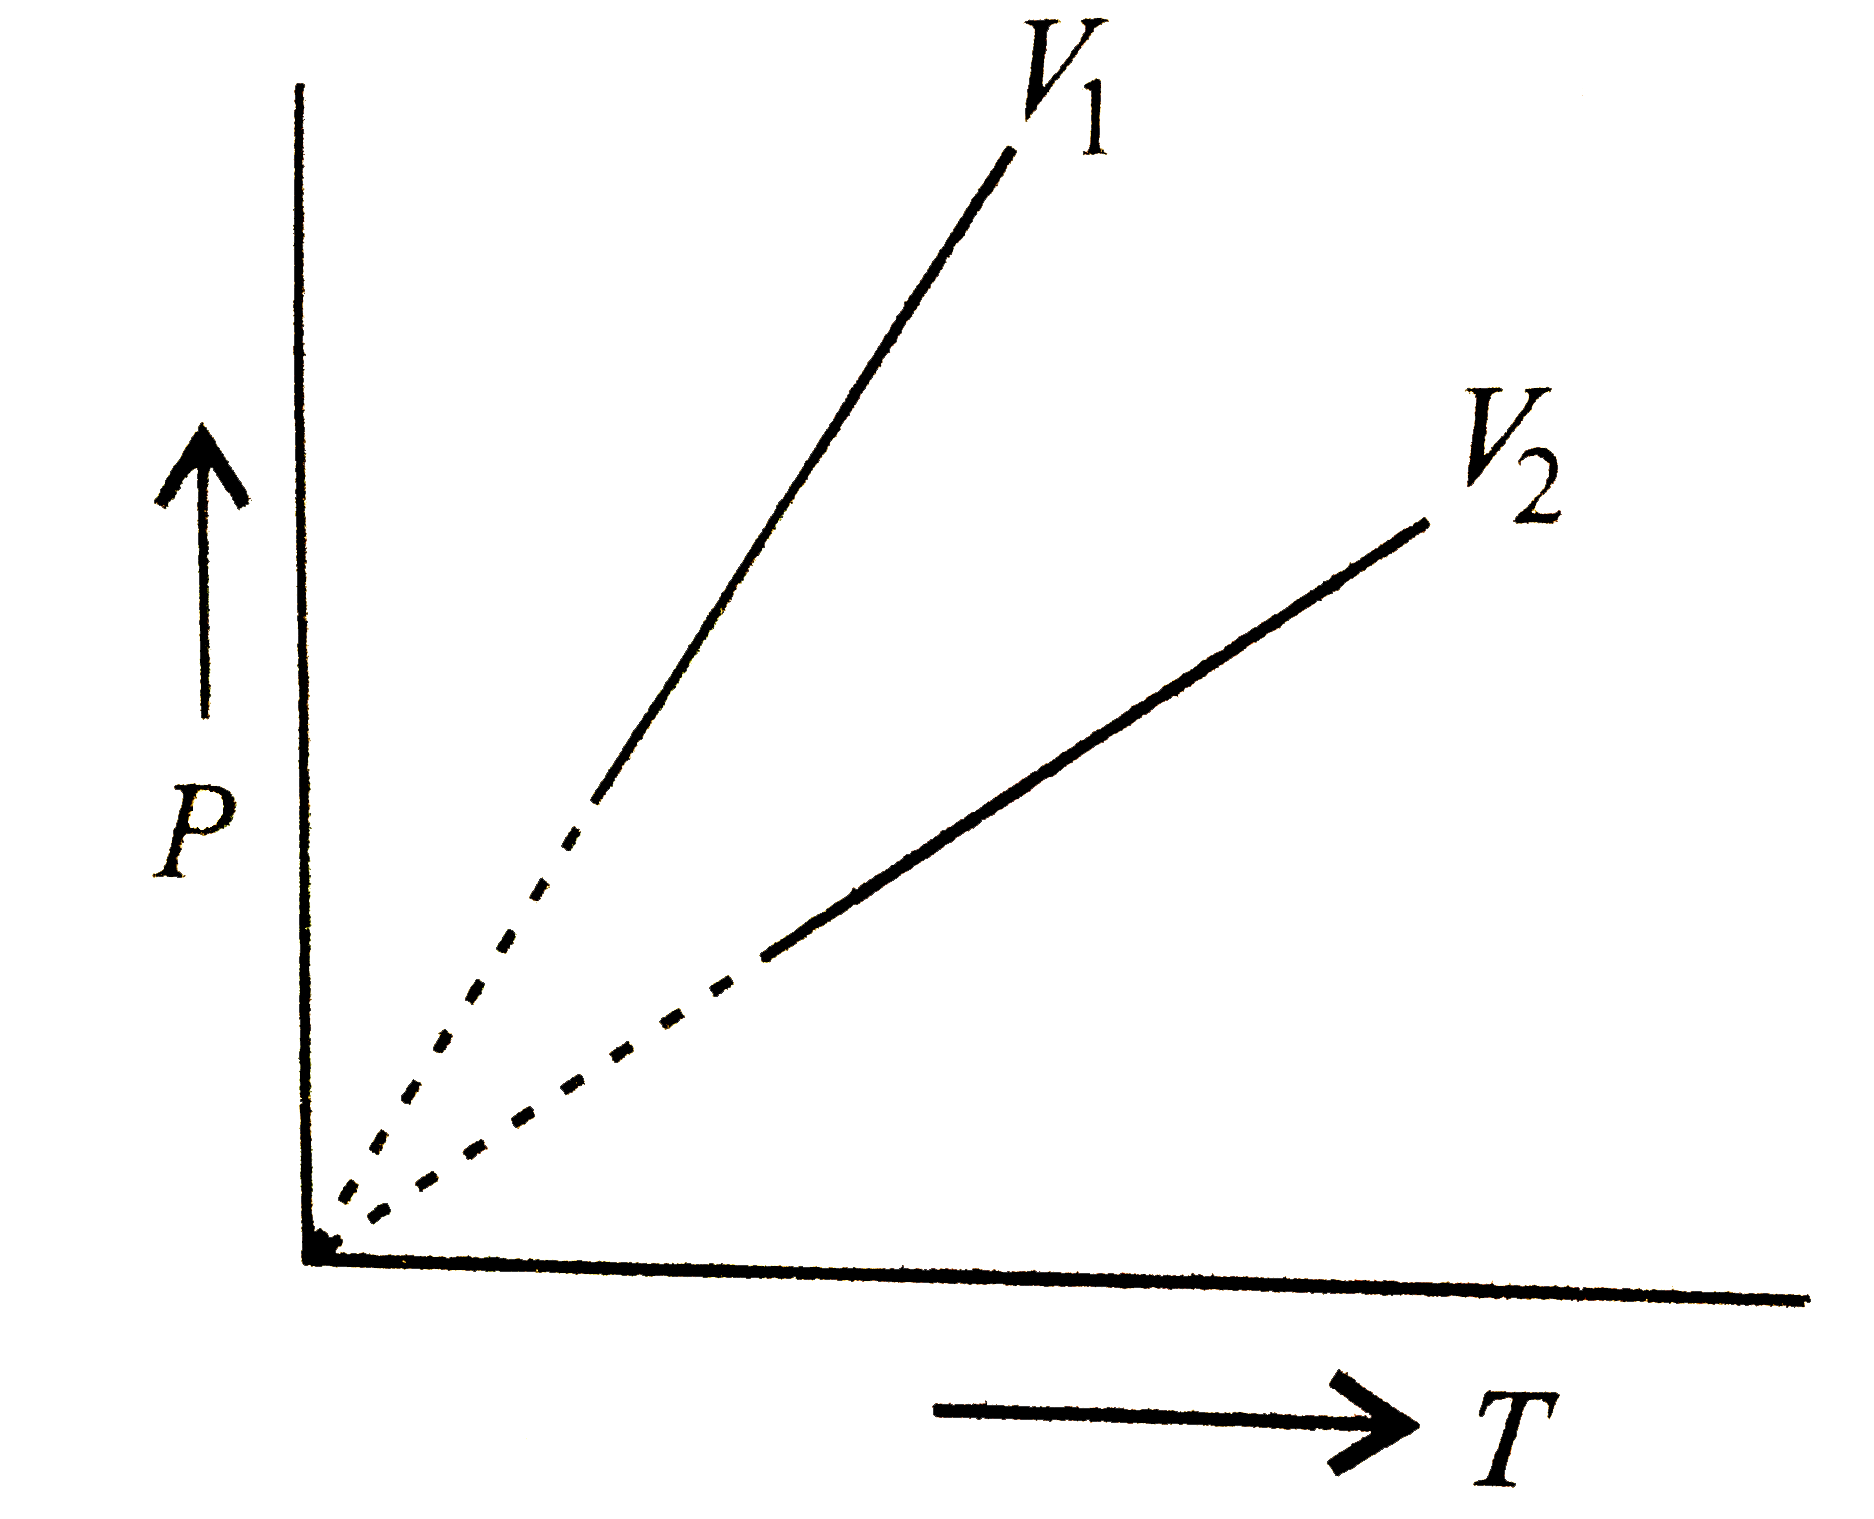
View SolutionA plot of P vs T for a given mass of gas at constant volume is a straight line . P vs T at constant volumes V1 and V2 for an ideal gas are shown below :
Which of the following is correct ?

View SolutionThe slope of the graph between log P and log V at constant temperature for a given mass of gas is
View SolutionFor a first order reaction the plot of ‘t’ against log c gives a straight line with a slope equal to :
View SolutionV vs T curves at constant pressure P1 and P2 for an ideal gas are shown below

Which is correct ?
View SolutionDraw the plot log V vs log T.
View SolutionA plot of ln k against 1T (abscissa) is expected to be a straight line with intercept on coordinate axis equal to
View Solution
