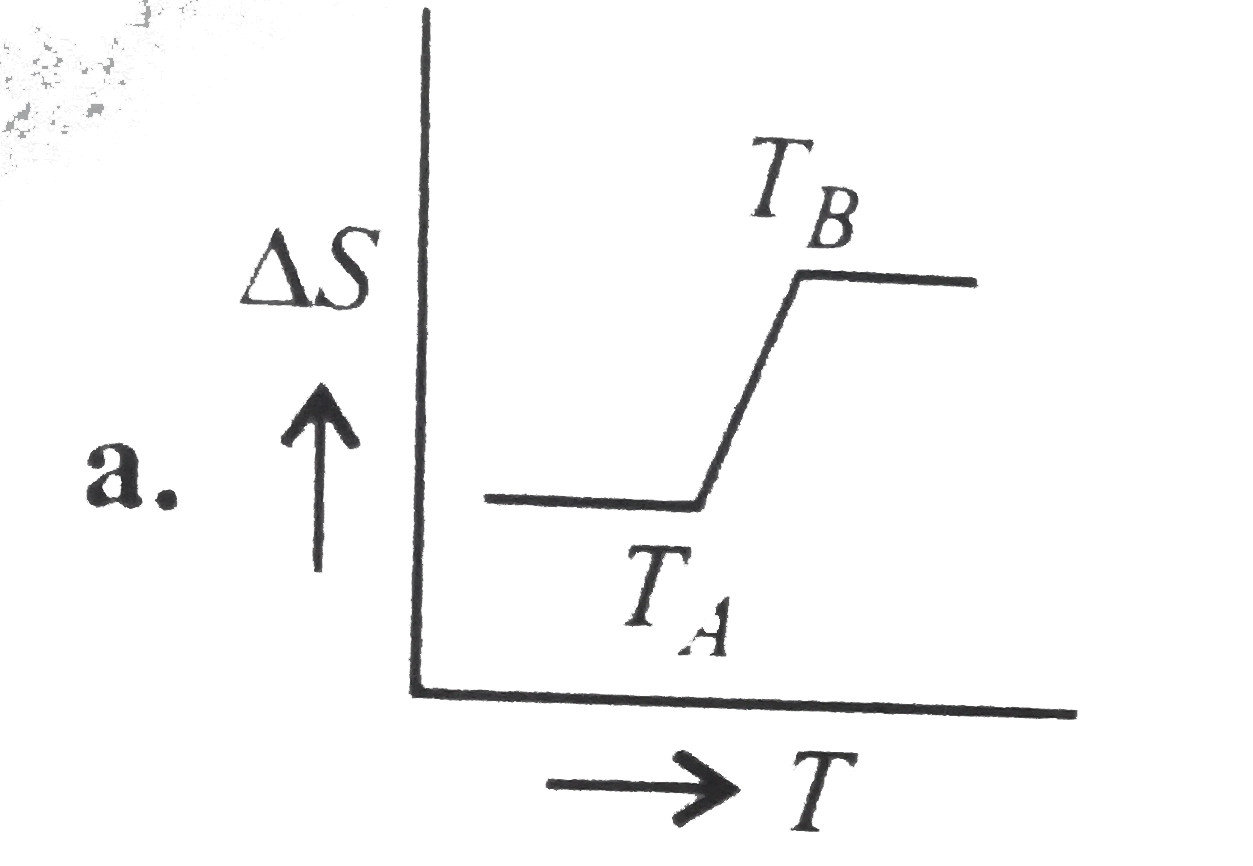
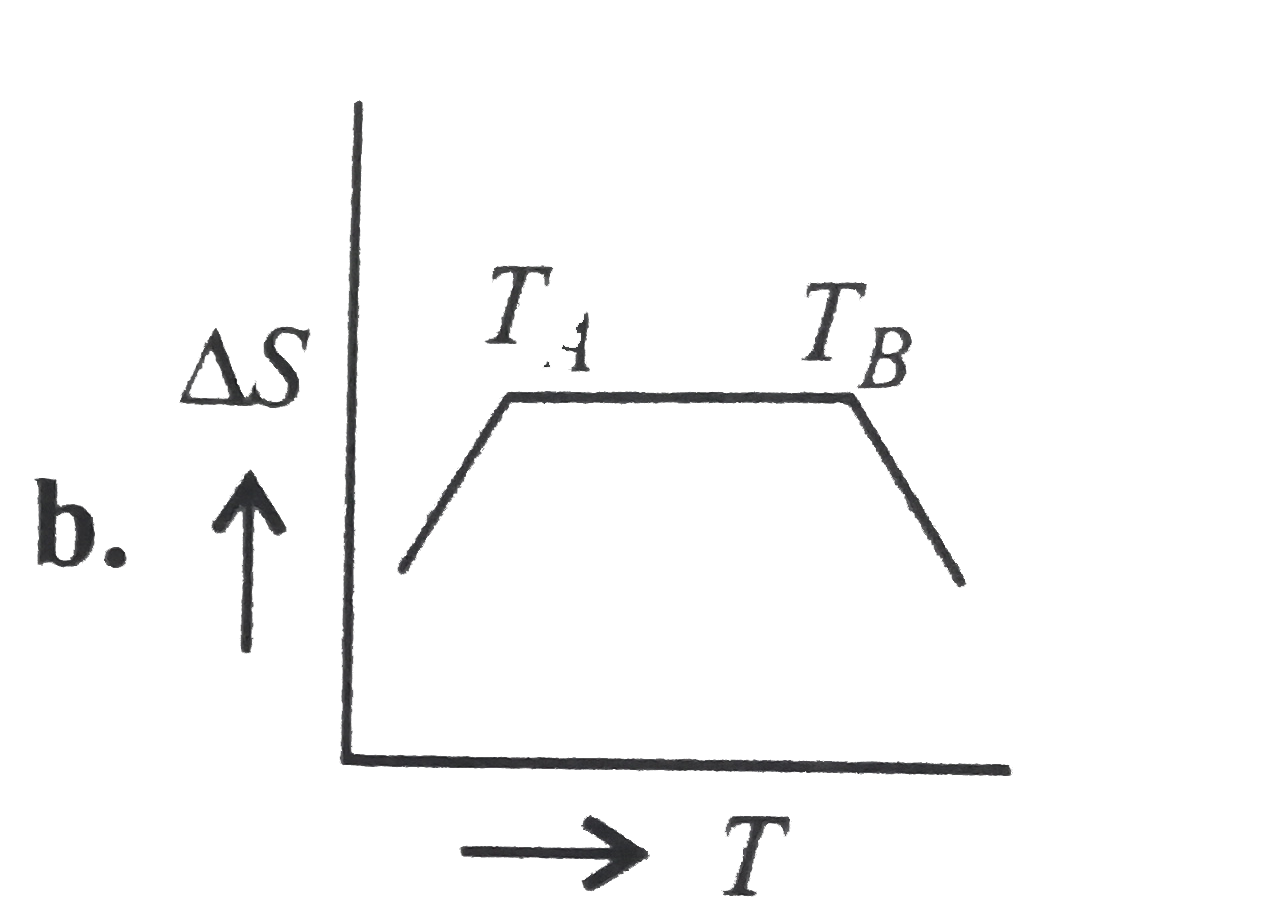
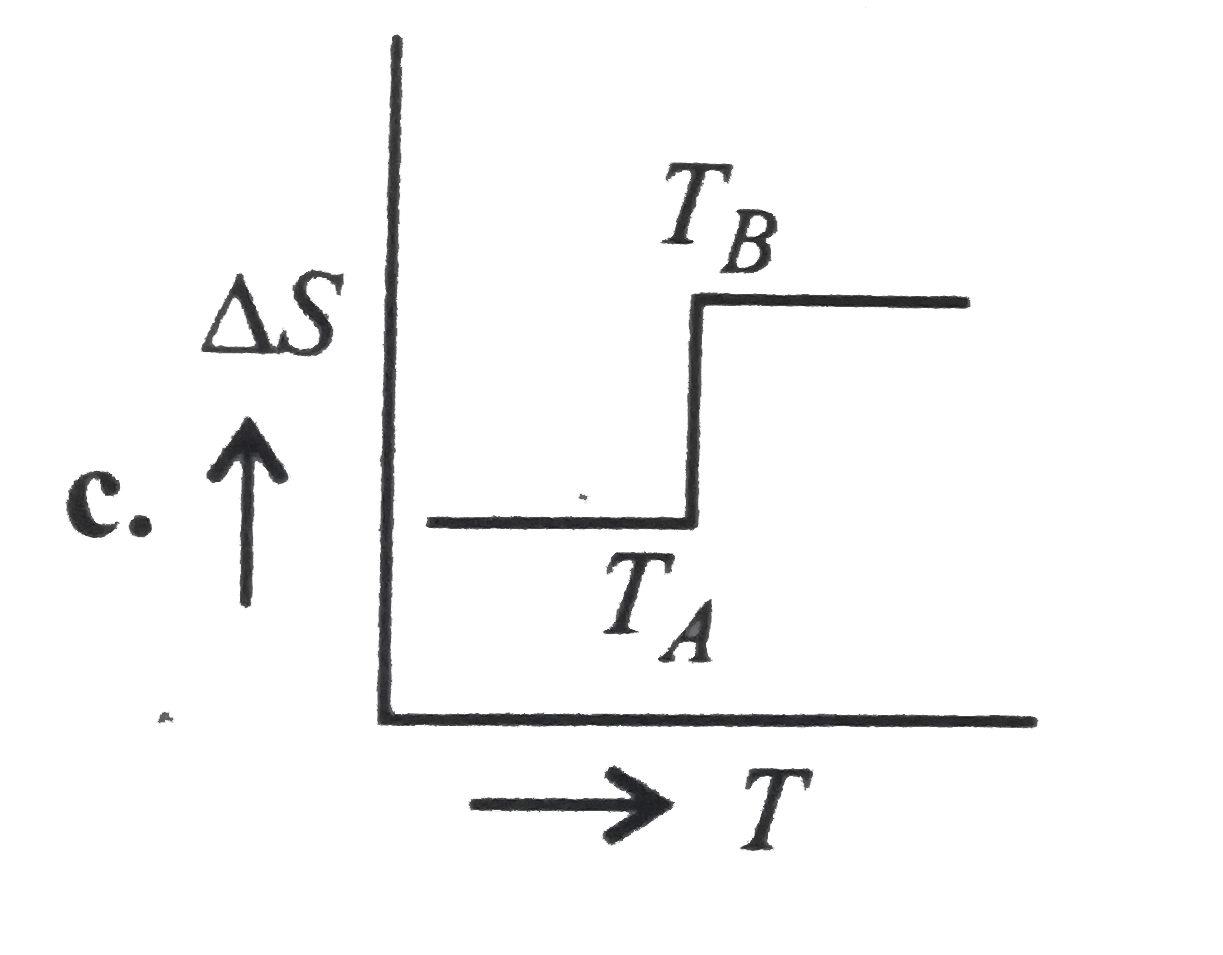
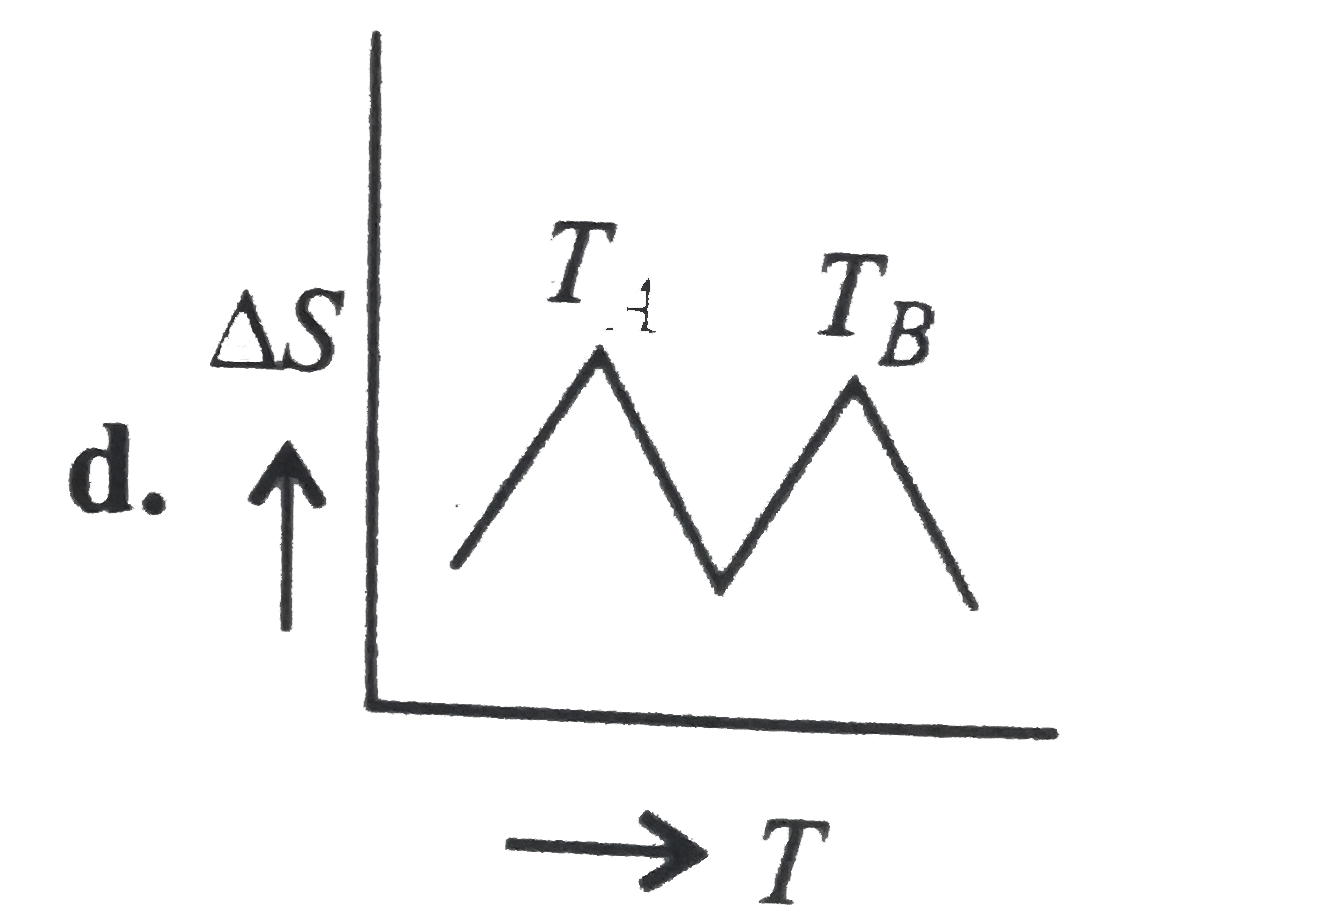
If, for a given substance, is the melting point and is the freezing point, then the correct variation of entropy by the graph between entropy change and temperature is:
To solve the problem regarding the variation of entropy (ΔS) with temperature for a given substance, we need to understand the concepts of melting and freezing points, as well as how entropy behaves during phase transitions.
1. Identify the Phase Transition Points:
- Let TA be the freezing point (the temperature at which a liquid turns into a solid).
- Let TB be the melting point (the temperature at which a solid turns into a liquid).
- For a pure substance, TA is equal to TB.
2. Understand Entropy Change During Freezing and Melting:
- At TA (freezing point), the substance is transitioning from liquid to solid. During this phase change, the entropy remains constant because the system is at equilibrium while the phase change occurs.
- At TB (melting point), the substance is transitioning from solid to liquid. Similarly, the entropy remains constant at this point for the same reason.
3. Behavior of Entropy Above and Below the Phase Transition Points:
- Below TA: The substance is in a solid state, and the entropy is lower.
- At TA: The entropy is constant as the phase change occurs.
- Above TA (and up to TB): The substance is in a liquid state, and the entropy starts to increase as the temperature increases.
- At TB: The entropy is again constant during the phase change from solid to liquid.
- Above TB: The entropy continues to increase as the temperature increases.
4. Graphical Representation:
- On a graph plotting ΔS against temperature (T):
- At TA, there is a horizontal line (constant ΔS) until the phase change occurs.
- After TA, the line rises as the temperature increases and the substance remains in the liquid state.
- At TB, there is another horizontal line (constant ΔS) during the melting phase.
- After TB, the line continues to rise as the temperature increases further.
5. Conclusion:
- The correct graph will show constant entropy at both phase transition points (at TA and TB) with an increase in entropy as the temperature rises above these points.
Final Answer:
The correct variation of entropy (ΔS) with temperature is represented by option 3, which shows constant entropy at the freezing and melting points, with an increase in entropy above these points.
- Let TA be the freezing point (the temperature at which a liquid turns into a solid).
- Let TB be the melting point (the temperature at which a solid turns into a liquid).
- For a pure substance, TA is equal to TB.
- At TA (freezing point), the substance is transitioning from liquid to solid. During this phase change, the entropy remains constant because the system is at equilibrium while the phase change occurs.
- At TB (melting point), the substance is transitioning from solid to liquid. Similarly, the entropy remains constant at this point for the same reason.
- Below TA: The substance is in a solid state, and the entropy is lower.
- At TA: The entropy is constant as the phase change occurs.
- Above TA (and up to TB): The substance is in a liquid state, and the entropy starts to increase as the temperature increases.
- At TB: The entropy is again constant during the phase change from solid to liquid.
- Above TB: The entropy continues to increase as the temperature increases.
- On a graph plotting ΔS against temperature (T):
- At TA, there is a horizontal line (constant ΔS) until the phase change occurs.
- After TA, the line rises as the temperature increases and the substance remains in the liquid state.
- At TB, there is another horizontal line (constant ΔS) during the melting phase.
- After TB, the line continues to rise as the temperature increases further.
- The correct graph will show constant entropy at both phase transition points (at TA and TB) with an increase in entropy as the temperature rises above these points.
The correct variation of entropy (ΔS) with temperature is represented by option 3, which shows constant entropy at the freezing and melting points, with an increase in entropy above these points.
Topper's Solved these Questions
- THERMODYNAMICSBOOK - CENGAGE CHEMISTRY ENGLISHCHAPTER - THERMODYNAMICSEXERCISE - Ex 6.1
26 Videos
- THERMODYNAMICSBOOK - CENGAGE CHEMISTRY ENGLISHCHAPTER - THERMODYNAMICSEXERCISE - Ex 6.2
27 Videos
- THERMODYNAMICSBOOK - CENGAGE CHEMISTRY ENGLISHCHAPTER - THERMODYNAMICSEXERCISE - Archives (Subjective)
23 Videos
- STOICHIOMETRYBOOK - CENGAGE CHEMISTRY ENGLISHCHAPTER - STOICHIOMETRYEXERCISE - Archives Subjective
33 Videos
Similar Questions
The graph between the (velocity2) and temperature T of a gas is
View SolutionThe relationship between the free energy change (ΔG) and entropy change (ΔS) at constant temperature (T) si
View SolutionThe correct graph which shows the variation of paramagnetic susceptibility S with temperature T is
View SolutionCorrect order of melting point of the given compounds is
View SolutionAt a certain temperature T, the endothermic reaction A→B proceeds almost to completion.The entropy change is :
View SolutionChoose the correct graph of variation of magnetic susceptibility Xm of paramagnetic substance versus absolute temperature T.
View SolutionThe enthalpy change for a given reaction at 298K is −xcalmol−1. If the reaction occurs spontaneously at 298K, the entropy change at that temperature
View SolutionThe change in entropy, ΔS is positive for an endothermic reaction, if enthalpy change ΔH occurs at the same temperature T, then the reaction is feasible
View SolutionLook at the change of state diagram from gas to solid given here carefully, and answer the following questions.
a. During freezing, certain amount of heat is given out without any change in temperature. Which part of the graph shows this change?
b. During condensation, certain amount of heat is given out without any change in temperature. Which part of the graph shows this change?
c. Which point on the graph corresponds to
İ. condensation point? ii. freezing point?
d. What do ab and cd on the graph represent?
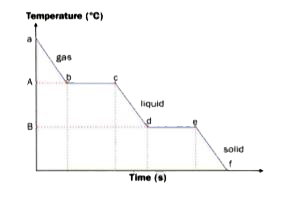
View SolutionHow does entropy changes with
a. Increase in temperature
b. Decrease in pressure?
View Solution
