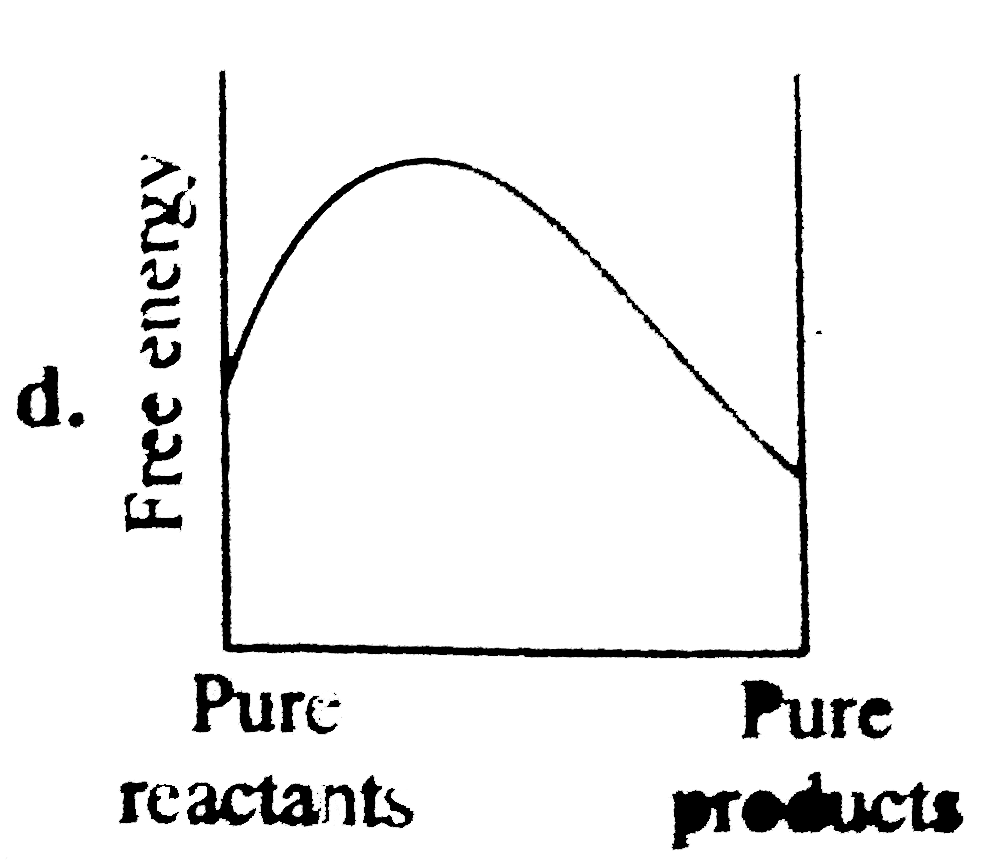
Which of the following graph correctly represent for equilibrium reaction whose Kp>1?


The correct Answer is:A
To determine which graph correctly represents an equilibrium reaction where Kp>1, we can follow these steps:
Step 1: Understanding Kp
- The equilibrium constant Kp is a measure of the ratio of the concentrations of products to reactants at equilibrium. When Kp>1, it indicates that at equilibrium, the concentration of products is greater than that of reactants.
Step 2: Relating Kp to Gibbs Free Energy
- The relationship between Gibbs free energy (ΔG) and Kp is given by the equation:
ΔG=−RTlnKp
where R is the gas constant and T is the temperature in Kelvin. If Kp>1, then lnKp is positive, which makes ΔG negative.
Step 3: Implications of ΔG<0
- A negative ΔG indicates that the reaction is spontaneous in the forward direction. This means that the products are favored over the reactants at equilibrium.
Step 4: Analyzing the Graphs
- We need to analyze the graphs provided to see which one reflects the relationship where the Gibbs free energy of the products is lower than that of the reactants.
1. Graph A: Shows that the Gibbs free energy of products is lower than that of reactants. This is consistent with Kp>1.
2. Graph B: Shows that the Gibbs free energy of reactants is lower than that of products, which contradicts our condition.
3. Graph C: Indicates that the Gibbs free energy of reactants and products are equal, which is not the case for Kp>1.
4. Graph D: Shows that the Gibbs free energy of reactants is higher than that of products, which is also consistent with Kp>1.
Step 5: Conclusion
- Between Graph A and Graph D, Graph A correctly shows the trend where the Gibbs free energy of products is lower than that of reactants, indicating a spontaneous reaction favoring products. Therefore, the correct answer is Graph A.
- The equilibrium constant Kp is a measure of the ratio of the concentrations of products to reactants at equilibrium. When Kp>1, it indicates that at equilibrium, the concentration of products is greater than that of reactants.
- The relationship between Gibbs free energy (ΔG) and Kp is given by the equation:
ΔG=−RTlnKp
where R is the gas constant and T is the temperature in Kelvin. If Kp>1, then lnKp is positive, which makes ΔG negative.
- A negative ΔG indicates that the reaction is spontaneous in the forward direction. This means that the products are favored over the reactants at equilibrium.
- We need to analyze the graphs provided to see which one reflects the relationship where the Gibbs free energy of the products is lower than that of the reactants.
1. Graph A: Shows that the Gibbs free energy of products is lower than that of reactants. This is consistent with Kp>1.
2. Graph B: Shows that the Gibbs free energy of reactants is lower than that of products, which contradicts our condition.
3. Graph C: Indicates that the Gibbs free energy of reactants and products are equal, which is not the case for Kp>1.
4. Graph D: Shows that the Gibbs free energy of reactants is higher than that of products, which is also consistent with Kp>1.
- Between Graph A and Graph D, Graph A correctly shows the trend where the Gibbs free energy of products is lower than that of reactants, indicating a spontaneous reaction favoring products. Therefore, the correct answer is Graph A.
Topper's Solved these Questions
- CHEMICAL EQUILIBRIUMBOOK - CENGAGE CHEMISTRY ENGLISHCHAPTER - CHEMICAL EQUILIBRIUMEXERCISE - Concept Applicationexercise 7.1
53 Videos
- CHEMICAL EQUILIBRIUMBOOK - CENGAGE CHEMISTRY ENGLISHCHAPTER - CHEMICAL EQUILIBRIUMEXERCISE - Ex 7.2
40 Videos
- CHEMICAL BONDING AND MOLECULAR STRUCTUREBOOK - CENGAGE CHEMISTRY ENGLISHCHAPTER - CHEMICAL BONDING AND MOLECULAR STRUCTUREEXERCISE - Archives Subjective
15 Videos
- CLASSIFICATION AND NOMENCLATURE OF ORGANIC COMPOUNDSBOOK - CENGAGE CHEMISTRY ENGLISHCHAPTER - CLASSIFICATION AND NOMENCLATURE OF ORGANIC COMPOUNDSEXERCISE - Analytical and Descriptive Type
3 Videos
Similar Questions
Knowledge Check
Which of the following reactions are correctly represented?
AR−CH=CH2+HCl→R−CH∣Cl−CH3BR−CH=CH2+HIH2O2−−→hvR−CH2−CH2−ICR−CH=CH2+HBrH2O2−−→hvR−CH2−CH2−BrDR−CH=CH2+HIH2O2−−→hvR−I∣CH−CH3Which of the following graph represents correct graph for SN1 reaction :
A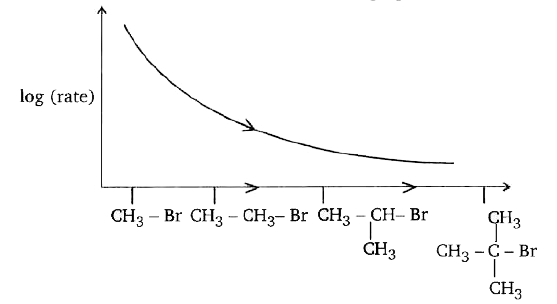 B
B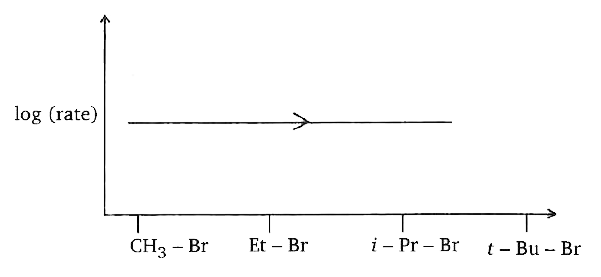 C
C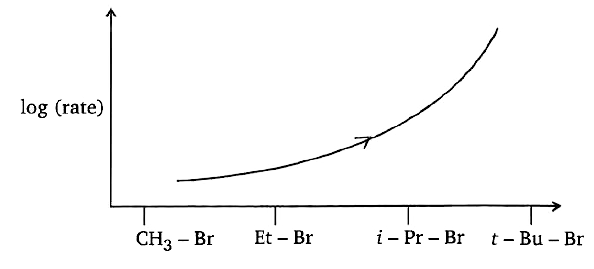 D
D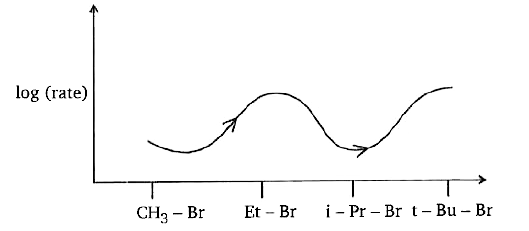
Which of the following graphs represents exothermic reaction ?
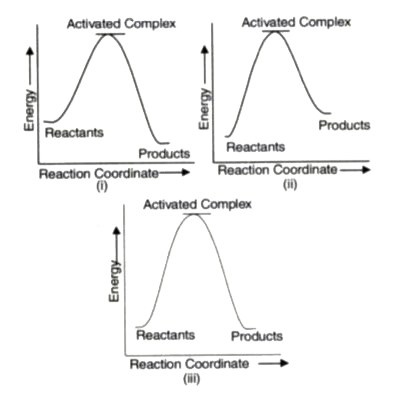 A(i) onlyB(ii) onlyC(iii) onlyD(i) and (ii)
Which of the following graph correctly represents velocity-time relationship for a particle released from rest to fall freely under gravity ?
View SolutionWhich of the following graphs correctly represents the variation of g on the - Earth?
View SolutionWhich of the following graph represents exothermic reaction ?
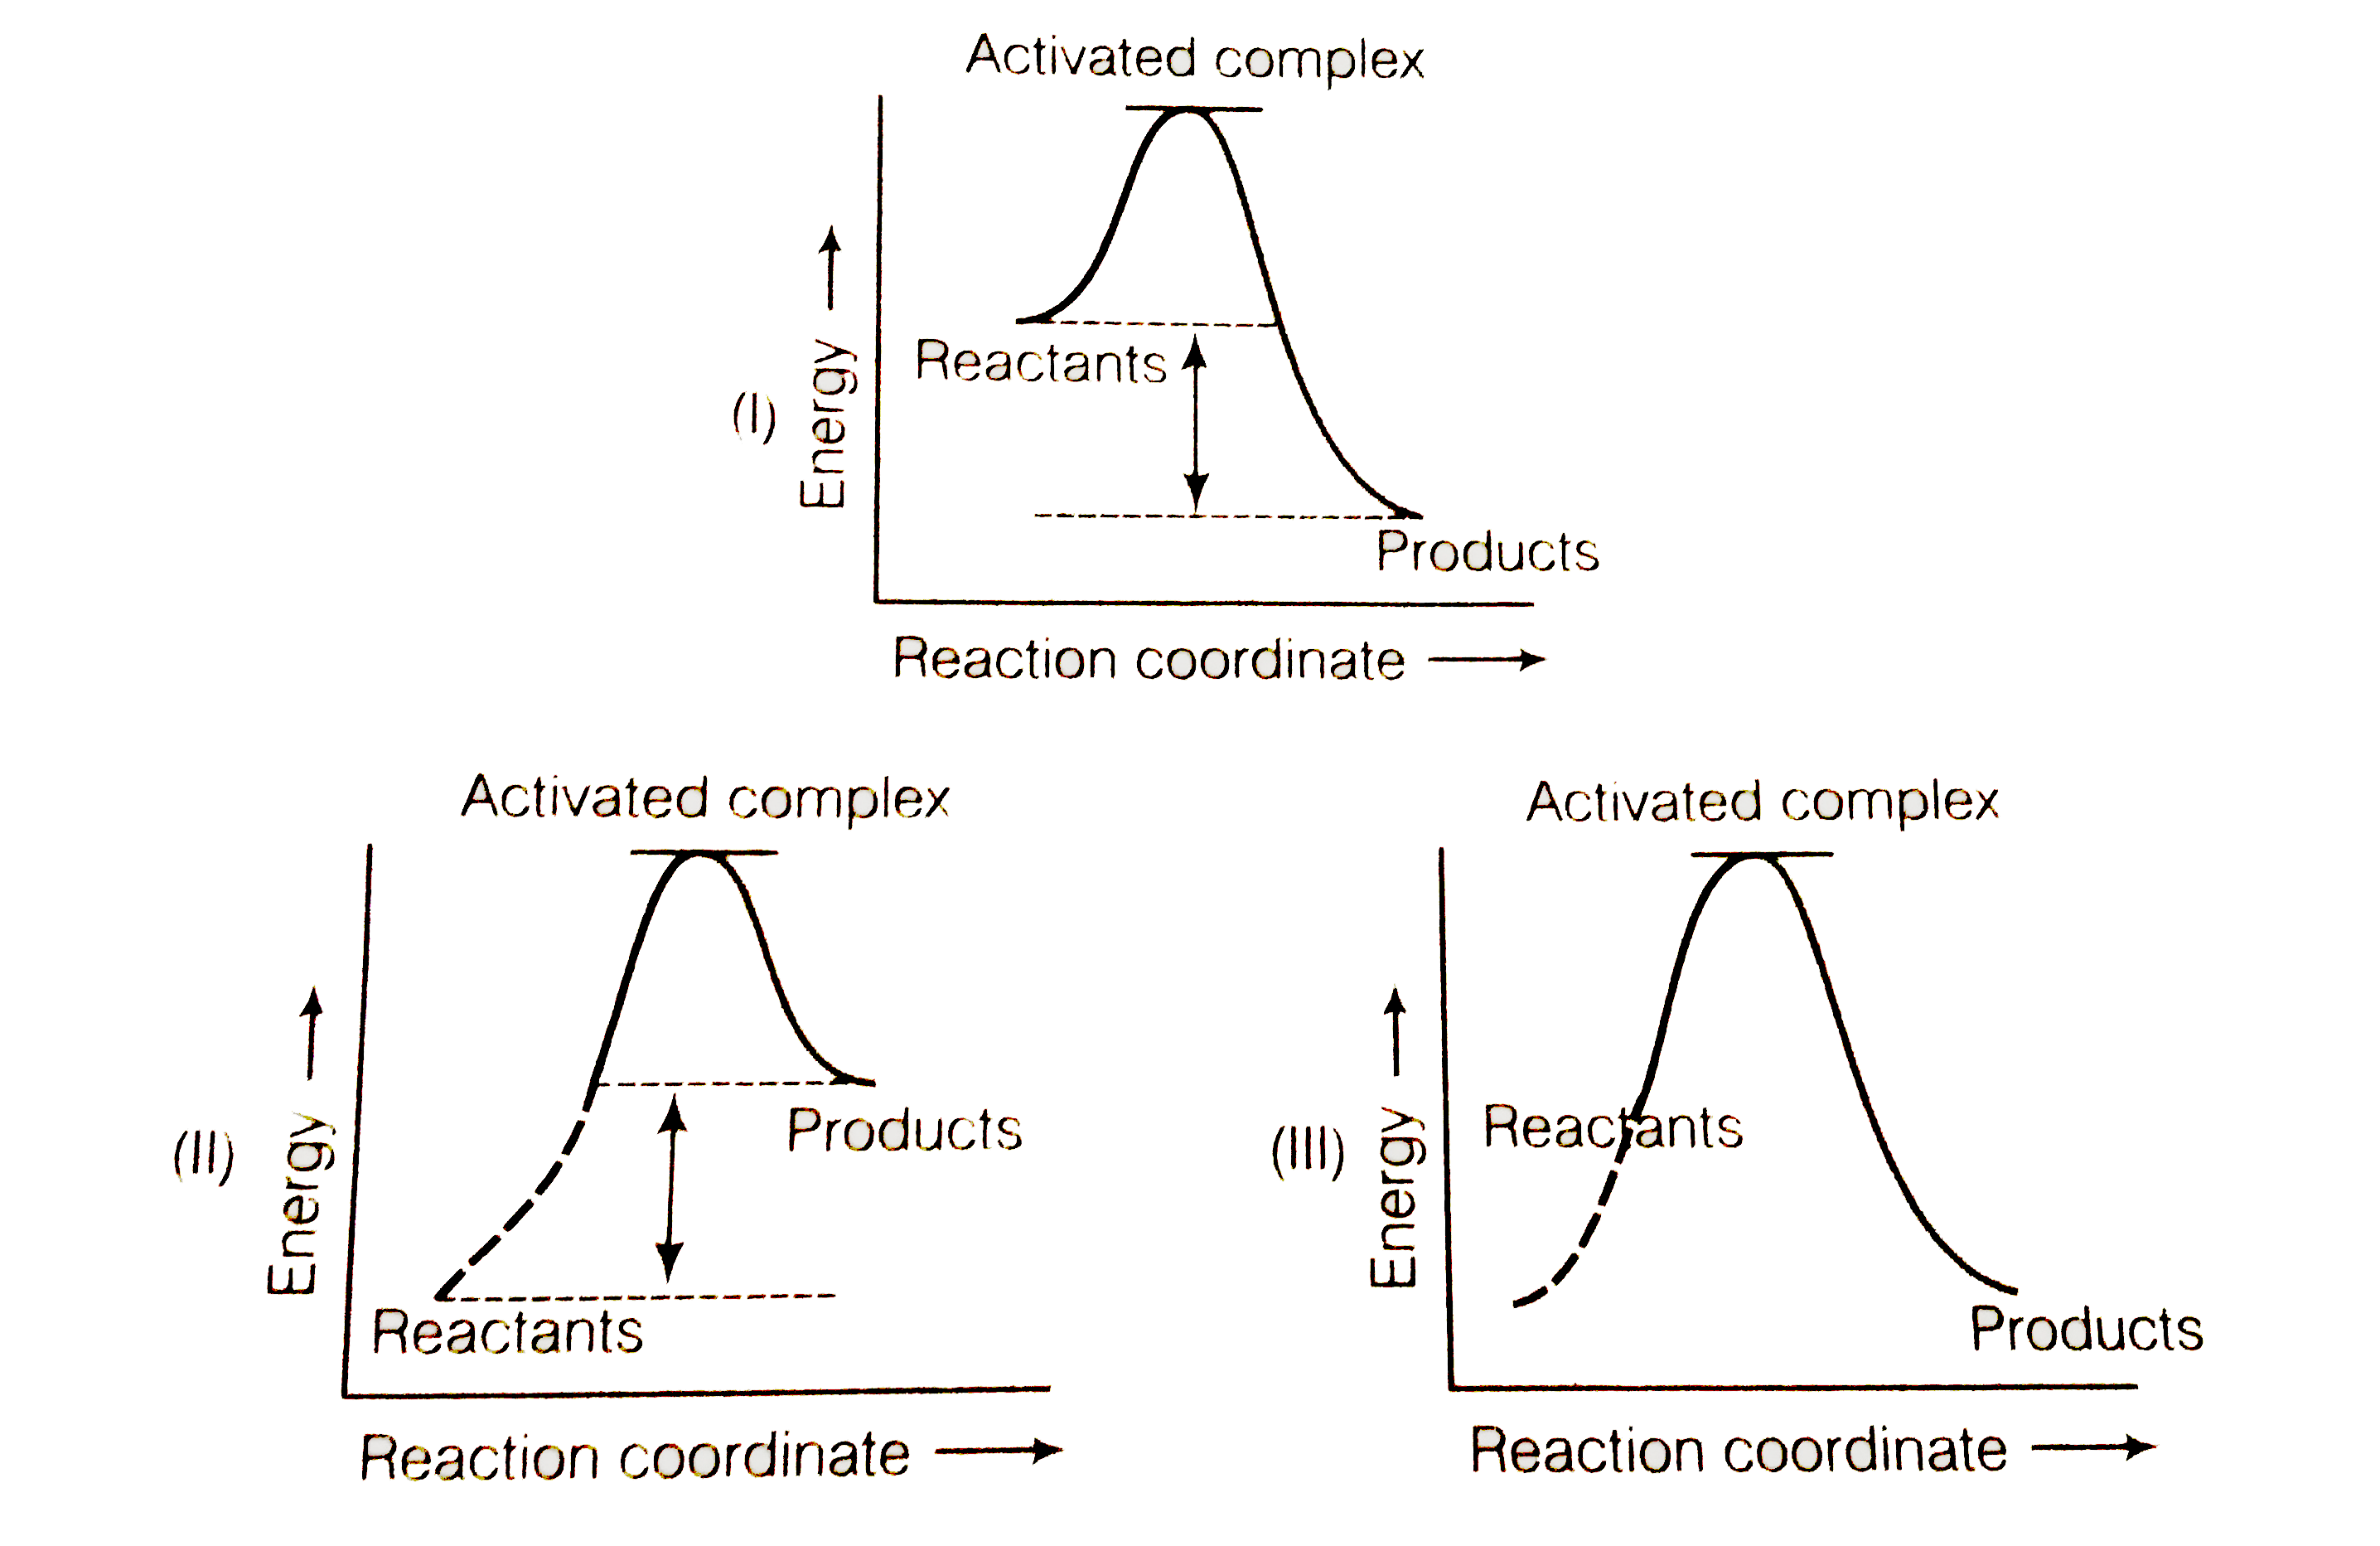
View SolutionWhich of the following graphs represents exothermic reaction ?

View SolutionWhich of the following graphs represents exothermic reaction ?

View Solution
