Which of the following graphs represents zero order if
A→P At t=0⇒[A]0 At t=t⇒[A]t
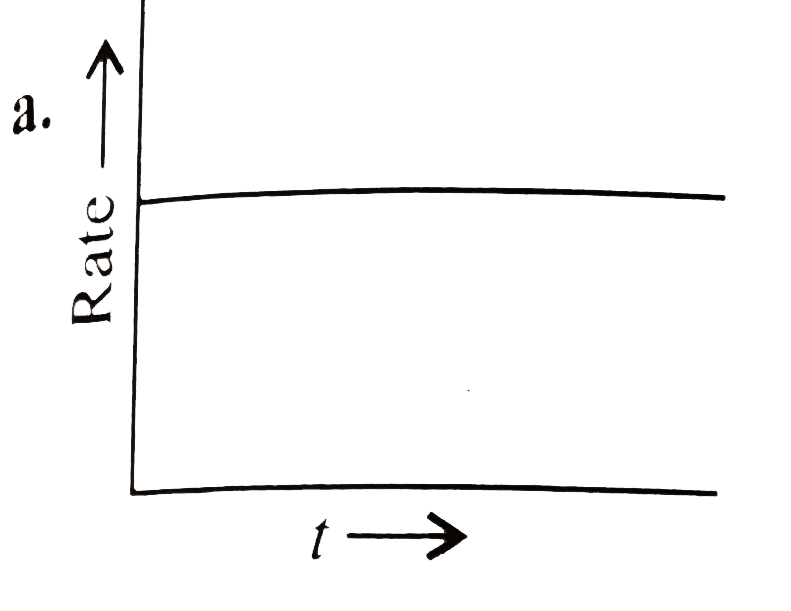
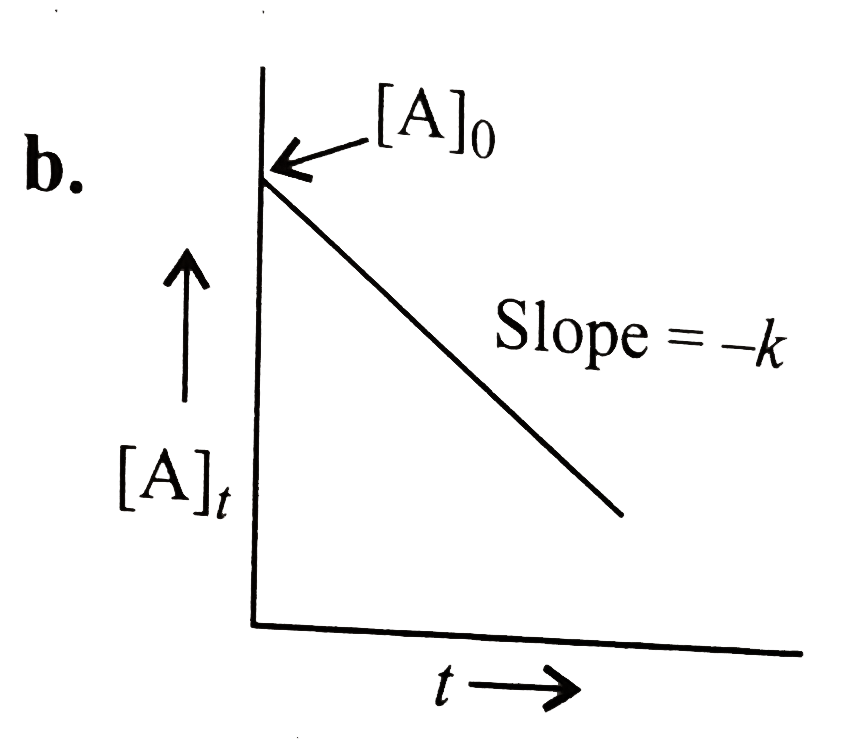
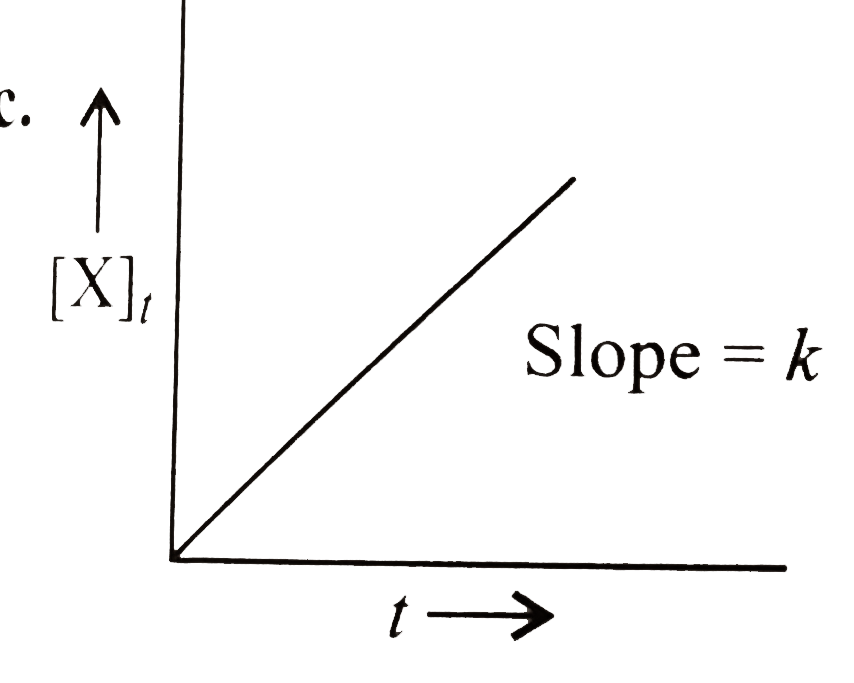
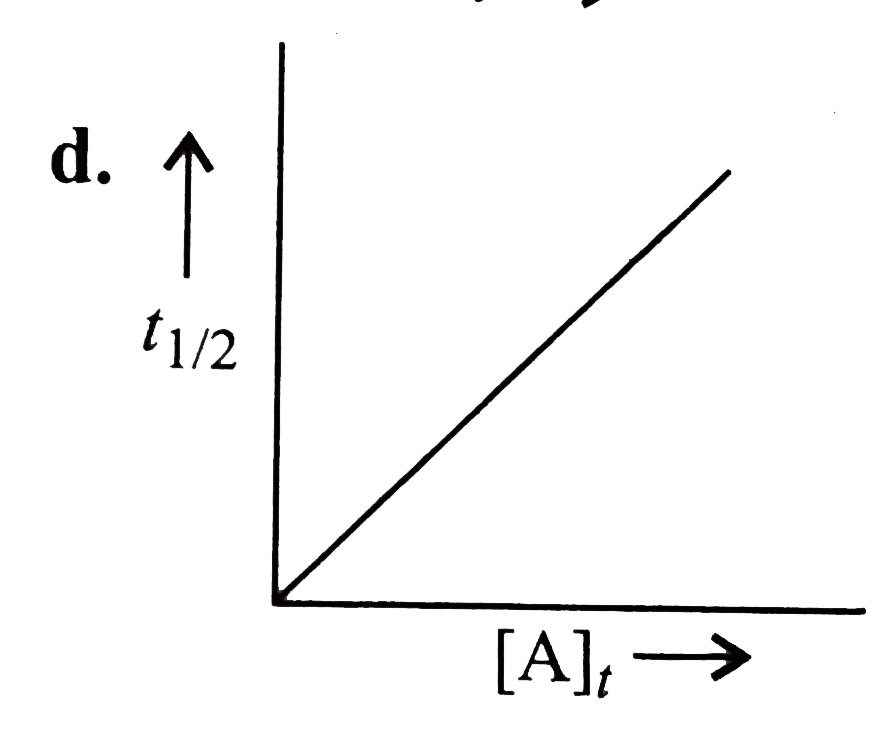
The correct Answer is:A, B, C, D
To determine which graph represents a zero-order reaction for the reaction A→P, we need to analyze the characteristics of zero-order kinetics.
1. Understanding Zero-Order Reactions:
- In a zero-order reaction, the rate of reaction is constant and does not depend on the concentration of the reactant. The rate law can be expressed as:
Rate=k
- Here, k is the rate constant.
2. Mathematical Representation:
- For a zero-order reaction, the relationship between the concentration of reactant (A) and time t can be described by the equation:
(A)0−(A)t=kt
- Rearranging this gives:
(A)t=(A)0−kt
- This equation indicates that a plot of (A)t versus time t will yield a straight line with a negative slope of −k and an intercept of (A)0.
3. Graphical Representation:
- The graph of (A)t versus time t will be a straight line that starts at (A)0 and decreases linearly over time.
- The slope of the line will be negative, indicating that the concentration of A decreases as time increases.
4. Identifying the Correct Graph:
- Among the given options, we need to look for a graph that shows a linear decrease in concentration over time, which corresponds to the equation derived above.
5. Conclusion:
- The correct graph that represents a zero-order reaction will be a straight line with a negative slope, indicating a constant rate of reaction over time.
- In a zero-order reaction, the rate of reaction is constant and does not depend on the concentration of the reactant. The rate law can be expressed as:
Rate=k
- Here, k is the rate constant.
- For a zero-order reaction, the relationship between the concentration of reactant (A) and time t can be described by the equation:
(A)0−(A)t=kt
- Rearranging this gives:
(A)t=(A)0−kt
- This equation indicates that a plot of (A)t versus time t will yield a straight line with a negative slope of −k and an intercept of (A)0.
- The graph of (A)t versus time t will be a straight line that starts at (A)0 and decreases linearly over time.
- The slope of the line will be negative, indicating that the concentration of A decreases as time increases.
- Among the given options, we need to look for a graph that shows a linear decrease in concentration over time, which corresponds to the equation derived above.
- The correct graph that represents a zero-order reaction will be a straight line with a negative slope, indicating a constant rate of reaction over time.
Topper's Solved these Questions
- CHEMICAL KINETICSBOOK - CENGAGE CHEMISTRY ENGLISHCHAPTER - CHEMICAL KINETICSEXERCISE - Exercises Single Correct
177 Videos
- CHEMICAL KINETICSBOOK - CENGAGE CHEMISTRY ENGLISHCHAPTER - CHEMICAL KINETICSEXERCISE - Exercises Assertion-Reasoning
22 Videos
- CHEMICAL KINETICSBOOK - CENGAGE CHEMISTRY ENGLISHCHAPTER - CHEMICAL KINETICSEXERCISE - Exercises Linked Comprehension
59 Videos
- CARBOXYLIC ACIDS AND THEIR DERIVATIVESBOOK - CENGAGE CHEMISTRY ENGLISHCHAPTER - CARBOXYLIC ACIDS AND THEIR DERIVATIVESEXERCISE - Exercises Archives (Analytical And Descriptive)
34 Videos
- COORDINATION COMPOUNDSBOOK - CENGAGE CHEMISTRY ENGLISHCHAPTER - COORDINATION COMPOUNDSEXERCISE - Archives Subjective
18 Videos
Similar Questions
Which of the following graph represents the variation of resistivity (ρ) with temperature (T) for copper?
View SolutionThe graph shown the variation with times t of the velocity v of an object . Which one of the following graphs best represents the variation of acceleration a of the object with time t?

View Solution
Knowledge Check
Which of the following x-t graphs does not represent periodic motion?
A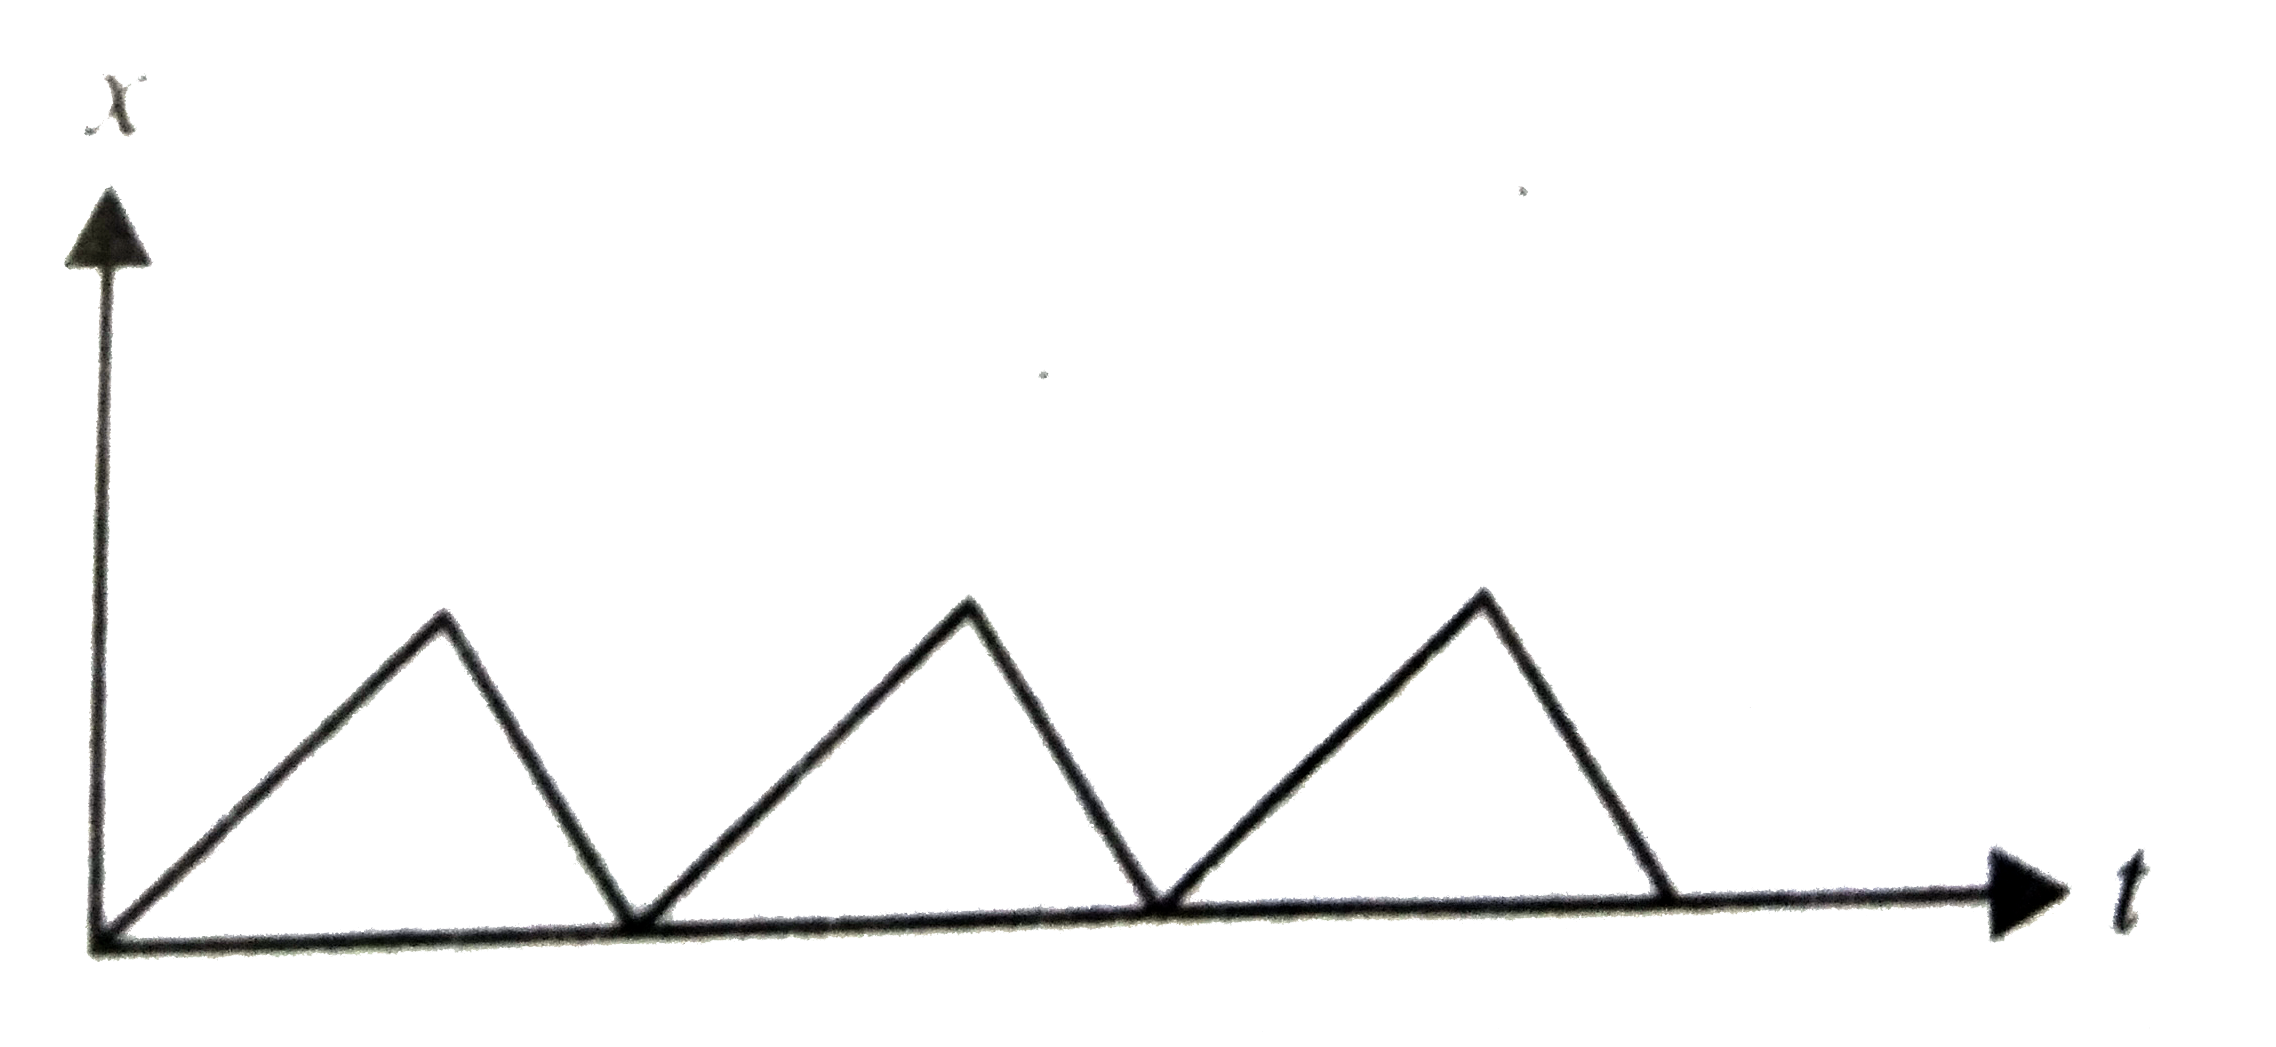 B
B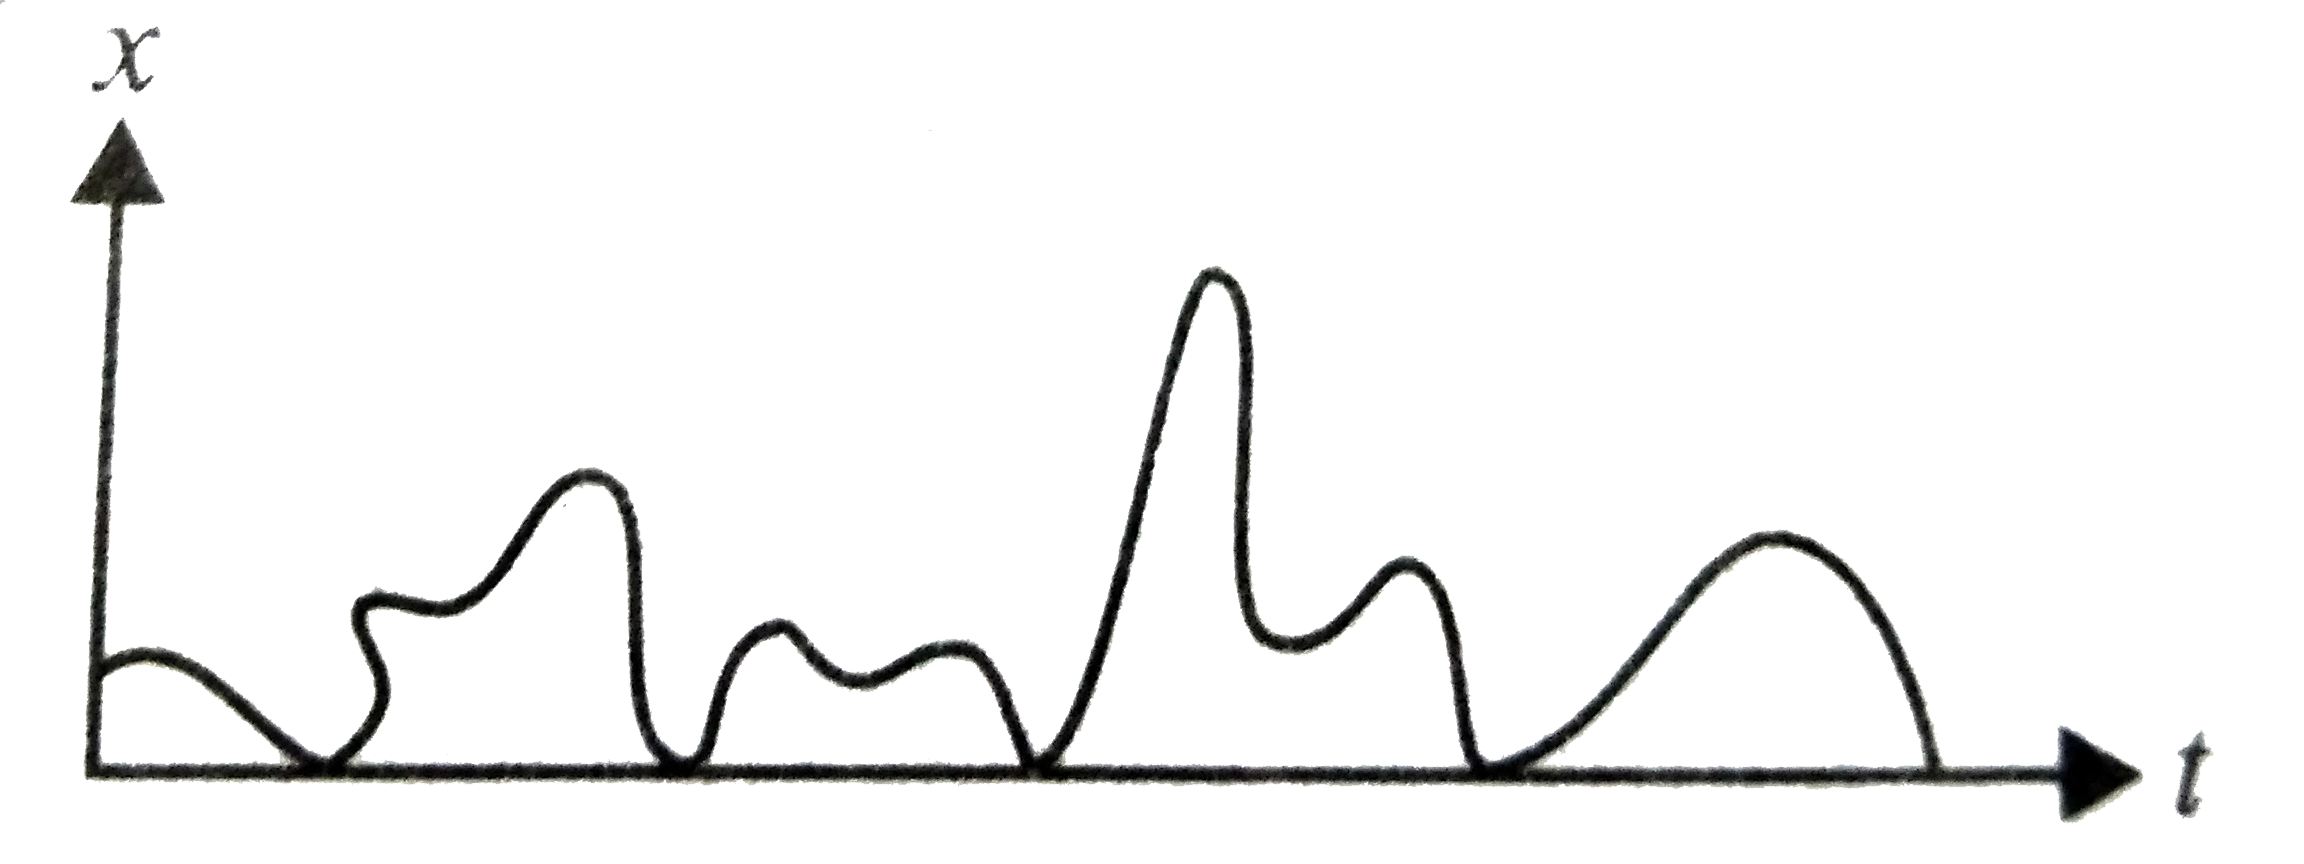 C
C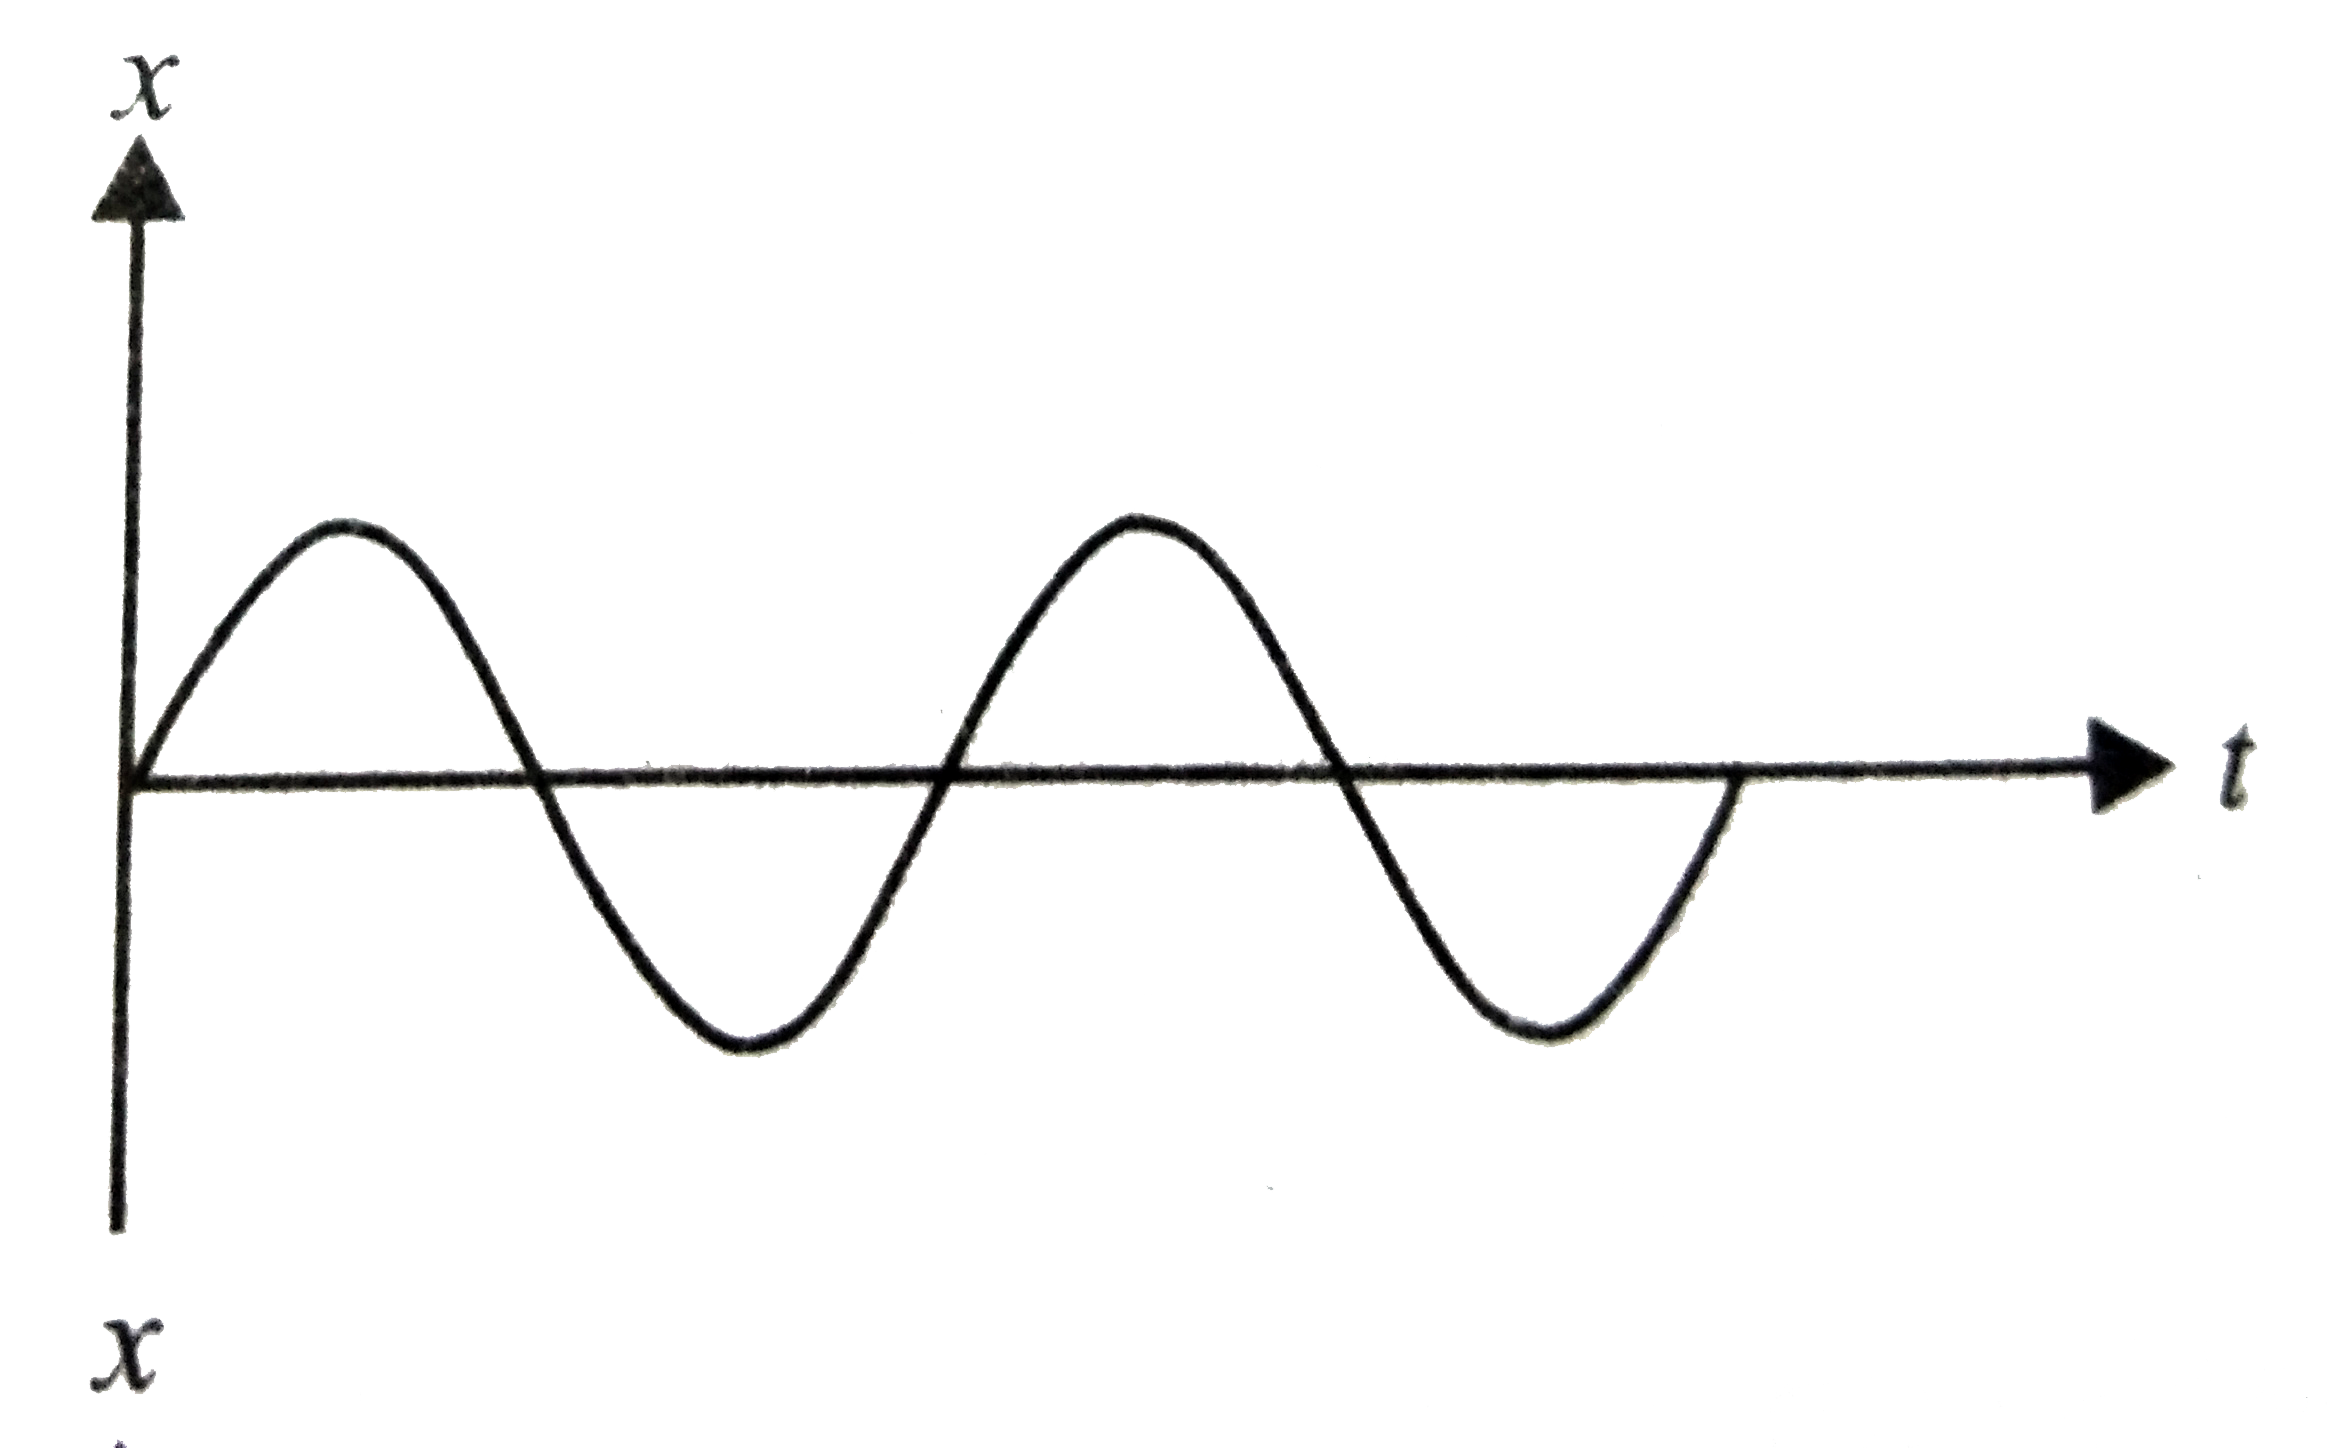 D
D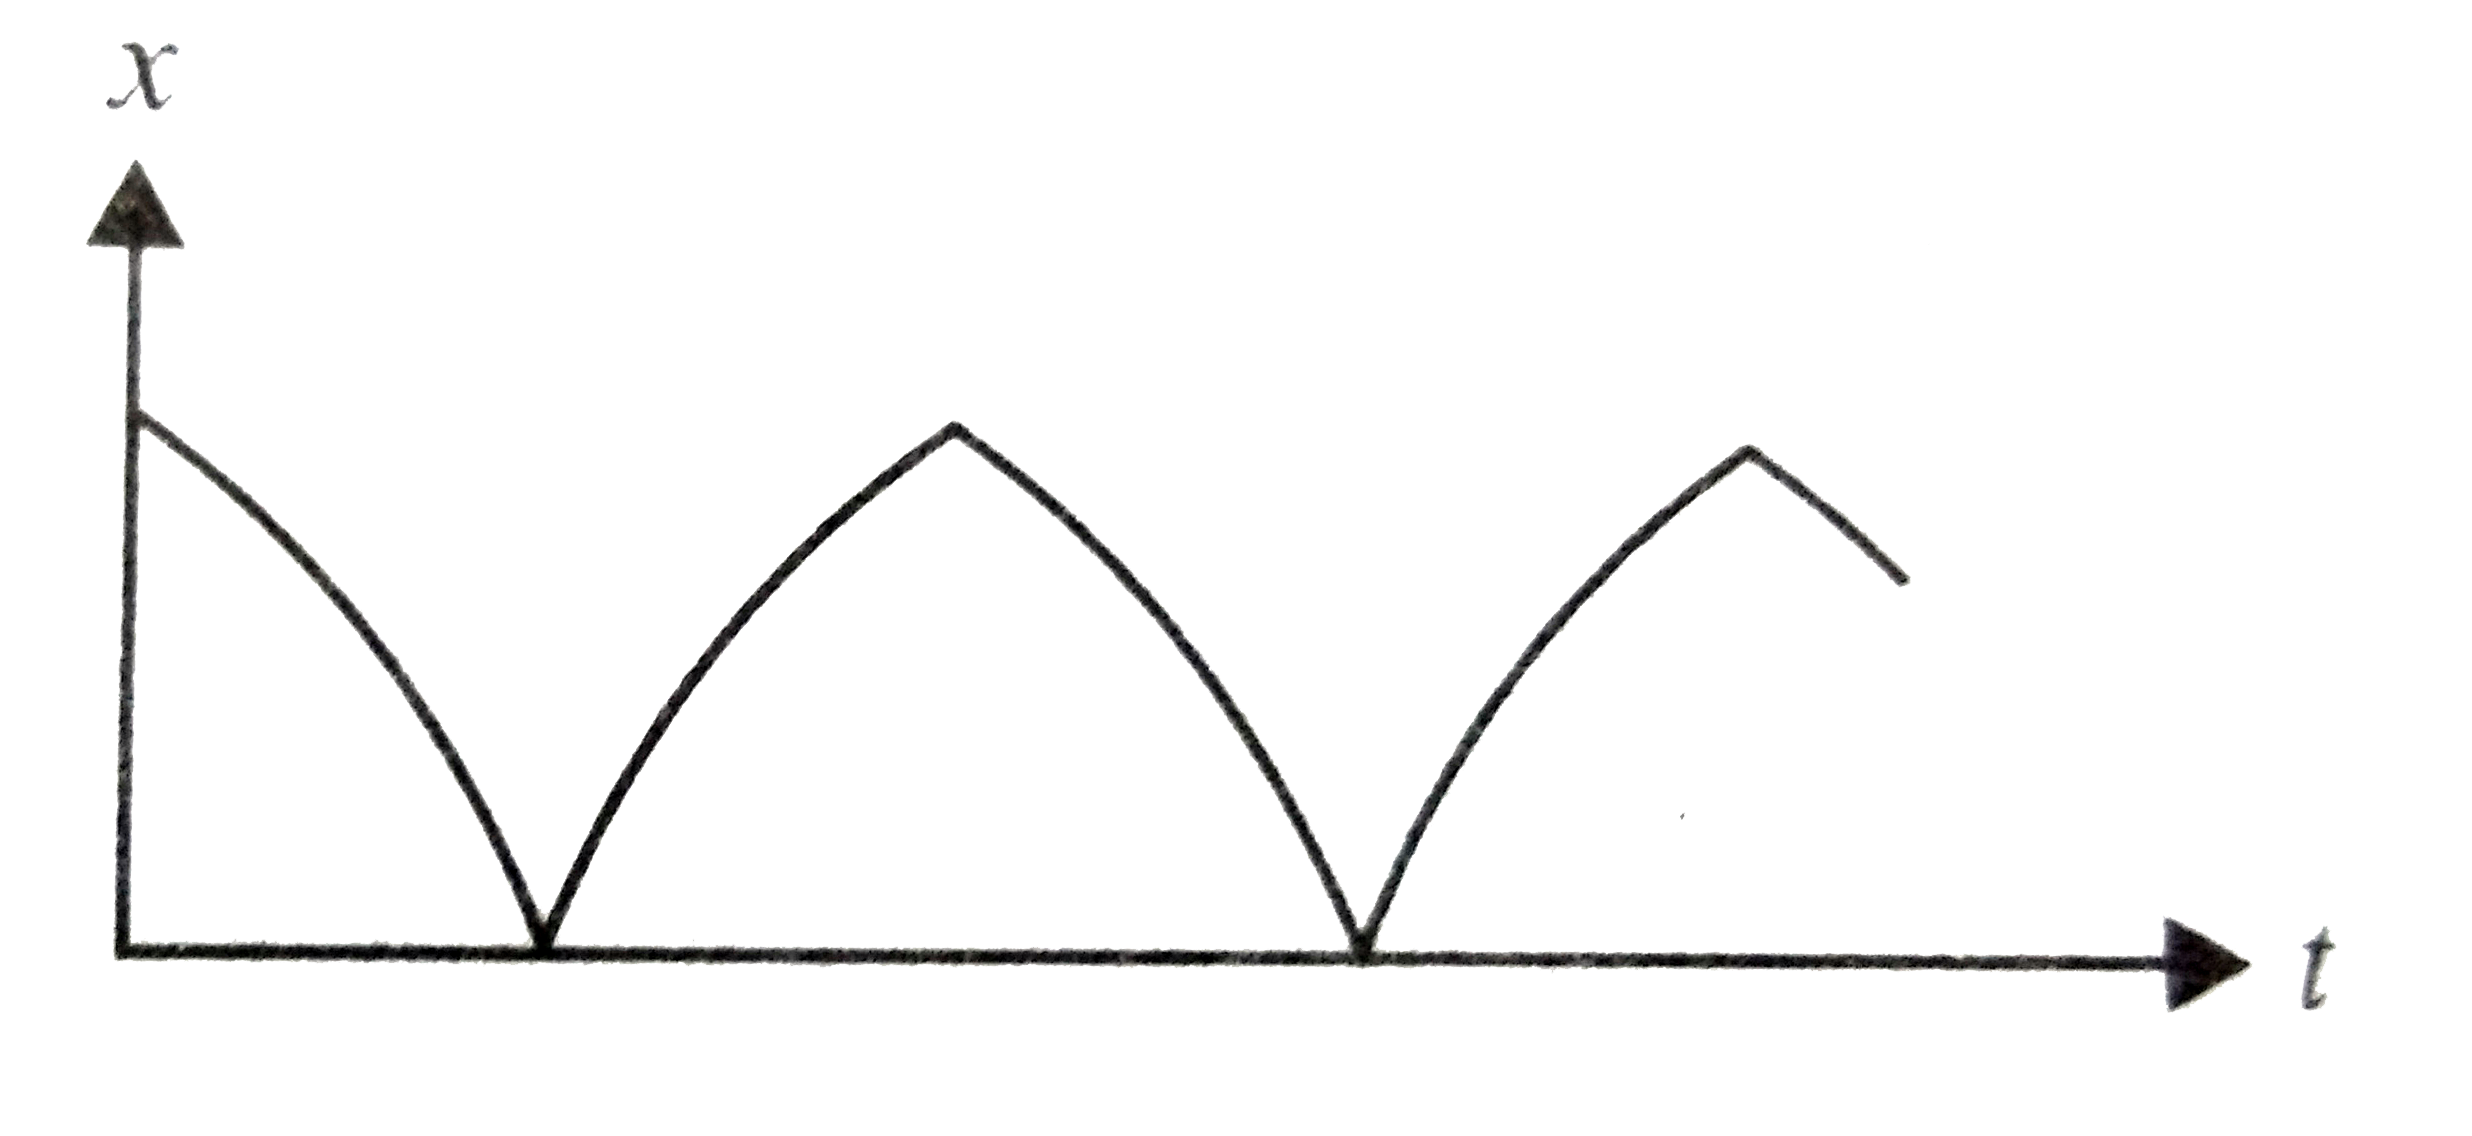
If 0≤t≤1, which of the following graphs is the graph of y versus x where x and y are related by the parametric equations y=t2 and x=√t ?
A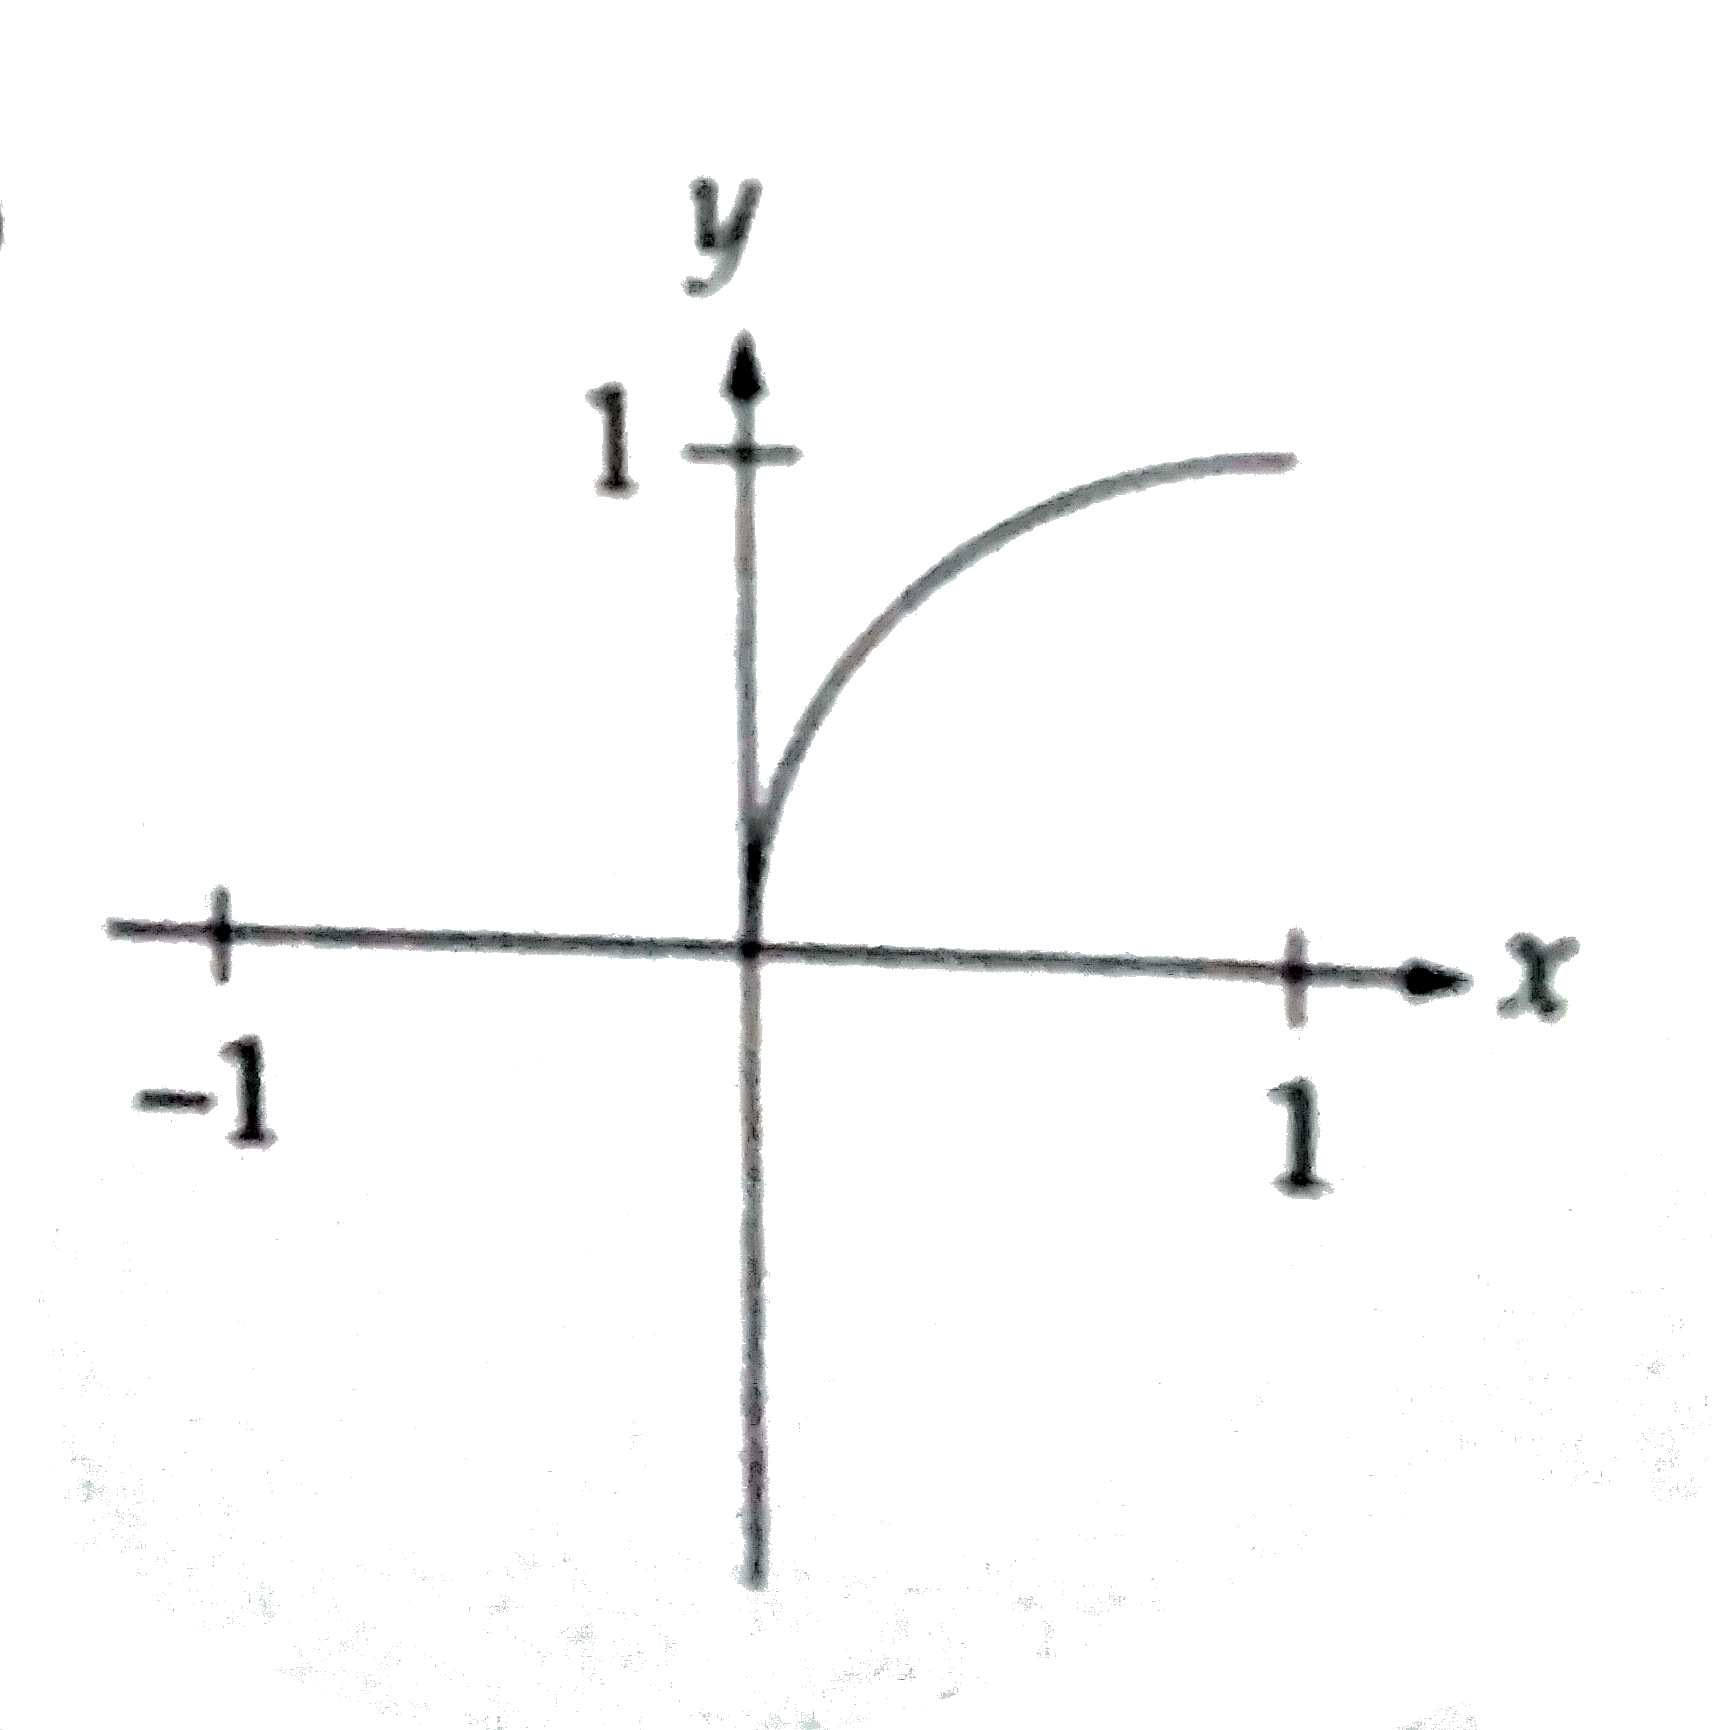 B
B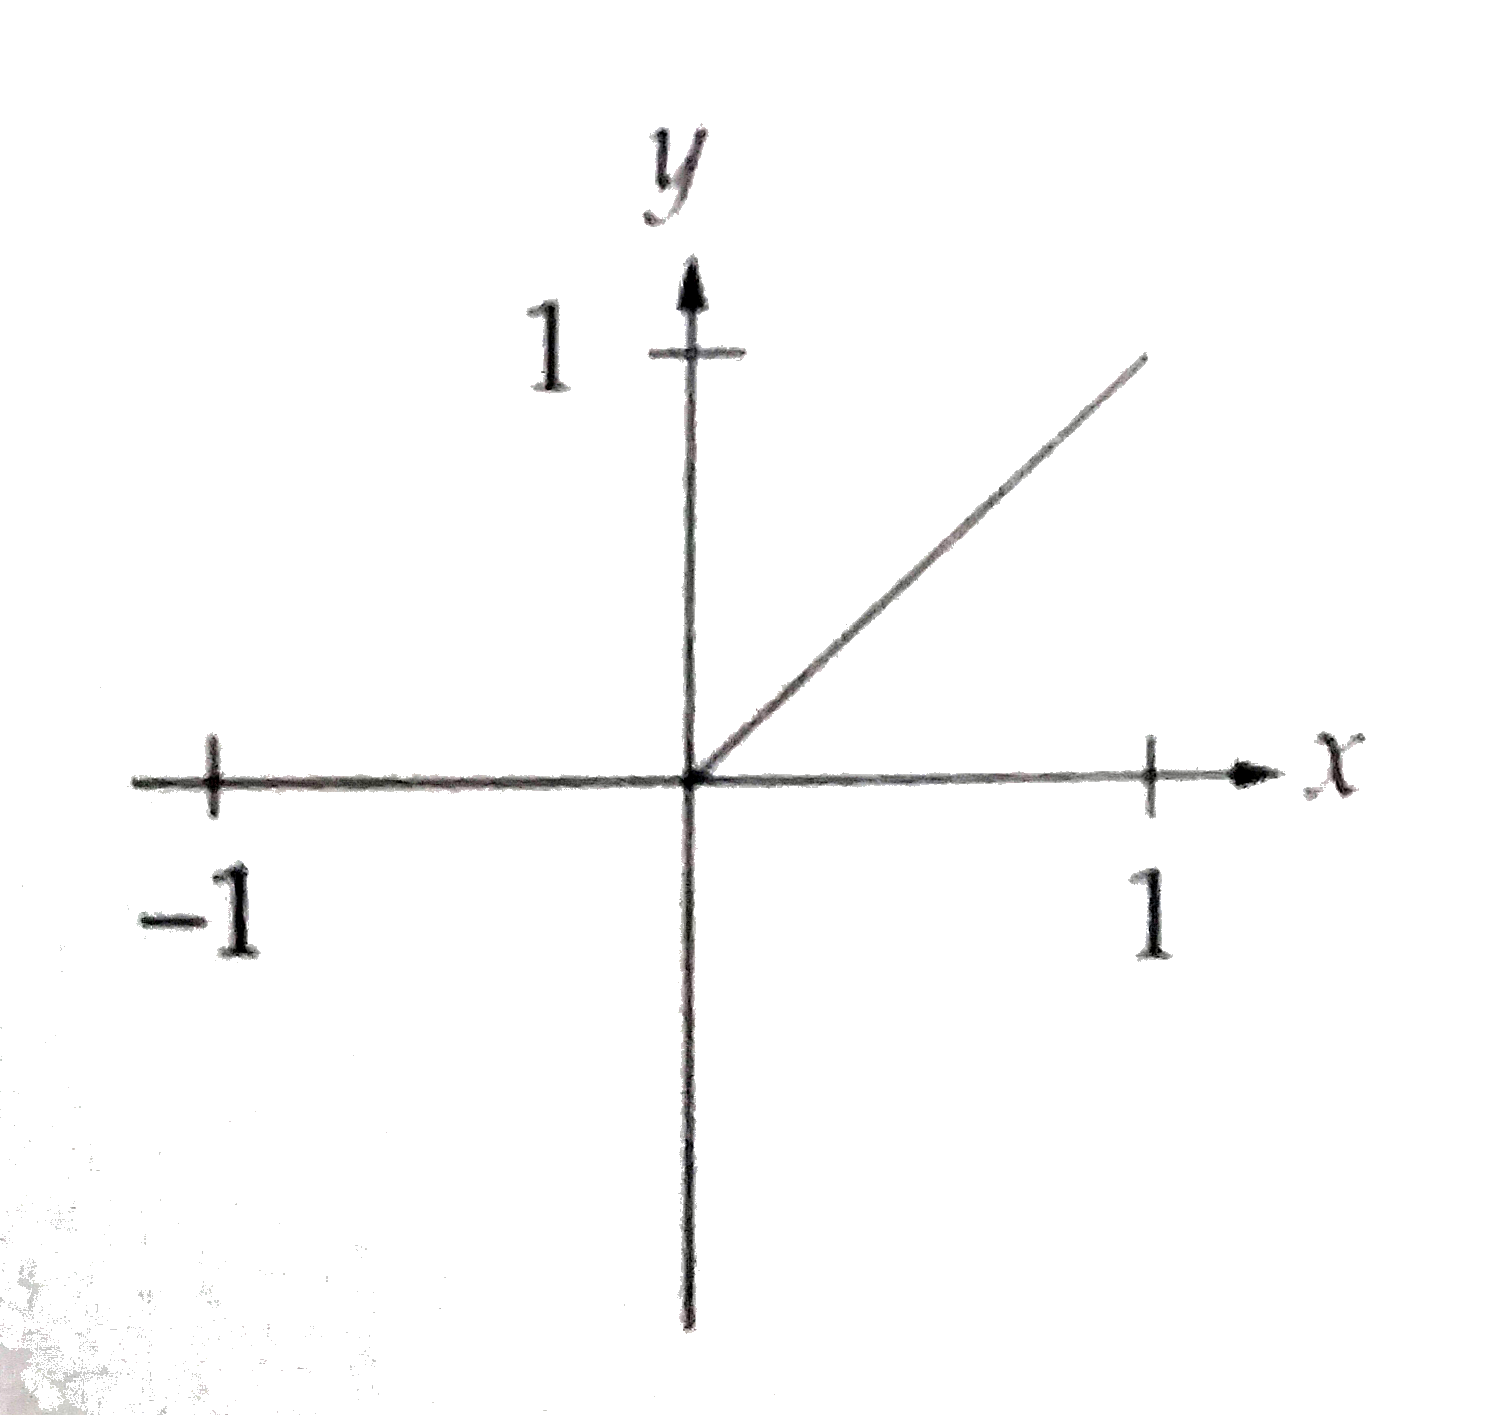 C
C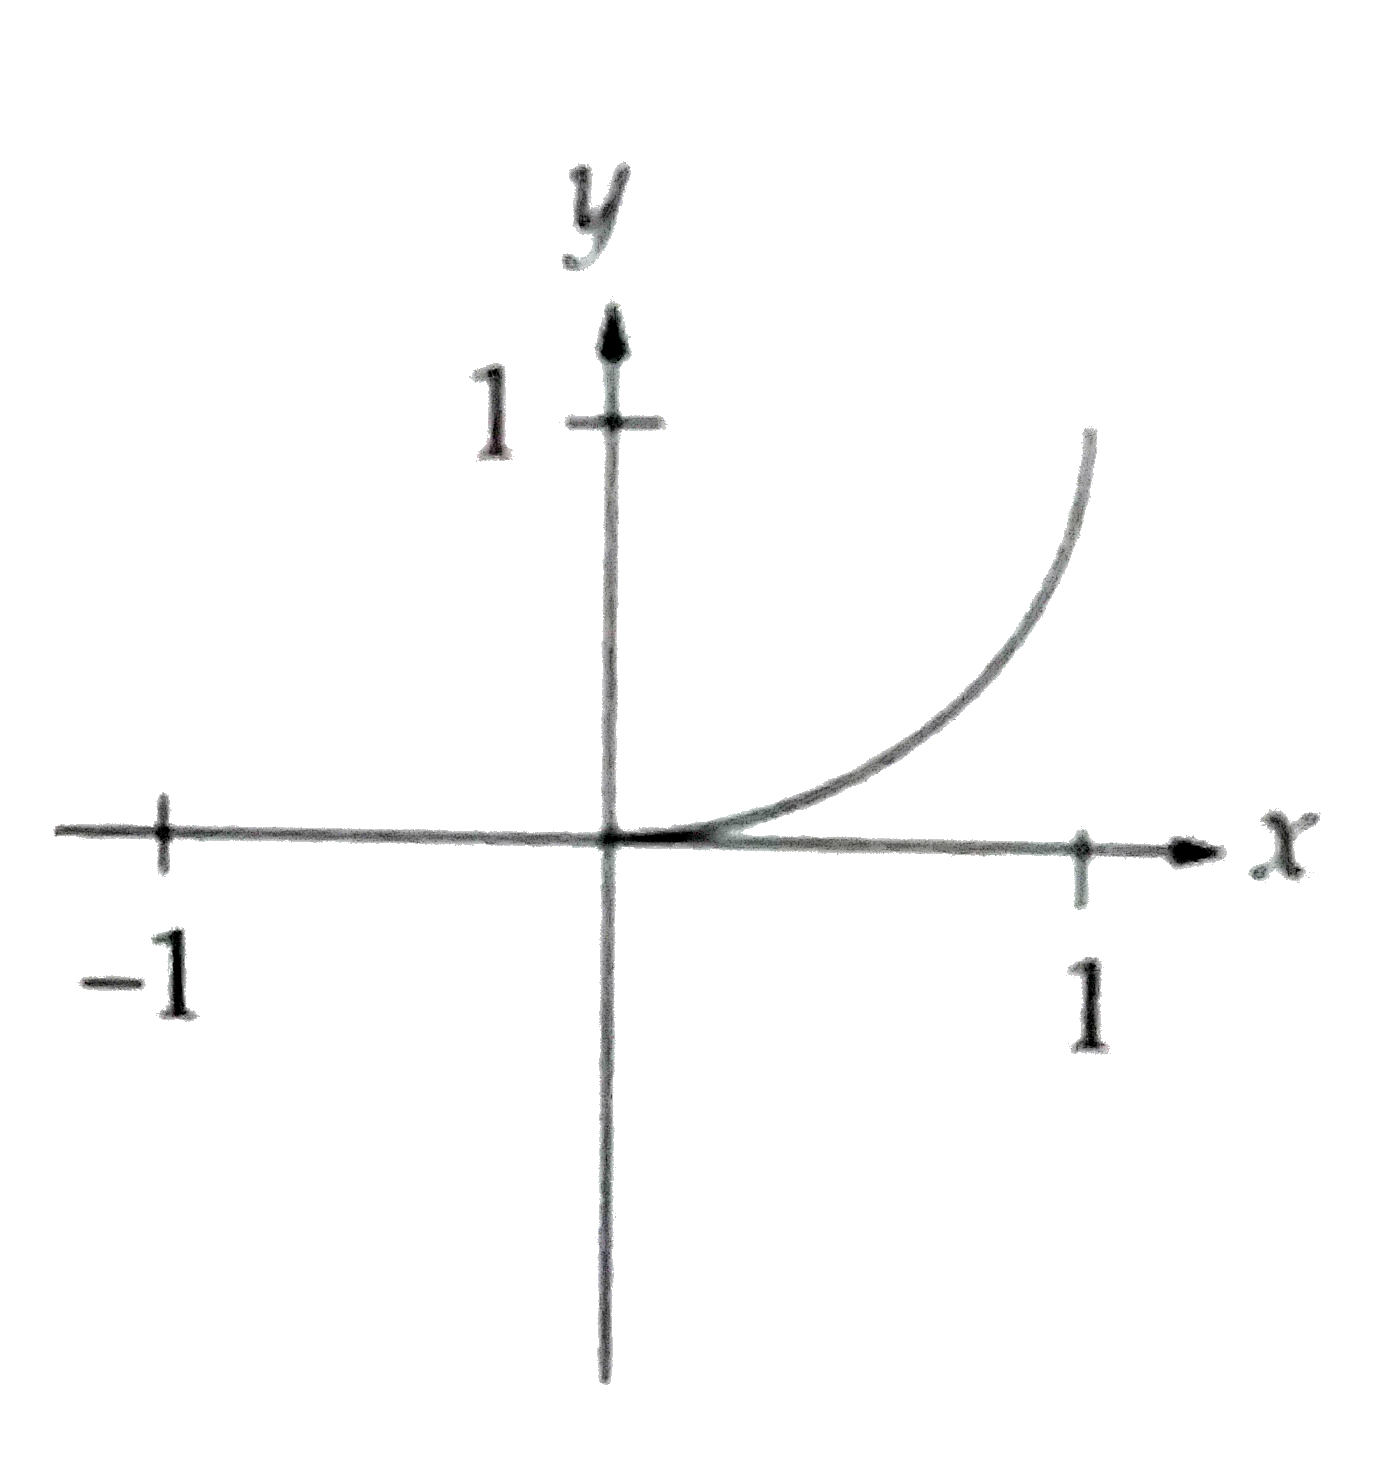 D
D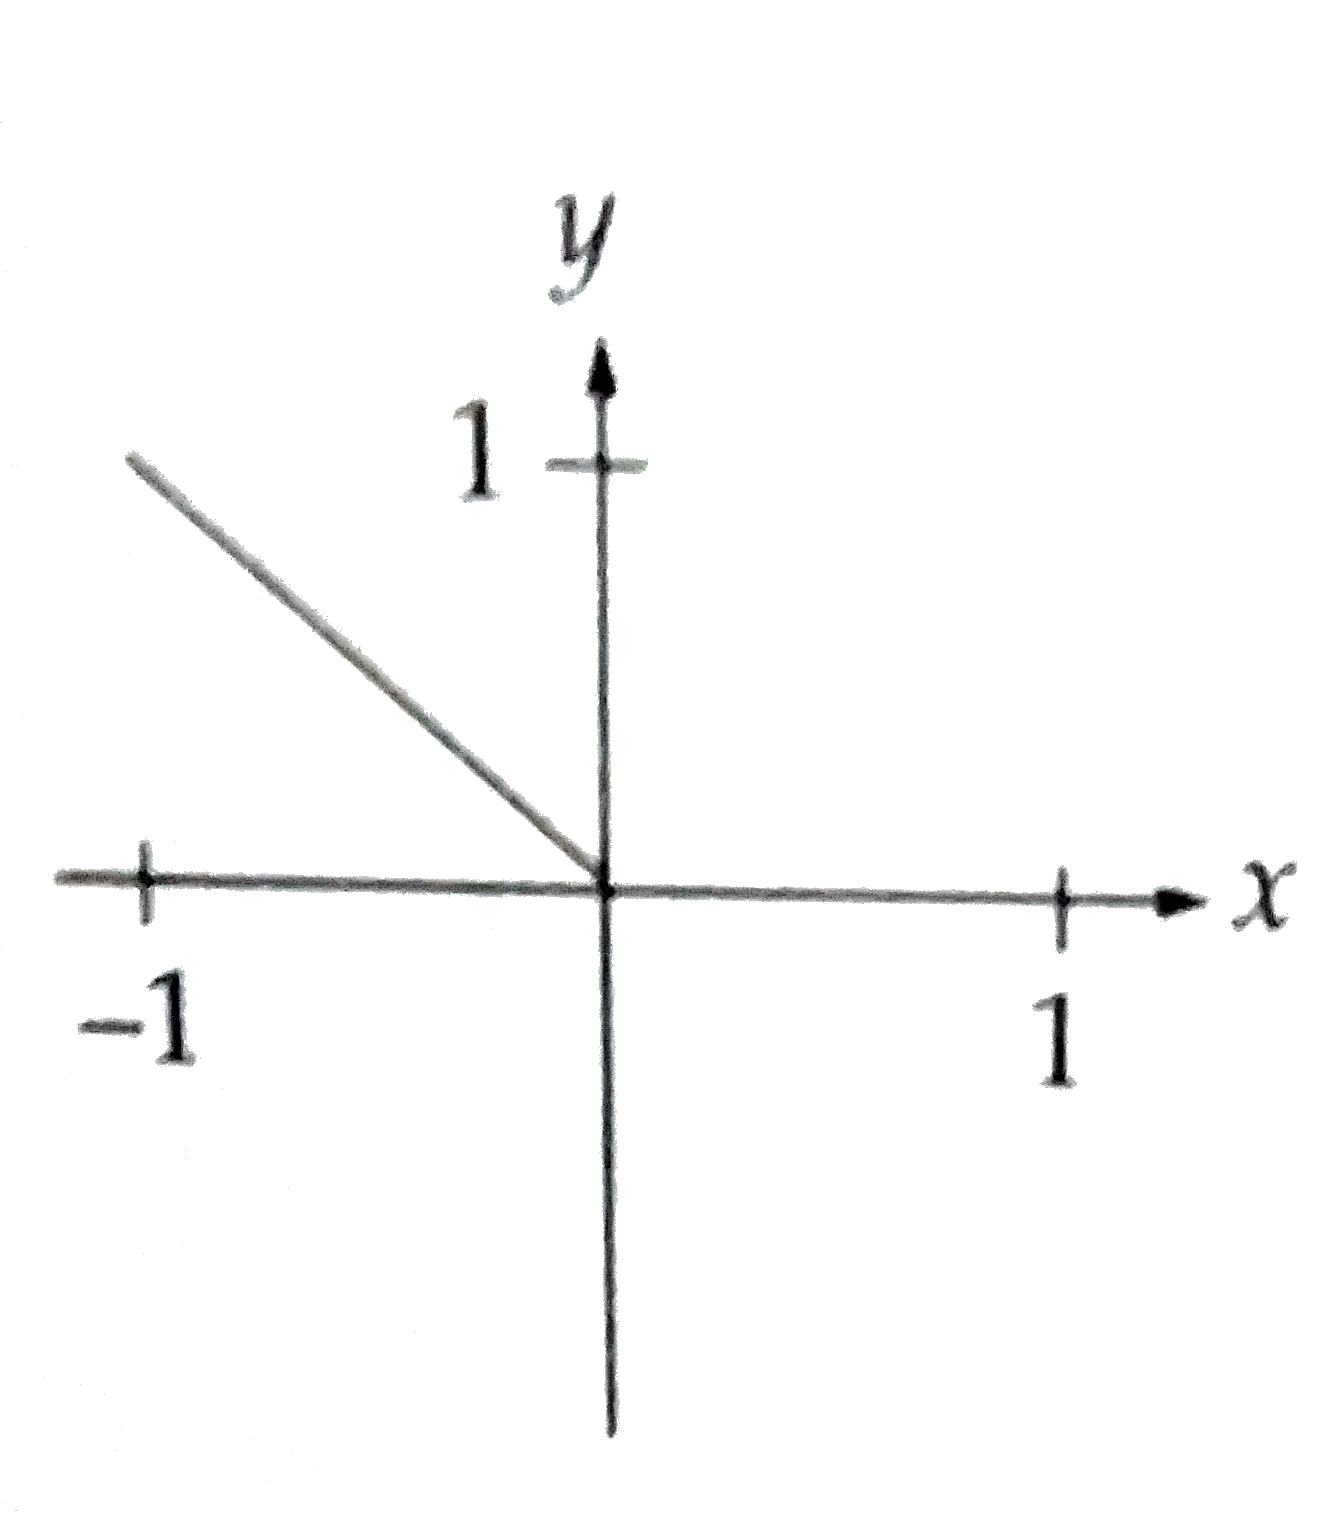
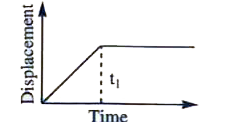
The x-t graph shown in figure represents

View SolutionThe x-t graph shown in figure represents.
View SolutionThe velocity of a particle is zero at t=0
View SolutionIf P to T are second period p-block elements then which of the following graph show corrrect relation between valence electrons in P2→T2
View SolutionTwo simple harmonic motion are represented by equations
y1=4sin(10t+ϕ)⇒y2=5cos10t
What is the phase difference between their velocities ?
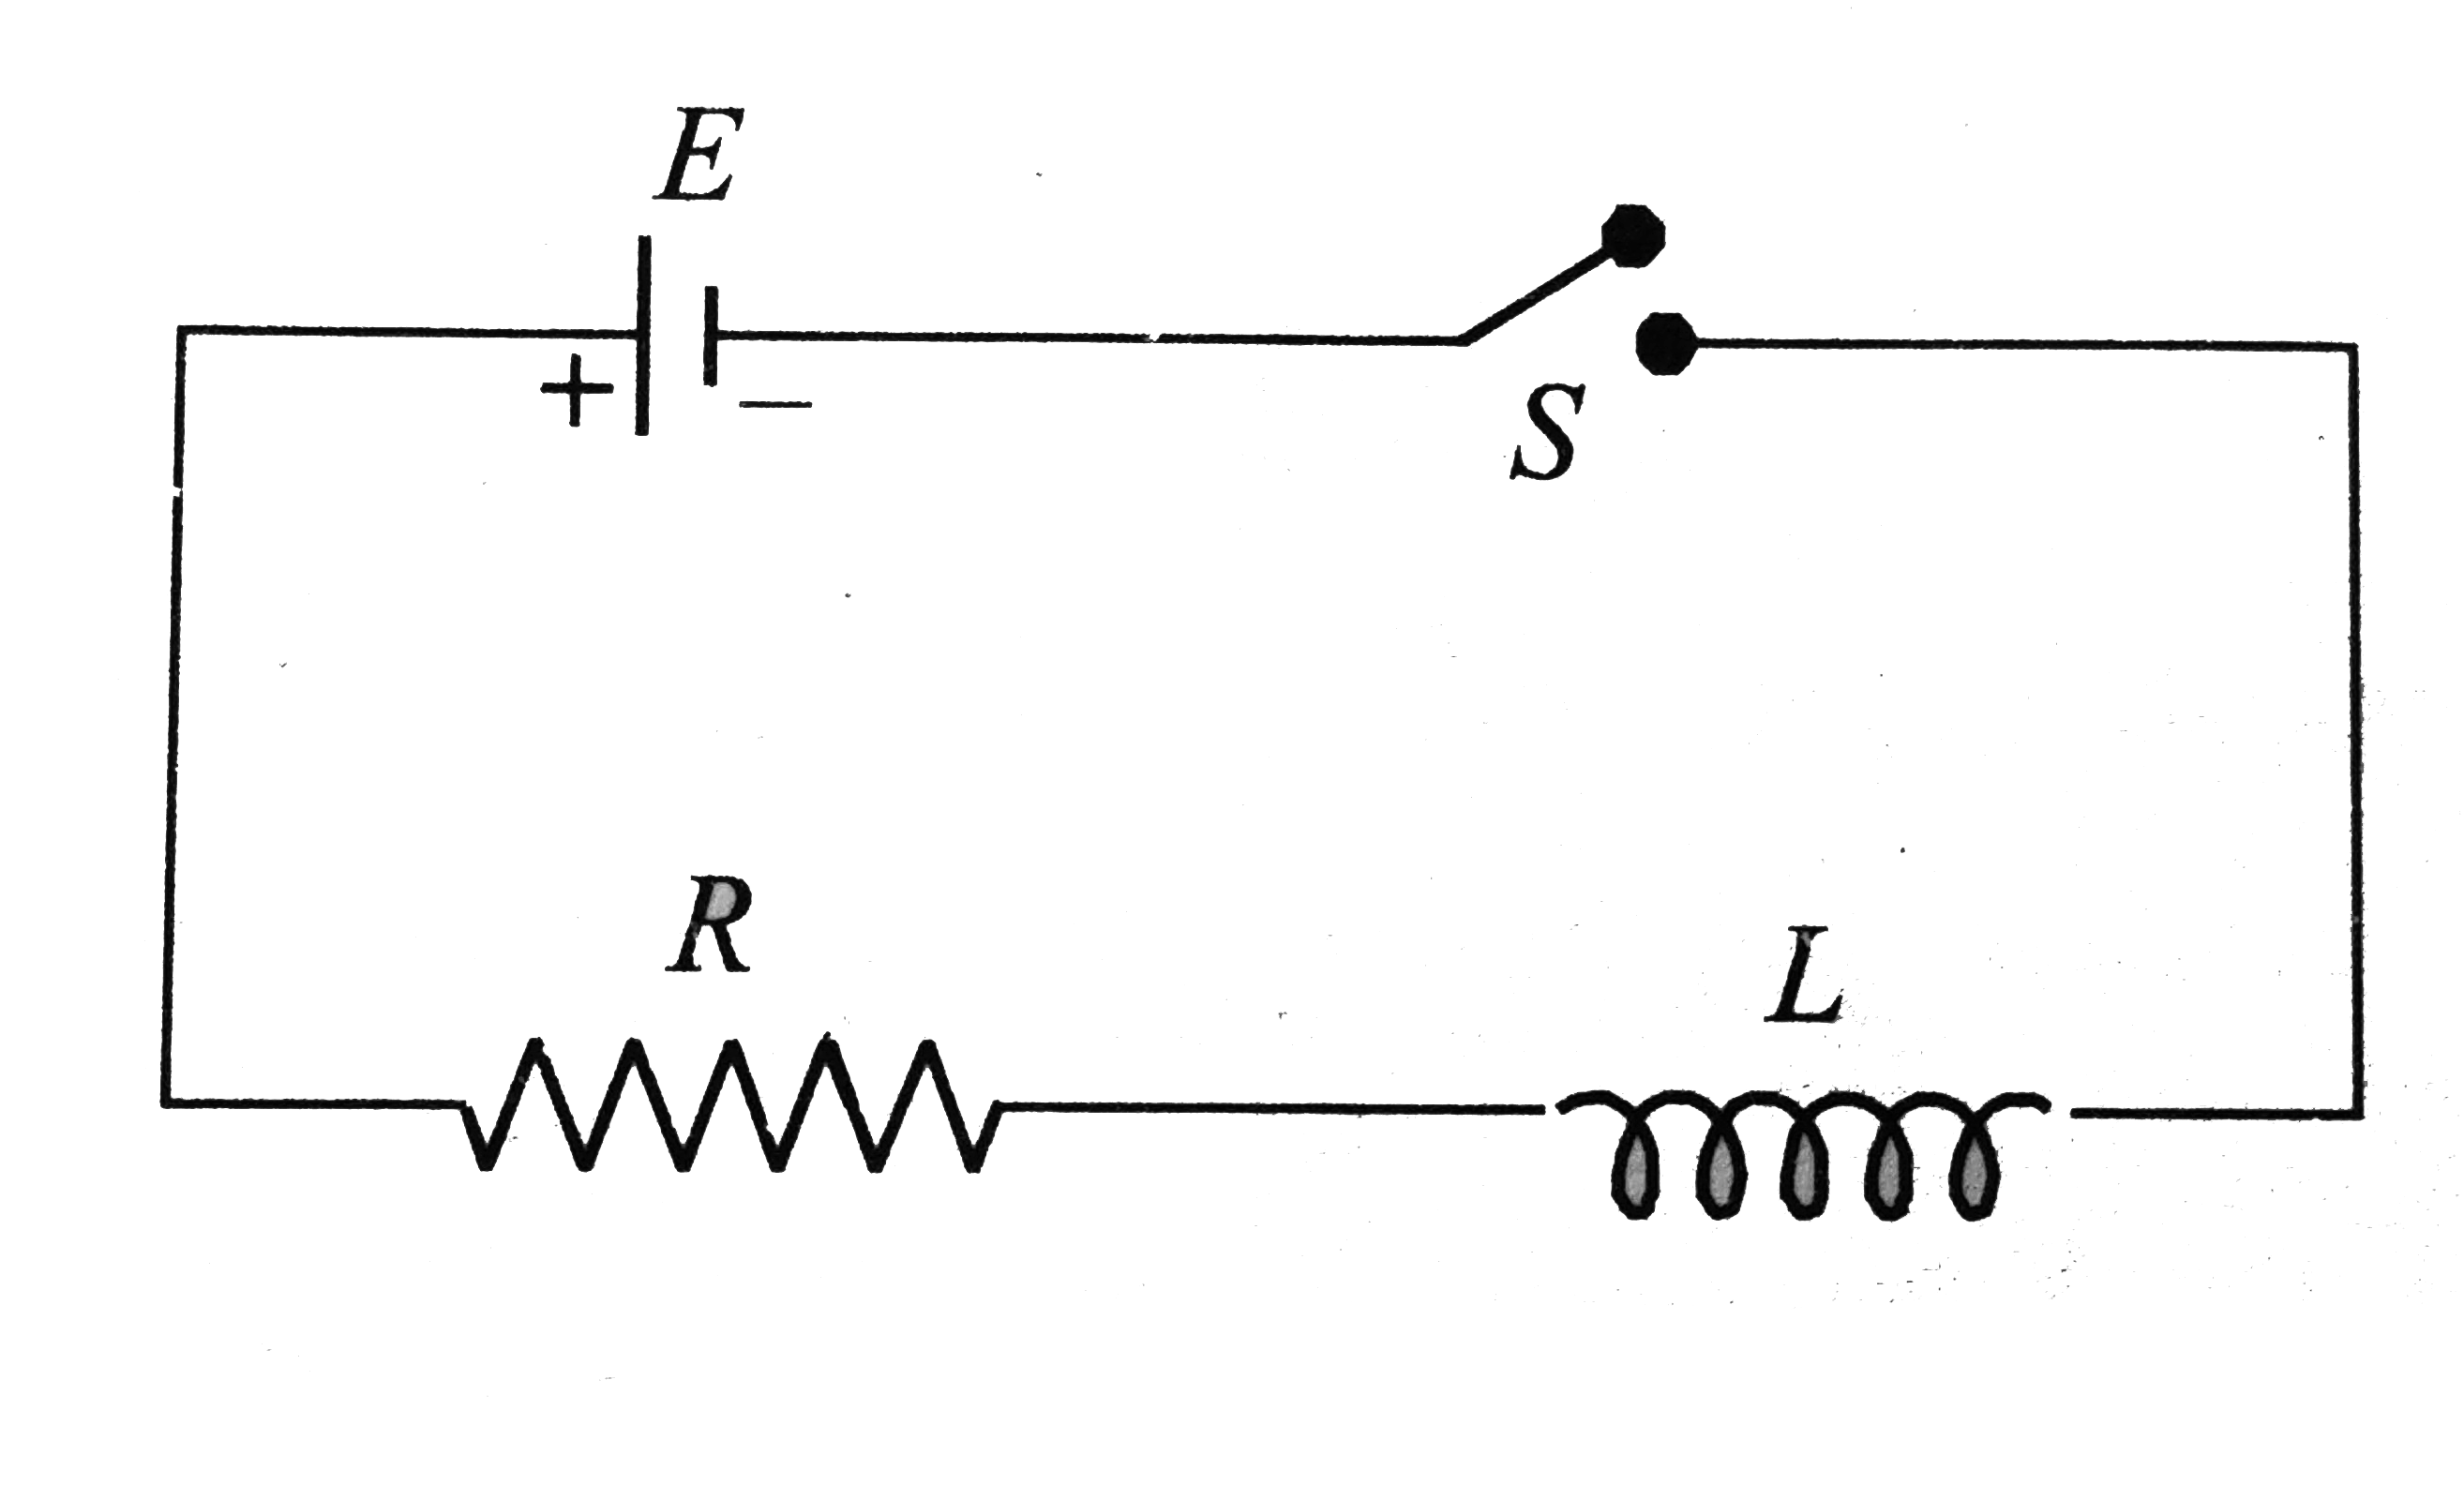
View SolutionSwitch S of the circuit shows in Fig. is closed at t=0. If e denotes the induced emf in L and i the current flowing through the circuit at time t, then which of the following graphs correctly represents the variation of e with i?
View Solution
