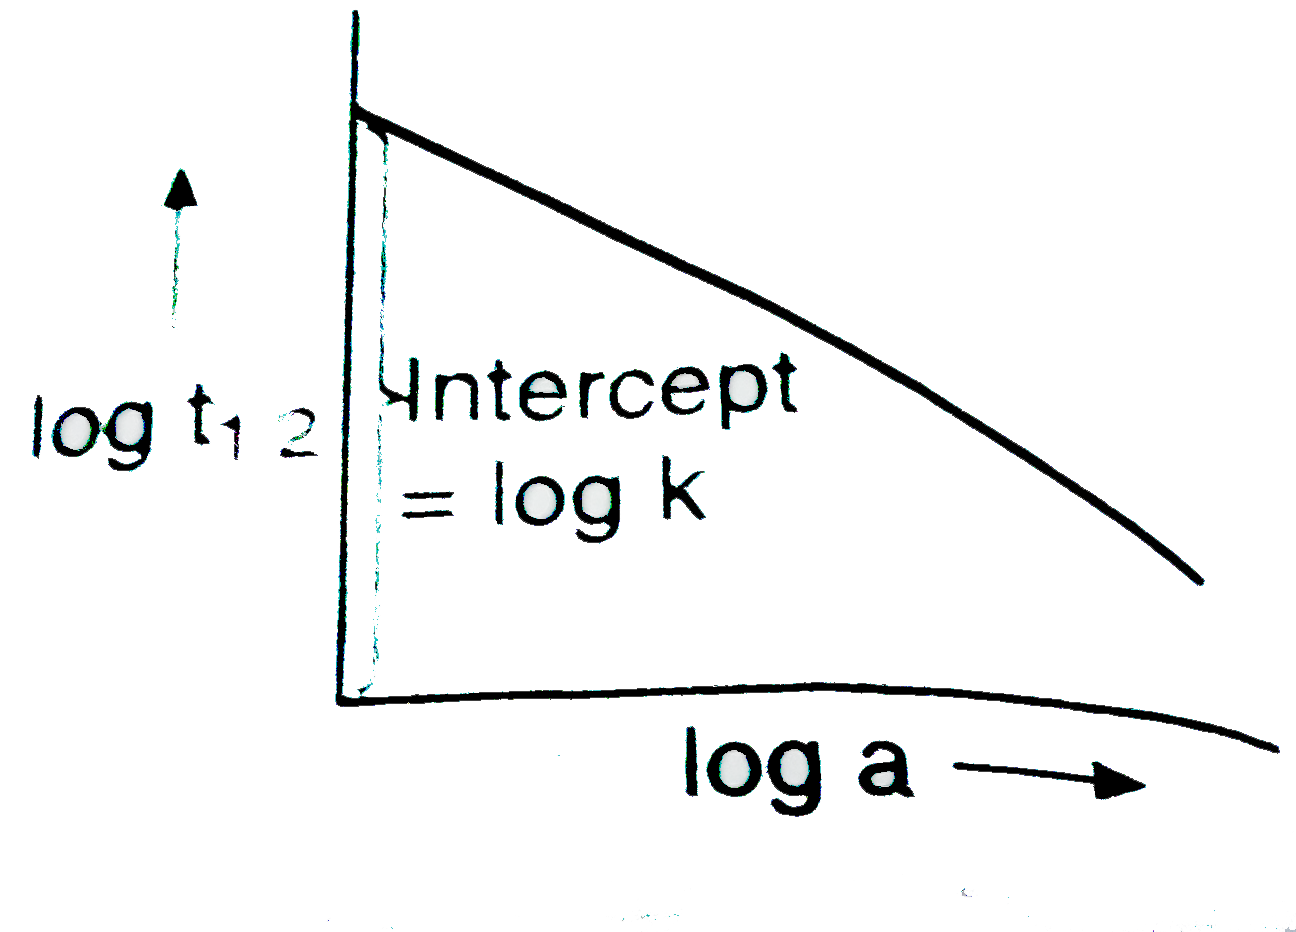
In a second order reaction, the plot of 1/(a−x) versus t is a straight line.
The correct Answer is:T
To solve the problem, we need to understand the relationship between the concentration of reactants in a second-order reaction and how it can be represented graphically. Here’s a step-by-step solution:
Step 1: Understand the Reaction
In a second-order reaction, we have a reactant A that is converting into products. The initial concentration of A is denoted as (A)0=a, and at time t, the concentration of A is (A)t=a−x, where x is the amount of A that has reacted.
Step 2: Write the Rate Law
For a second-order reaction, the rate law can be expressed as:
Rate=k(A)2
where k is the rate constant.
Step 3: Derive the Integrated Rate Equation
The integrated rate equation for a second-order reaction is:
1(A)t=1(A)0+kt
Substituting (A)t=a−x and (A)0=a into the equation gives:
1a−x=1a+kt
Step 4: Rearranging the Equation
Rearranging the equation, we can express it as:
1a−x=kt+1a
This can be rewritten in the form of y=mx+c:
- Let y=1a−x
- Let x=t
- The slope m=k
- The y-intercept c=1a
Step 5: Conclusion
The equation 1a−x=kt+1a shows that when we plot 1a−x versus time t, we will obtain a straight line with slope k and y-intercept 1a. Therefore, the statement in the question is true.
Final Answer
In a second-order reaction, the plot of 1(a−x) versus t is indeed a straight line.
---
In a second-order reaction, we have a reactant A that is converting into products. The initial concentration of A is denoted as (A)0=a, and at time t, the concentration of A is (A)t=a−x, where x is the amount of A that has reacted.
For a second-order reaction, the rate law can be expressed as:
Rate=k(A)2
where k is the rate constant.
The integrated rate equation for a second-order reaction is:
1(A)t=1(A)0+kt
Substituting (A)t=a−x and (A)0=a into the equation gives:
1a−x=1a+kt
Rearranging the equation, we can express it as:
1a−x=kt+1a
This can be rewritten in the form of y=mx+c:
- Let y=1a−x
- Let x=t
- The slope m=k
- The y-intercept c=1a
The equation 1a−x=kt+1a shows that when we plot 1a−x versus time t, we will obtain a straight line with slope k and y-intercept 1a. Therefore, the statement in the question is true.
In a second-order reaction, the plot of 1(a−x) versus t is indeed a straight line.
Topper's Solved these Questions
- CHEMICAL KINETICSBook:CENGAGE CHEMISTRY ENGLISHChapter:CHEMICAL KINETICSExercise:Archives Multiple Correct
Explore 5 Videos
- CHEMICAL KINETICSBook:CENGAGE CHEMISTRY ENGLISHChapter:CHEMICAL KINETICSExercise:Archives Single Correct
Explore 19 Videos
- CHEMICAL KINETICSBook:CENGAGE CHEMISTRY ENGLISHChapter:CHEMICAL KINETICSExercise:Exercises Fill In The Blanks
Explore 37 Videos
- CARBOXYLIC ACIDS AND THEIR DERIVATIVESBook:CENGAGE CHEMISTRY ENGLISHChapter:CARBOXYLIC ACIDS AND THEIR DERIVATIVESExercise:Exercises Archives (Analytical And Descriptive)
Explore 34 Videos
- COORDINATION COMPOUNDSBook:CENGAGE CHEMISTRY ENGLISHChapter:COORDINATION COMPOUNDSExercise:Archives Subjective
Explore 18 Videos
Similar Questions
Knowledge Check
Assertion:A constant volume gas thermometer, reads temperature in terms of pressure.
Reason : In this case a plot of Pressure versus temperature gives a straight line.AIf both assetion and reason are true and reaasons is the correct expanation of assetionBIf both assetion and reason are tur but reason is not the correct explanation of assetionCIf assertion is true but reason is falseDIf both assertion and reason are false.
For a second order reaction, 2A→ Products, a plot of log t1/2 vs log a (where a is initial concentration) will give an intercept equal to which one of the following?

View SolutionRate constant k of a reaction varies with temperature according to the equation
logk = constant −Ea2.303R(1T)
where Ea is the energy of activation for the reaction . When a graph is plotted for log k versus 1T , a straight line with a slope - 6670 K is obtained. Calculate the energy of activation for this reaction
View SolutionRate constant k of a reaction varies with temperature according to equation:
logk= constant −Ea2.303R.1T
What is the activation energy for the reaction. When a graph is plotted for log k versus 1T a straight line with a slope-6670 K is obtained. Calculate energy of activation for this reaction (R=8.314 JK−1mol− 1)
View SolutionFor the second order reaction, concentration (x) of the product at time t starting with initial concentration [A]o is :
View SolutionThe plot of In k versus 1T is liner with slope of
View Solution