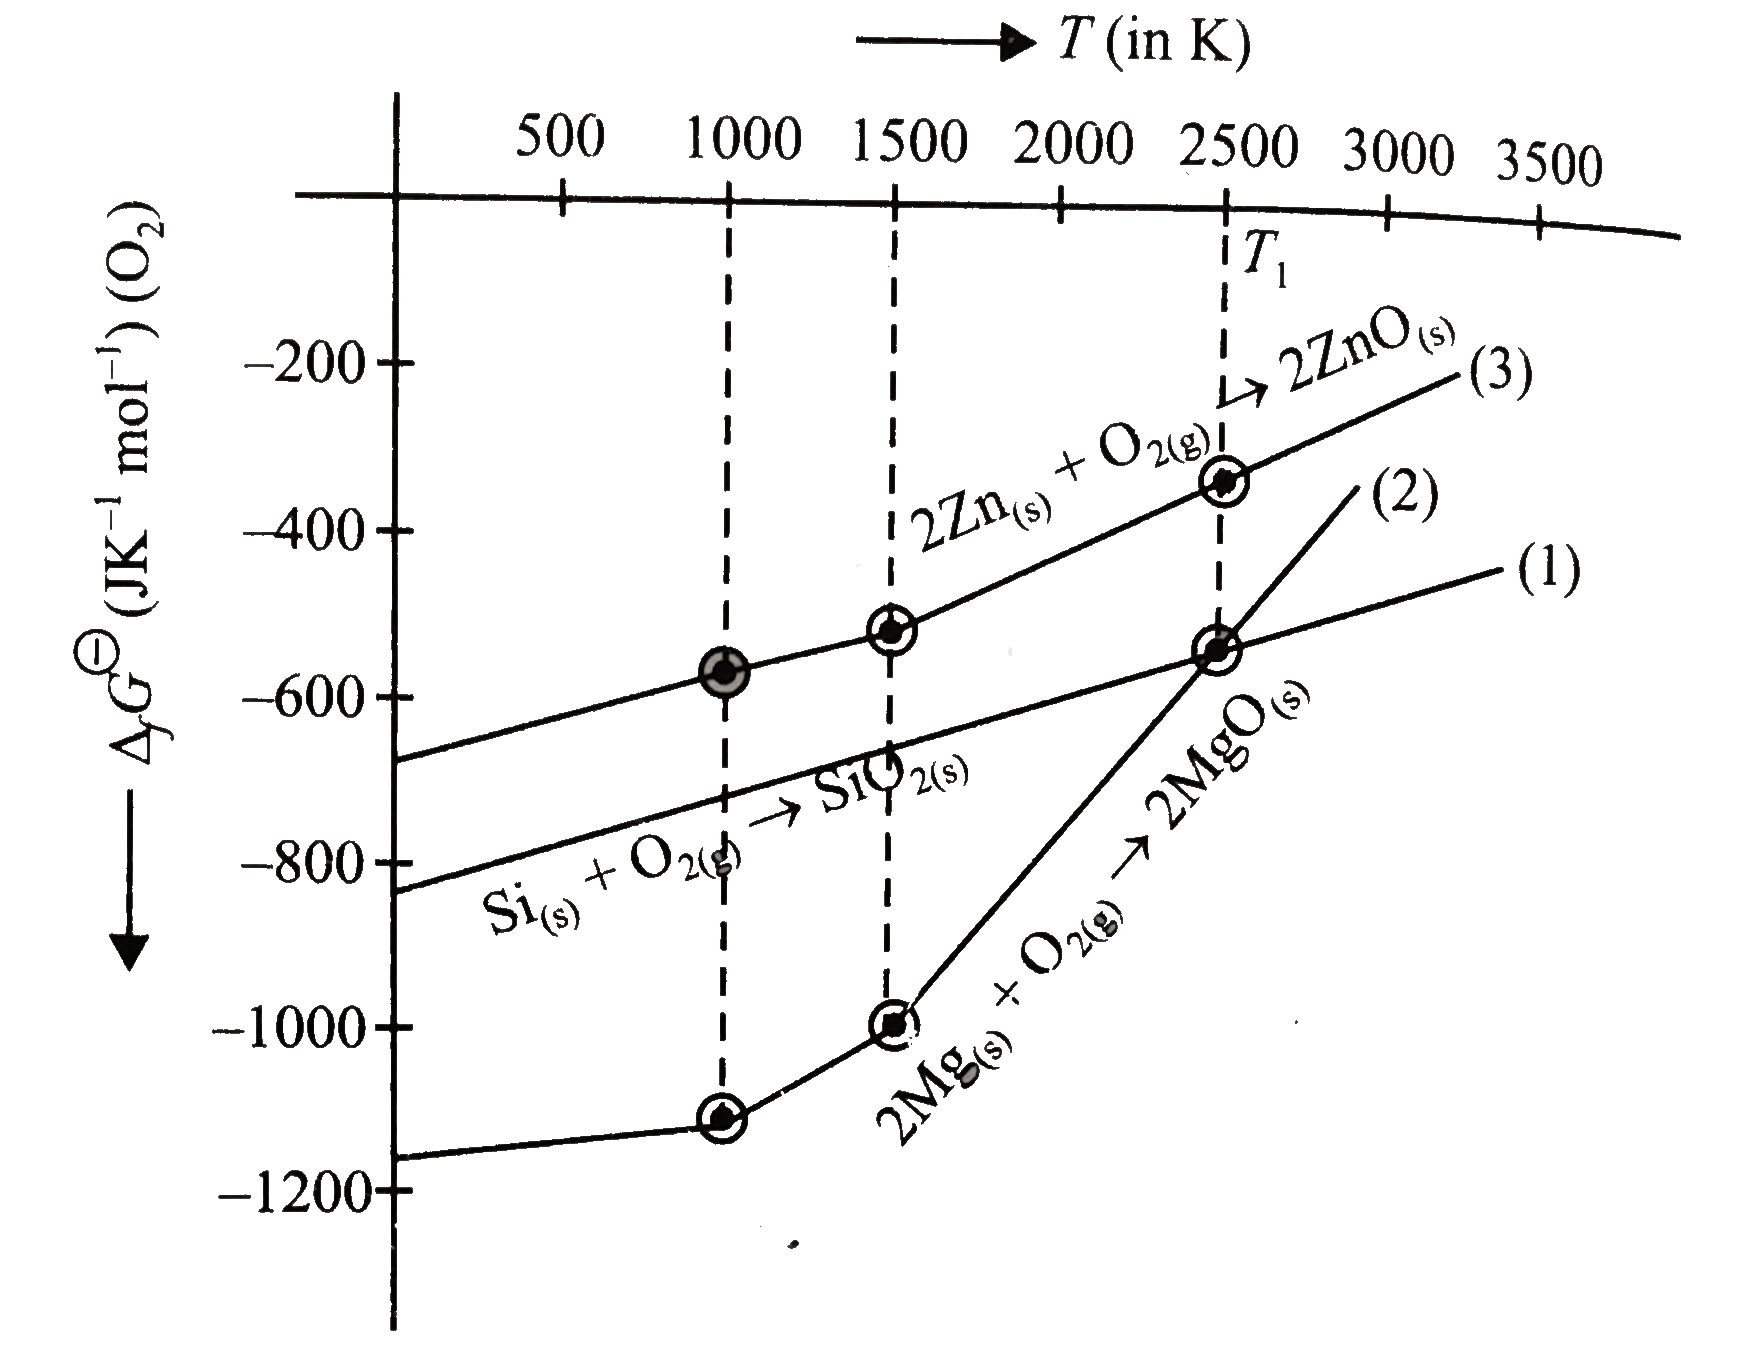
Interpret 2 points from the following Ellingham diagram.
 .
.
Video Solution
Text Solution
(1)
As temperature increases, becomes less negative , hence becomes less stable, i.e., at is more stable than .
(2)
Abrupt changes in the plot at and denote phase change//transition from and , respectively and represent melting point and boiling point . becomes less stable with increase in temperature.
At , lines of and intersect. One can conclude the following :
(a) At , both and are equally stable.
(b) At temperature is less stable than Hence, will reduce to .
( c) At temperature is less stable than .
Hence, will reduce to
Relative stability of and at given temperature can be predicted with the help of Ellingham diagram.
(3)
Hence, both and can be used as reducing agent for reducing to .
|
Topper's Solved these Questions
- GENERAL PRINCIPLES AND PROCESS OF ISOLATION OF ELEMENTSBOOK - CENGAGE CHEMISTRY ENGLISHCHAPTER - GENERAL PRINCIPLES AND PROCESS OF ISOLATION OF ELEMENTSEXERCISE - Solved Example
25 Videos
- GENERAL PRINCIPLES AND PROCESS OF ISOLATION OF ELEMENTSBOOK - CENGAGE CHEMISTRY ENGLISHCHAPTER - GENERAL PRINCIPLES AND PROCESS OF ISOLATION OF ELEMENTSEXERCISE - Exs 1.1 (Subjective)
25 Videos
- ELECTROCHEMISTRYBOOK - CENGAGE CHEMISTRY ENGLISHCHAPTER - ELECTROCHEMISTRYEXERCISE - Archieves Subjective
35 Videos
- GRIGNARD REAGENTS AND ORGANOMETALLIC REAGENTSBOOK - CENGAGE CHEMISTRY ENGLISHCHAPTER - GRIGNARD REAGENTS AND ORGANOMETALLIC REAGENTSEXERCISE - Exercises Archives (Linked Comprehension)
1 Videos
Similar Questions
Knowledge Check
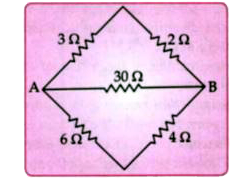
Calculate the equivalent resistance between A and B from the following diagram :
 A5B3C8D4
What is Ellingham diagram?
View SolutionCalculate the equivalent resistance between P and Q from the following diagram

View SolutionChoose the correct statement(s) from the following option for given diagram

View Solution
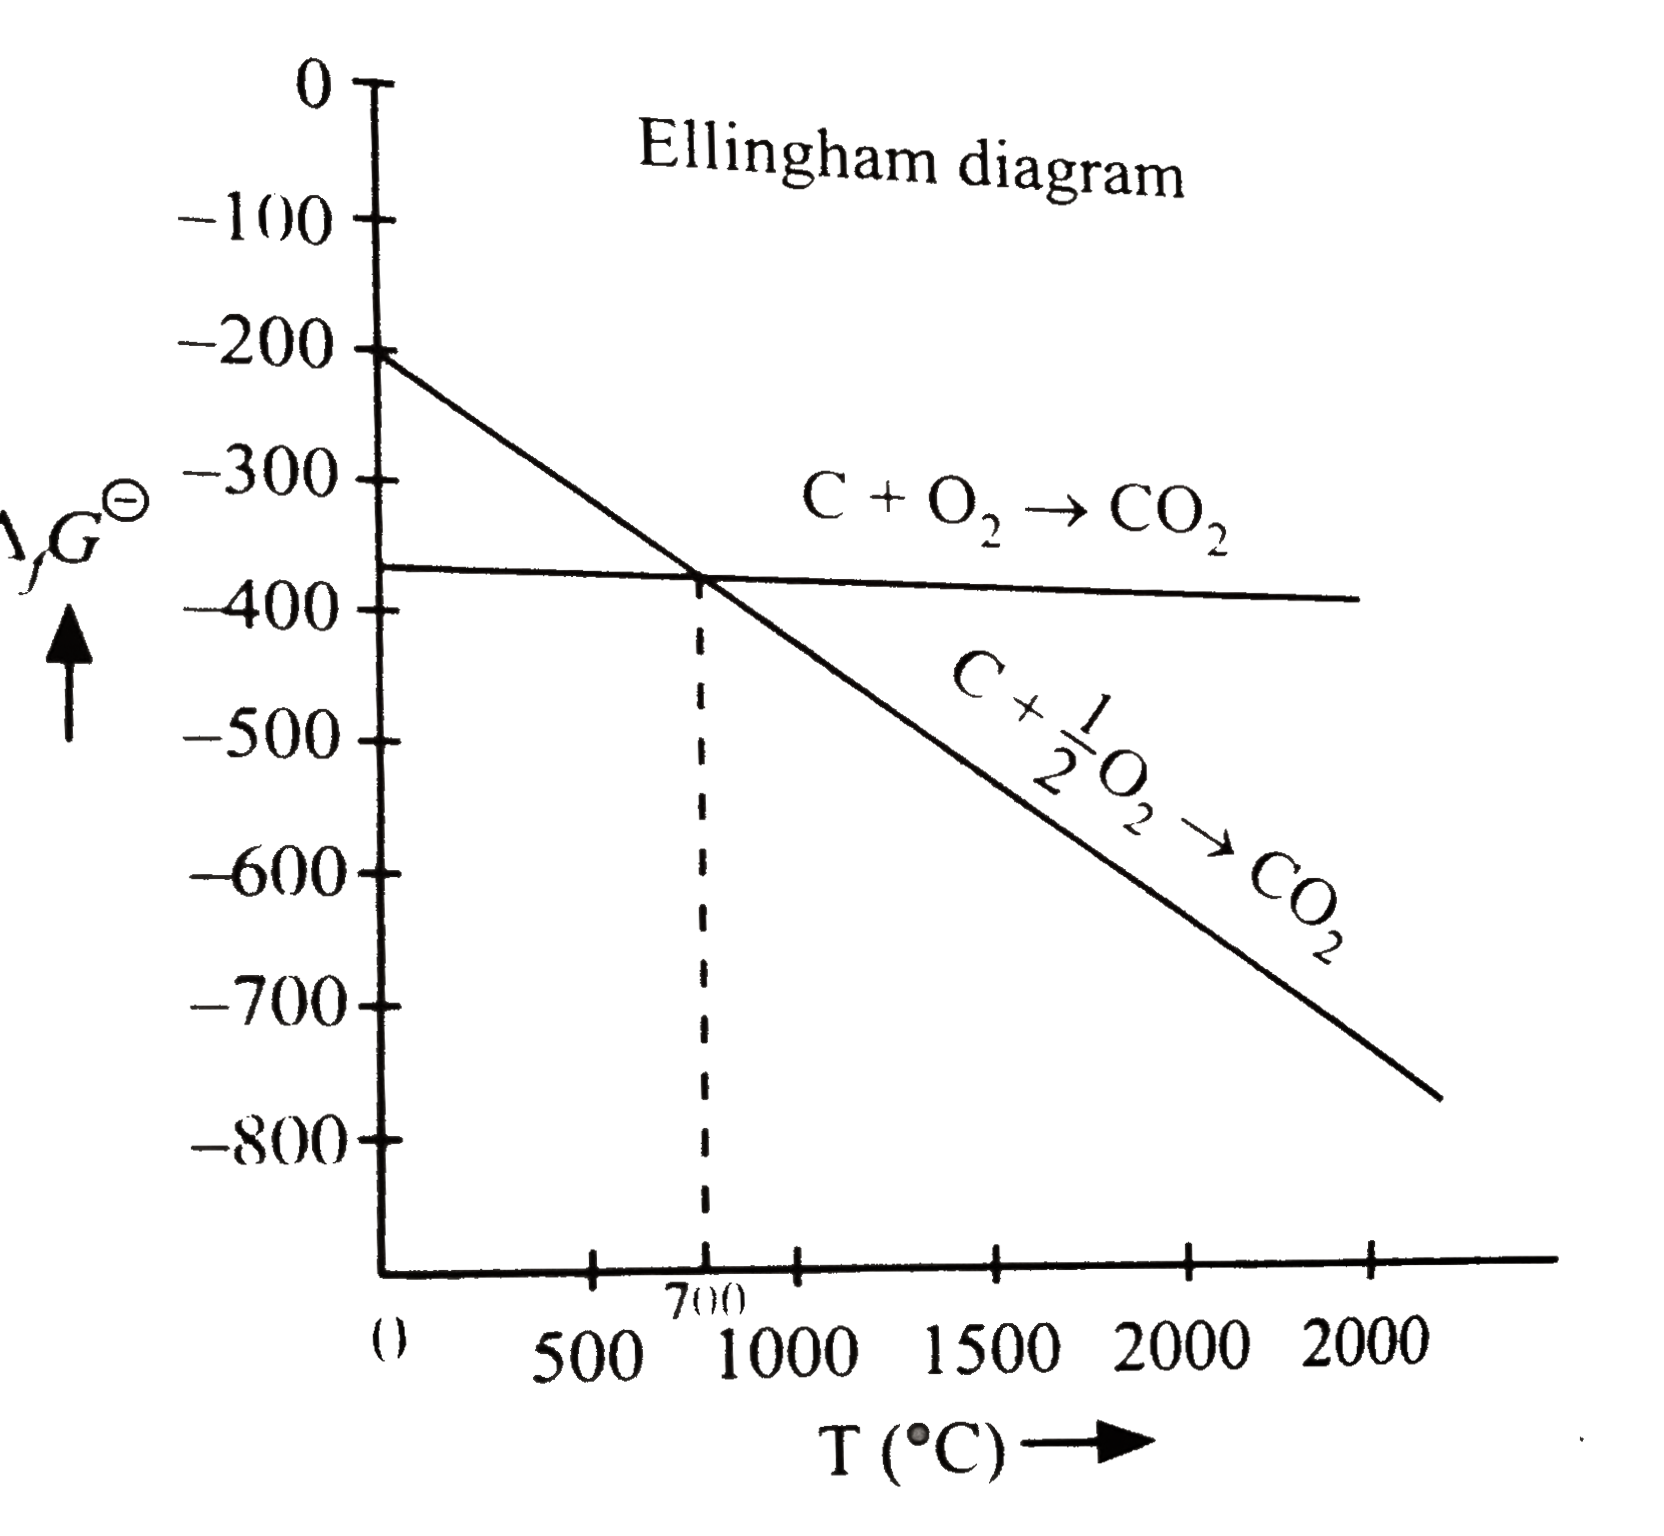
Which of the following is incorrect on the basic of the above Ellingham diagram for carbon ?
View SolutionCalculate the equivalent resistance between P and Q from the following diagram:

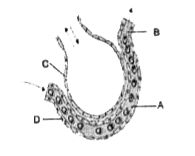
View SolutionIdentify simple squamous epithelium of alveolus from the following diagram.

View SolutionFrom the following V−T diagram we can conclude:-
_E01_054_Q01.png)
View Solution
