From the following V−T diagram we can conclude:-
_E01_054_Q01.png)
P1=P2
P1>P2
P1<P2
can't be say anything
The correct Answer is:C
Here V=aT+b where a, b>0
So P=nRTaT+b=−nRa+b/T but bT2<bT1 so P2>P1
Topper's Solved these Questions
- BOOK - ALLENCHAPTER - GEOMETRICAL OPTICSEXERCISE - EXERCISE -0282videos
GEOMETRICAL OPTICS
- BOOK - ALLENCHAPTER - GEOMETRICAL OPTICSEXERCISE - EXERCISE -0310videos
GEOMETRICAL OPTICS
- BOOK - ALLENCHAPTER - GEOMETRICAL OPTICSEXERCISE - SOME WORKED OUT EXAMPLES83videos
GEOMETRICAL OPTICS
- BOOK - ALLENCHAPTER - CURRENT ELECTRICITYEXERCISE - EX.II66videos
CURRENT ELECTRICITY
- BOOK - ALLENCHAPTER - GRAVITATIONEXERCISE - EXERCISE 49videos
GRAVITATION
Similar Questions
In the following P-V diagram two adiabatics cut two isothermals at temperature T1andT2 (fig). The value of VaVd will be
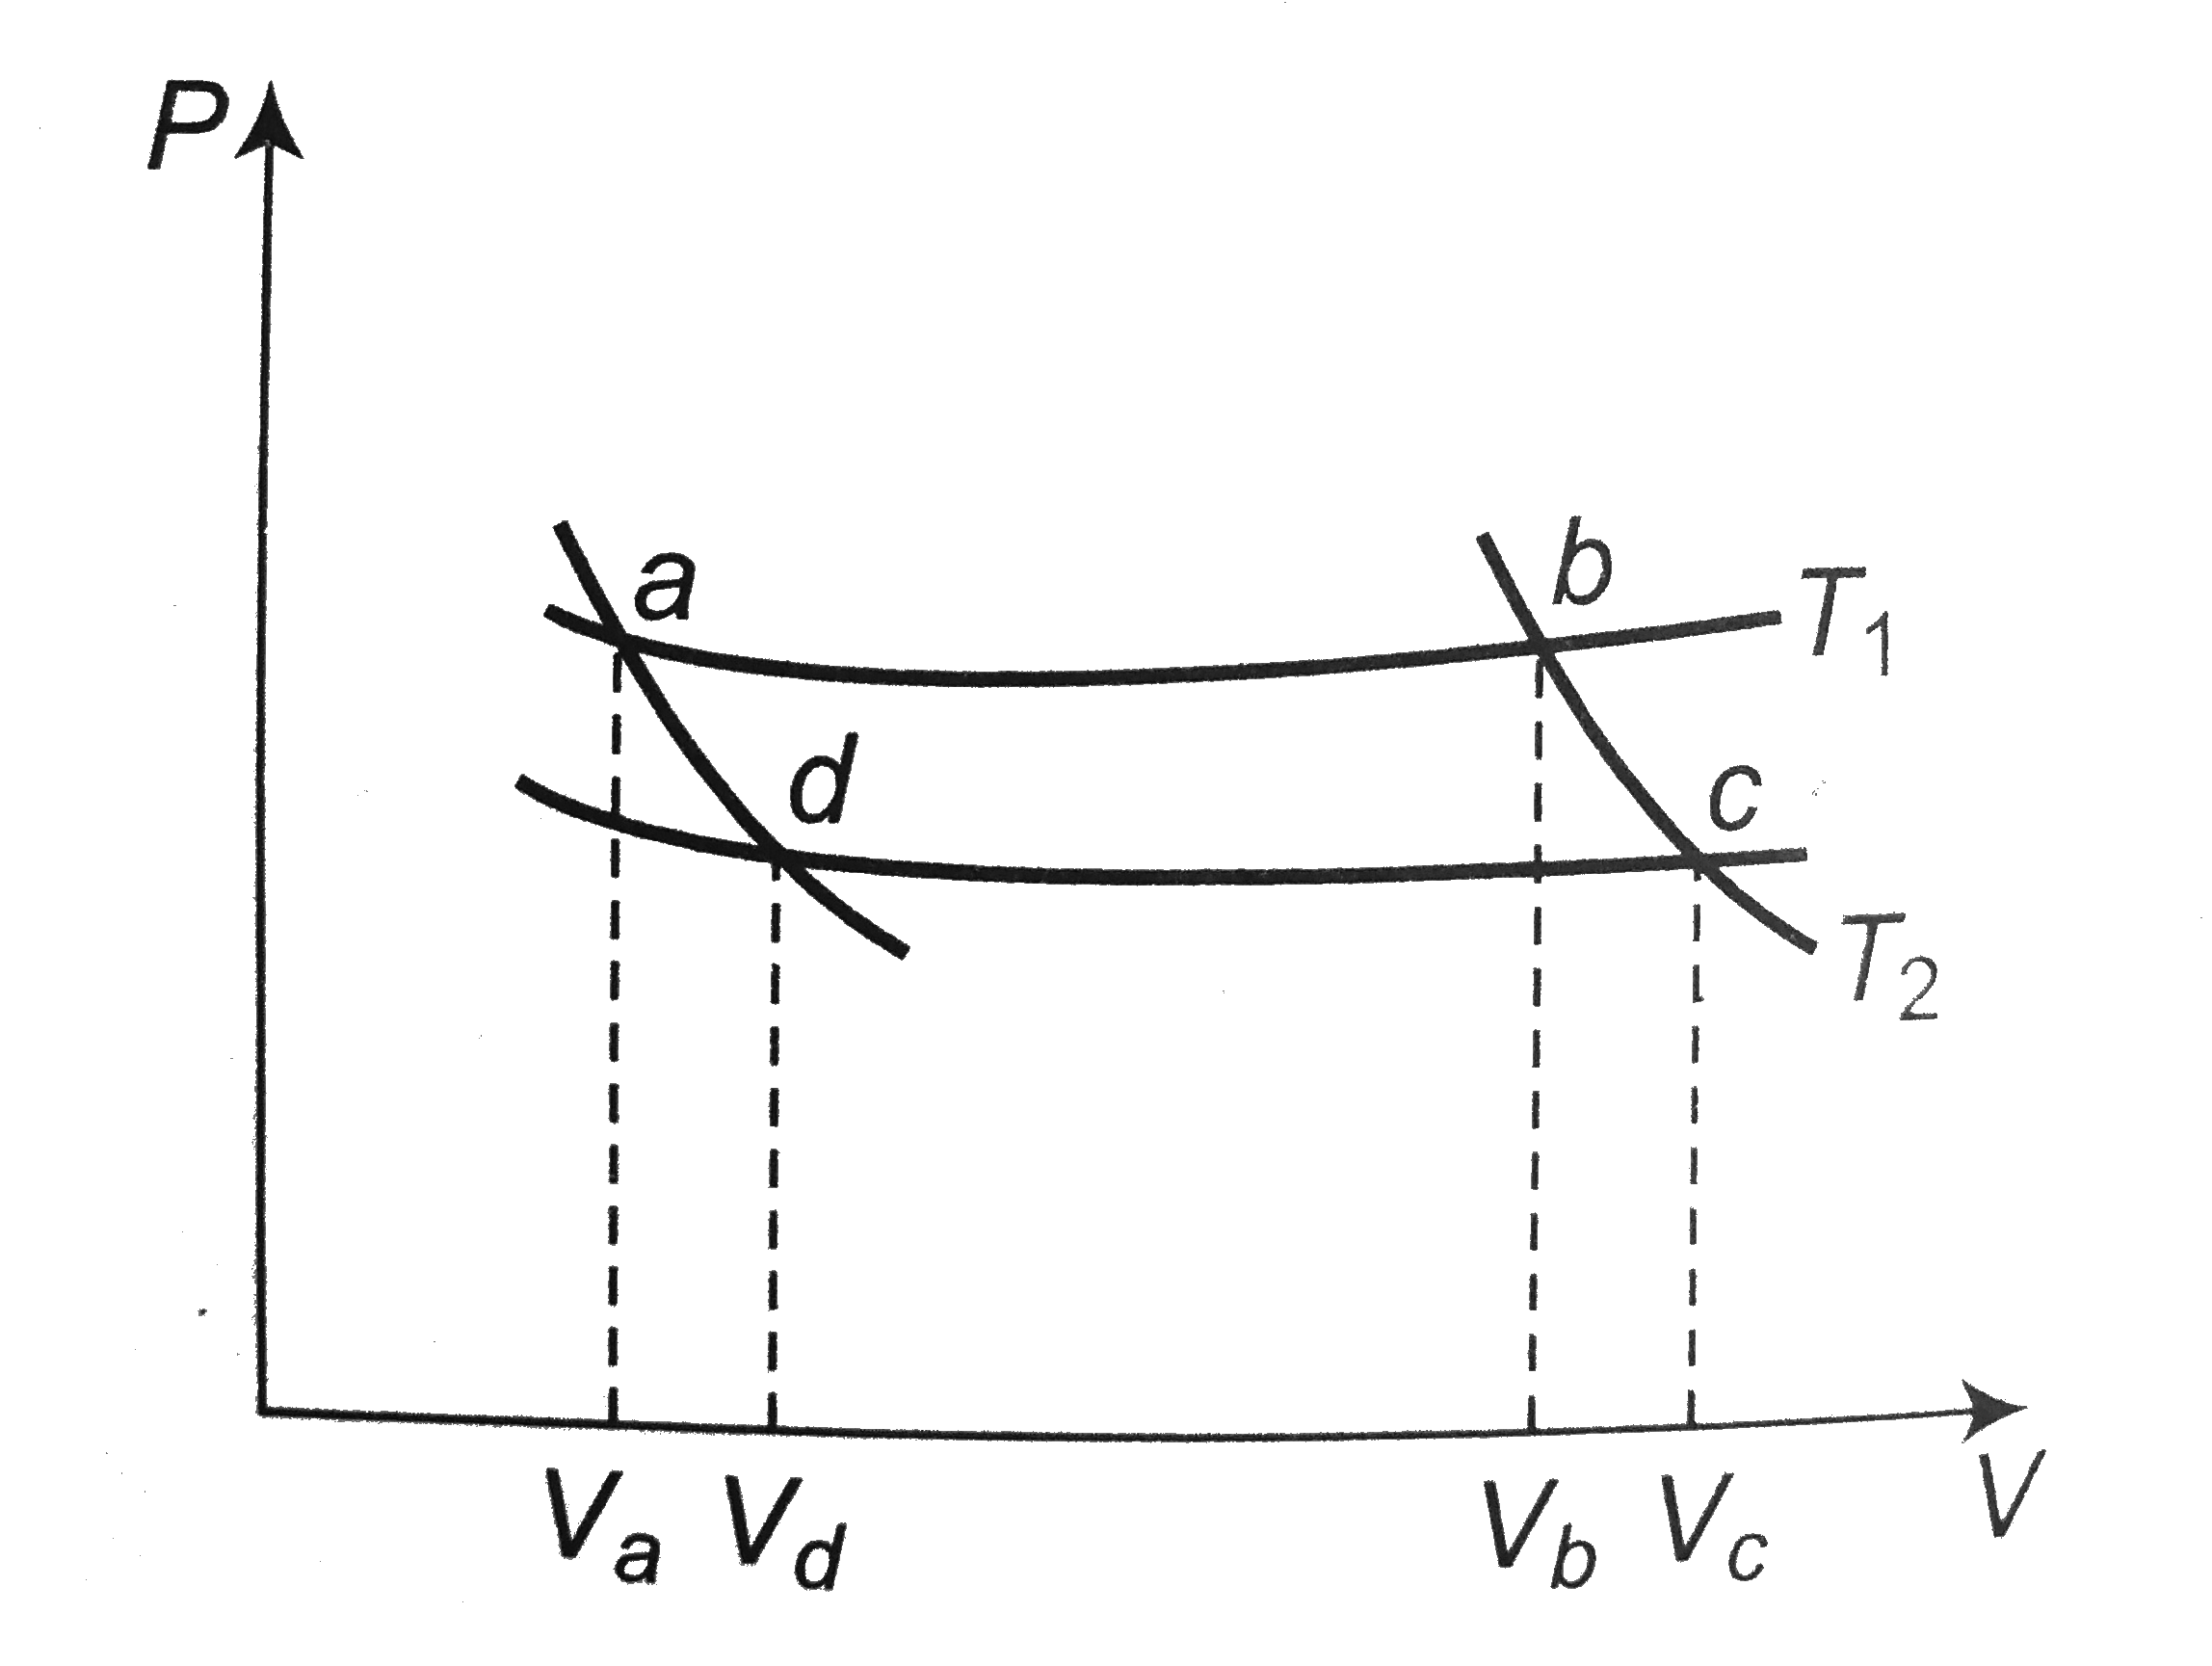 View Solution
A thin bi-convex lens made out of a material of refractive index μ1 is place in a medium of refractive index μ2. A paraxial beam of light, parallel to the principal axis of the lens, is shown in the figure. Based on the ray diagram, we can conclude that
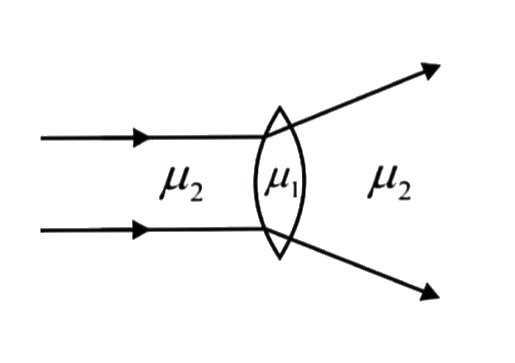 View Solution
Knowledge Check
- Question 1 - Select One
Consider p-V diagram for an ideal gas shown in figure.
Out of the following diagrams, which figure represents the T−p diagram ?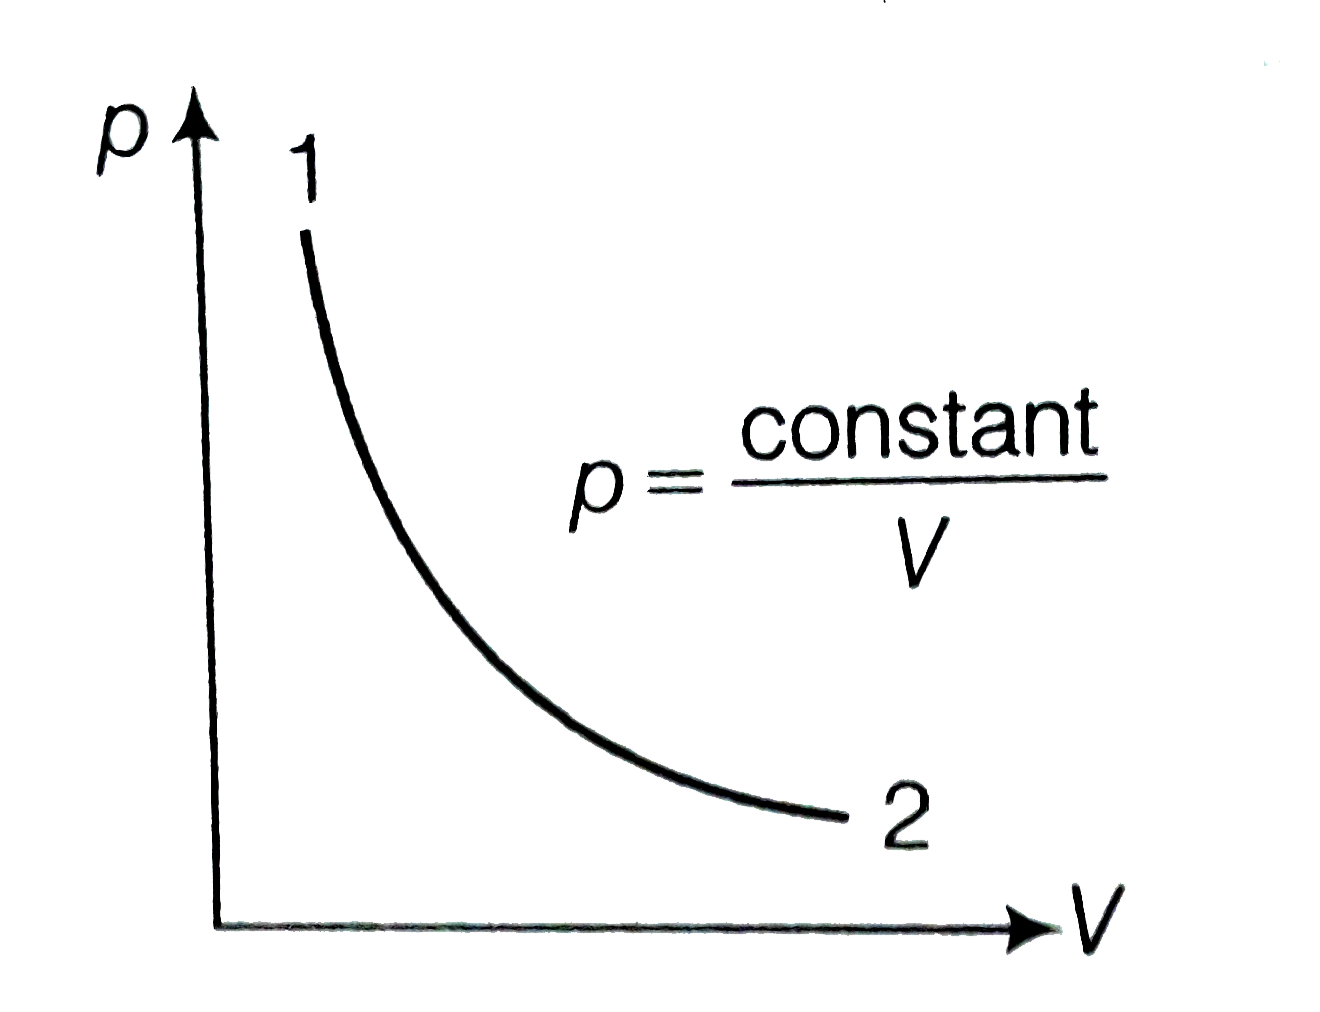
(i)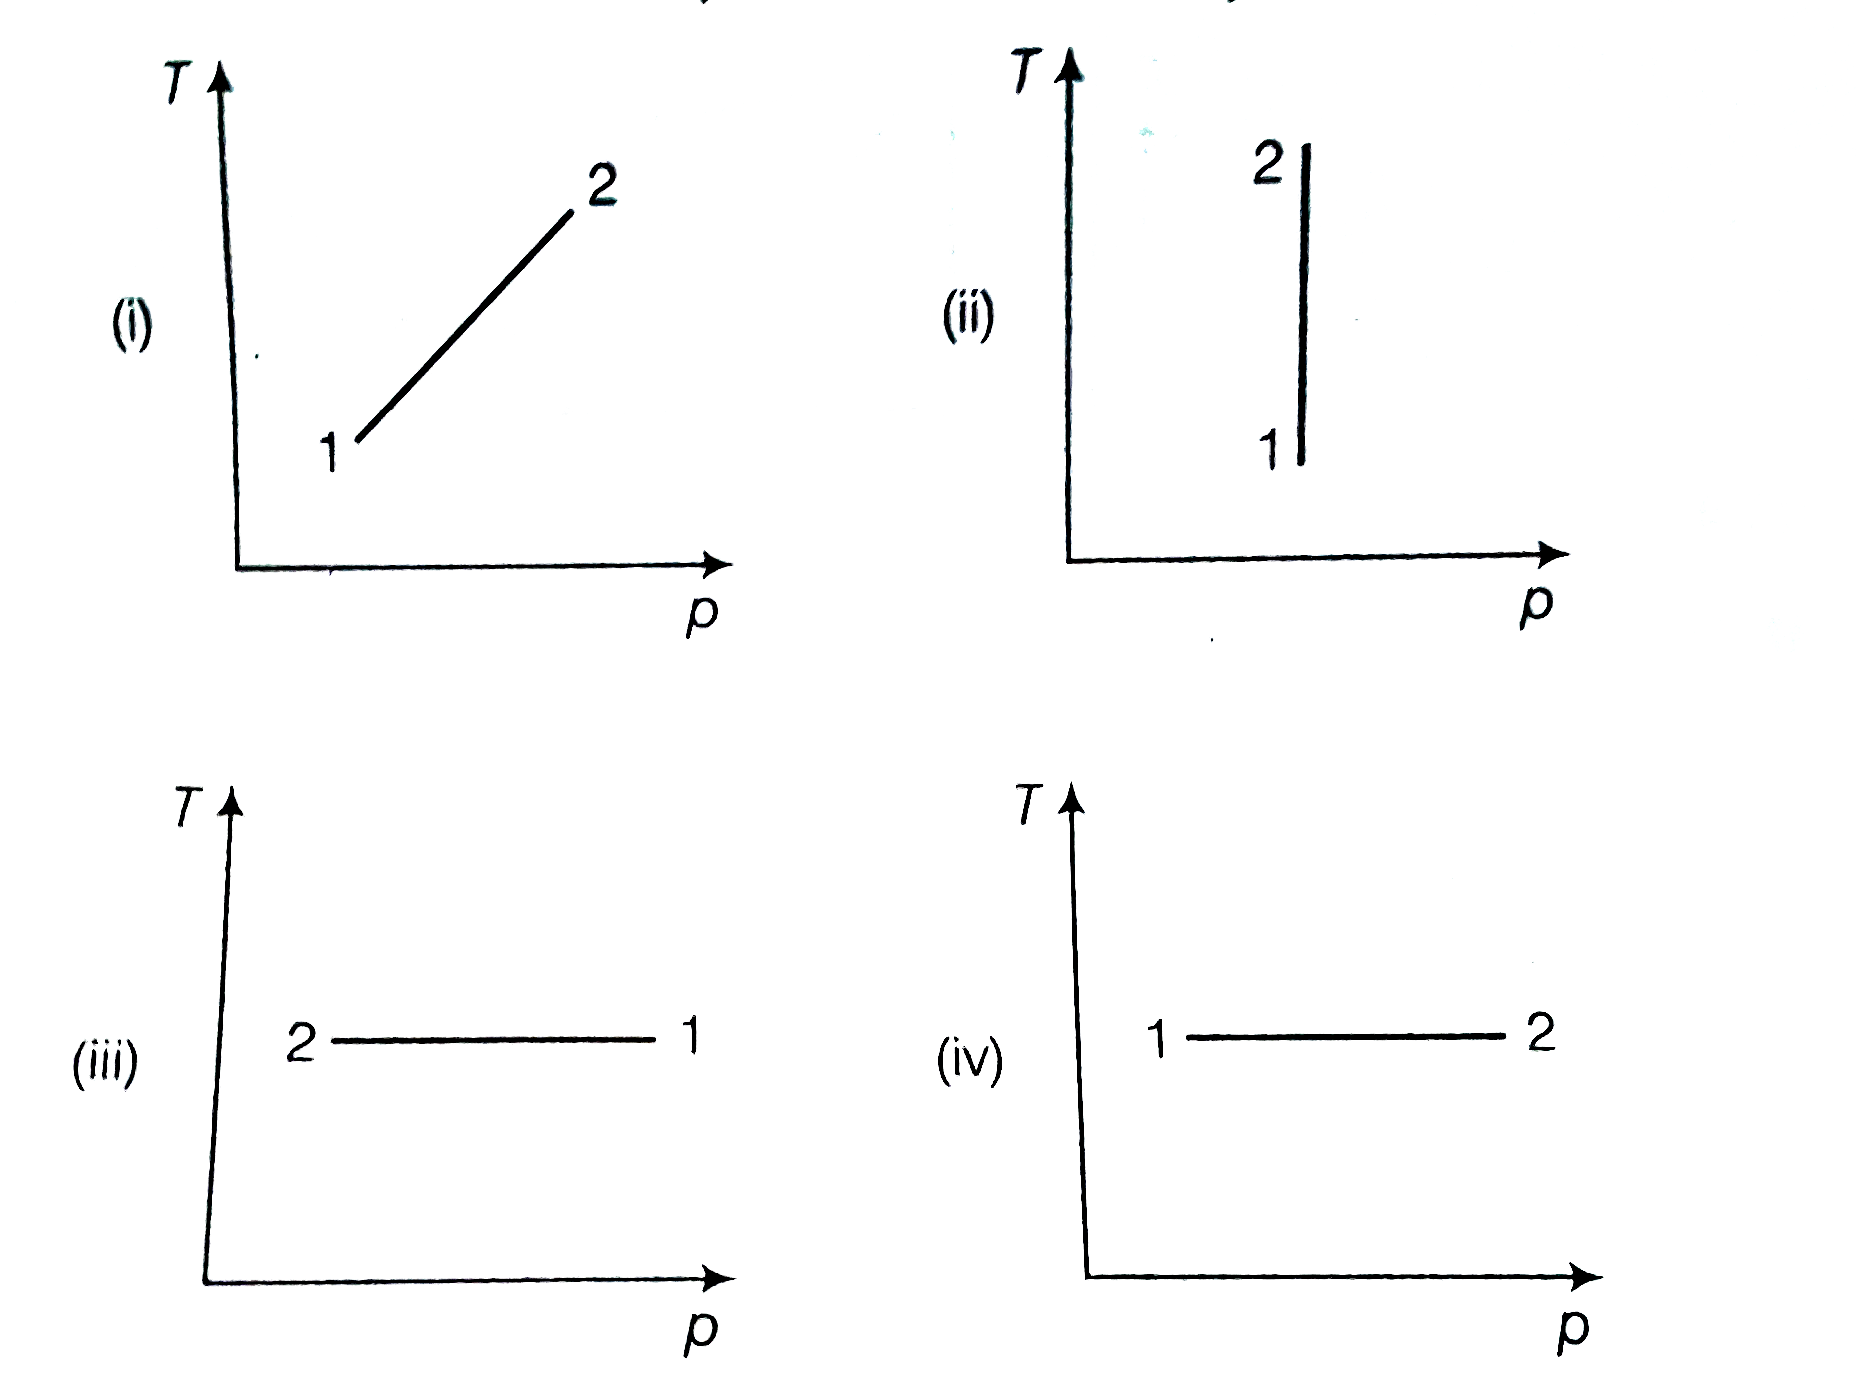 A(iv)B(ii)C(iii)D(i)
 - Question 2 - Select One
From the passage, we can conclude that:
ANew ventures are not risky.BNew ventures are inherently risky.CFinancial investment in a new venture is always non-profitable.DConservative projection of companies' profits is suggested
Consider p-V diagram for an ideal gas shown in figure.

Out of the following diagrams, which figure represents the T−p diagram ?
(i) View Solution
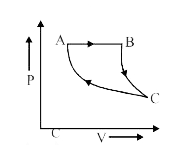
For a given thermodynamic process, the P – V diagram is as shown below:
Which of the following is the V – T diagram for the process?
A→B: isobaric
B→C: adiabatic
C→A : isothermal
 View Solution
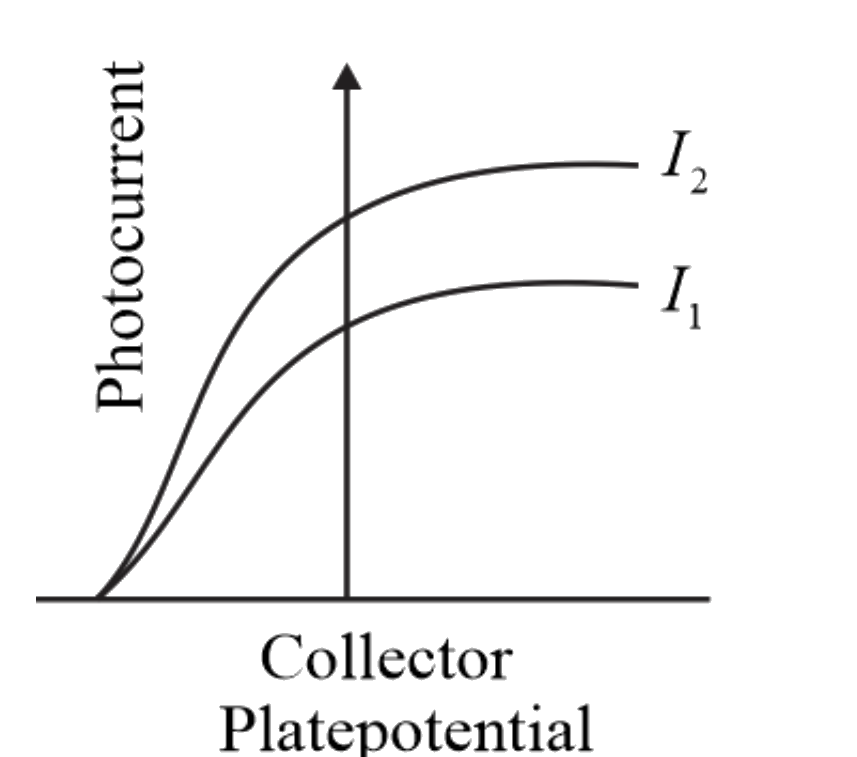
From the following graph of photocurrent against collector plate potential for two different intensities of light I1andI2 one can , conclude
 View Solution
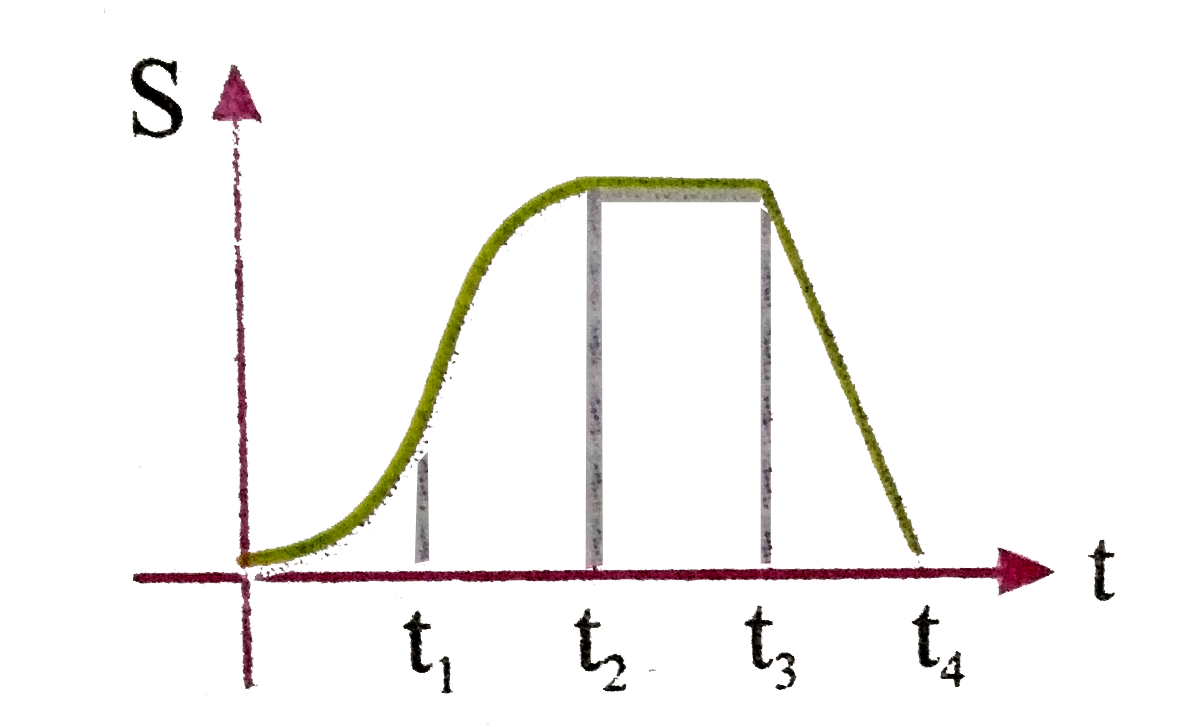
Displacement time graph of a particle moving in a straight line is as shown in figure.
From the graph we can conclude that work done on the block is :
 .View Solution
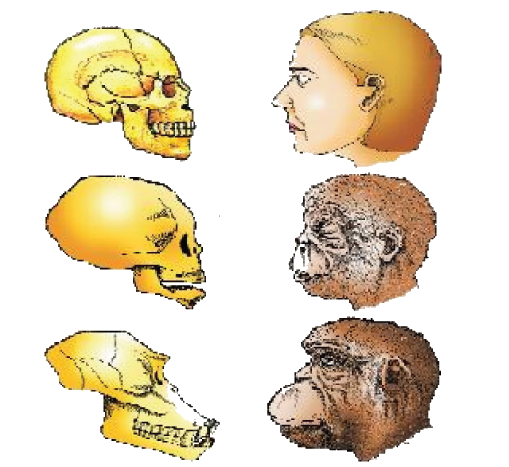
Which of the following can be concluded by looking at the picture below ?
 View Solution
Which of the following.v-t graph can be obtained in practice?
 View Solution

