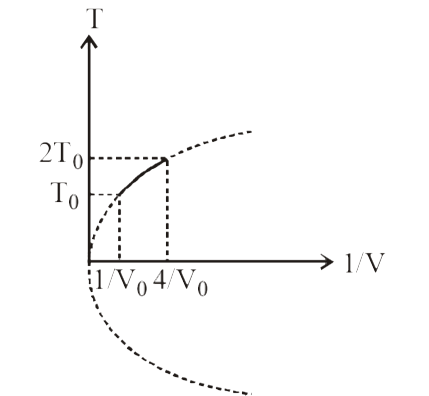
The given figure shows a parabolic graph between T and 1V for' a mixture of a.gas undergoing an adiabatic process. The ratio of v(ms) to the speed of sound in the mixture is k. Find 2k2.
'(##CEN_KSR_PHY_JEE_C13_E01_008_Q02##)'
The correct Answer is:2
Topper's Solved these Questions
Similar Questions
Figure shows a parabolic graph between T and 1/V for a mixture of a gases undergoing an adiabatic process. What is the ratio of Vnms of molecules and speed of sound in mixture?

View SolutionThe equivalent capacitance for the network shown in the figure is k7pF. Find k.
'(##CEN_KSR_PHY_JEE_CO19_E01_020_Q10##)'
View SolutionFigure shows a parabolic graph between T and 1V (T = temperature, V = Volume) for a gas undergoing an adiabatic process. If the ratio of rms velocity of molecules and speed of sound in the gas at the same temperature is √n, then find the value of n.

View SolutionFigure shows a parabolic graph between T and 1V (T = temperature, V = Volume) for a gas undergoing an adiabatic process. If the ratio of rms velocity of molecules and speed of sound in the gas at the same temperature is √n, then find the value of n.

View SolutionA thermodynamic process undergoes a cyclic process as shown. Find the quantity of heat supplied (in joule) to the system in one complęte cycle.
'(##CEN_KSR_PHY_JEE_C15_E01_004_Q03##)'
View SolutionFind the charge (in μC ') on the capacitor of value 2μF in the figure shown at steady state.
'(##CEN_KSR_PHY_JEE_CO20_E01_027_Q21##)'
View SolutionA P−V graph for an ideal 'gas undergoing polytropic process PYm= Constant is sbown below. Find the value of m.
'(##CEN_KSR_PHY_JEE_C13_E01_015_Q05##)'
View SolutionA periodic voltage V varies with time t as shown in the figure. T is the time period. The ms value of the voltage is V0k. Find k.
'(##CEN_KSR_PHY_JEE_C24_E01_004_Q02##)'
View SolutionThe graph below shows a particle in simple harmonic motion. From the information shown, find the value of time t1(in S).
'(##CEN_KSR_PHY_JEE_C16_E01_010_Q03##)'
View SolutionFind out the potential difference (in volt) between points A and B, as shown in the figure
'(##CEN_KSR_PHY_JEE_CO20_E01_003_Q02##)'
View Solution
