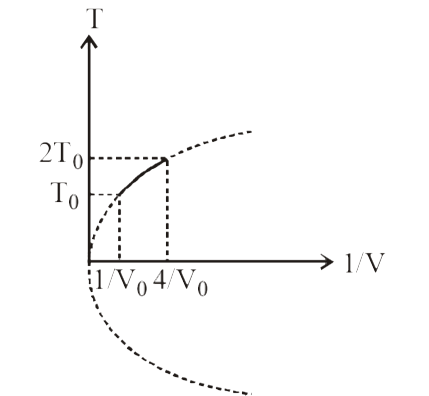
Figure shows a parabolic graph between T and 1/V for a mixture of a gases undergoing an adiabatic process. What is the ratio of Vnms of molecules and speed of sound in mixture?
√3/2
√2
√2/3
√3
Step by step video & image solution for Figure shows a parabolic graph between T and 1/V for a mixture of a gases undergoing an adiabatic process. What is the ratio of V_(nms) of molecules and speed of sound in mixture? by Physics experts to help you in doubts & scoring excellent marks in Class 11 exams.
Topper's Solved these Questions
Similar Questions
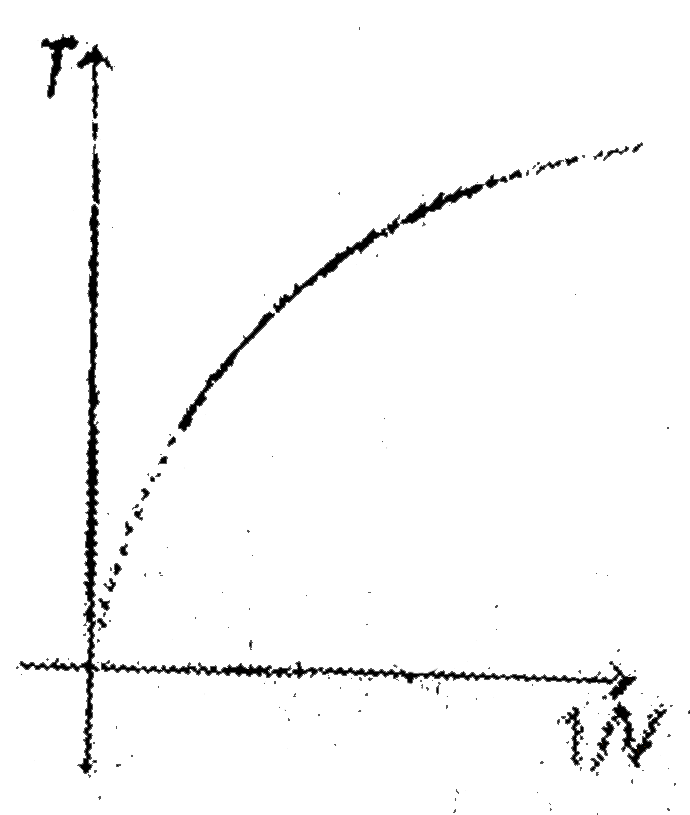
The given figure shows a parabolic graph between T and 1V for' a mixture of a.gas undergoing an adiabatic process. The ratio of v(ms) to the speed of sound in the mixture is k. Find 2k2.
'(##CEN_KSR_PHY_JEE_C13_E01_008_Q02##)'View SolutionFigure shows a parabolic graph between T and 1V (T = temperature, V = Volume) for a gas undergoing an adiabatic process. If the ratio of rms velocity of molecules and speed of sound in the gas at the same temperature is √n, then find the value of n.
 View Solution
Knowledge Check
- Question 1 - Select One
For an adiabatic process graph between PV & V for a sample of ideal gas will be
A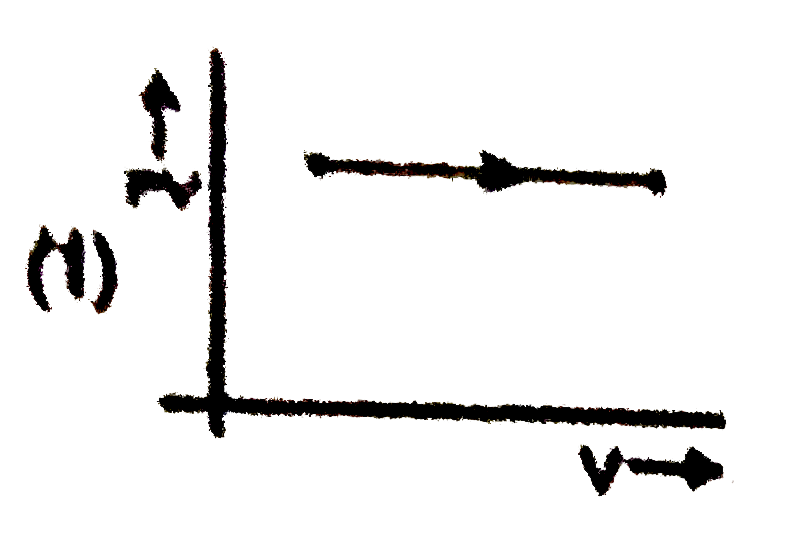 B
B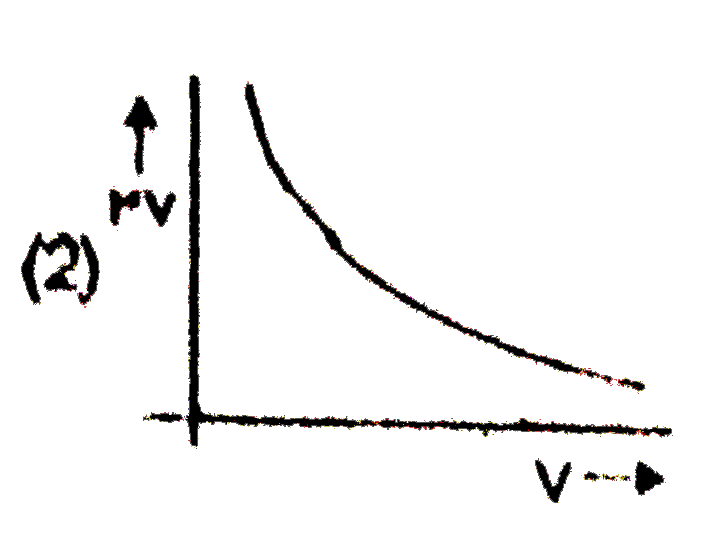 C
C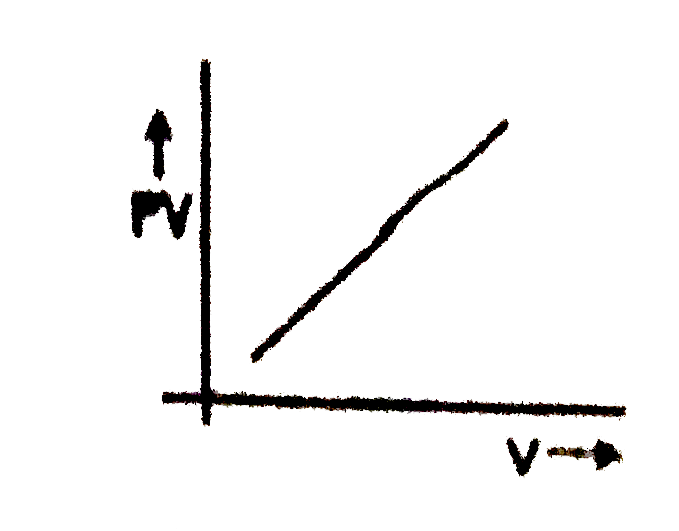 D
D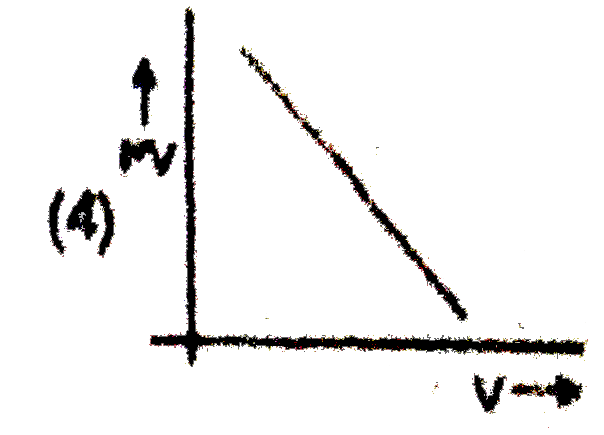
- Question 2 - Select One
For an adiabatic process the relation between V and T is given by
ATVγ= constantBTγV=constantCTV1−γ= constantDTVγ−1=constant - Question 3 - Select One
A mixture of gases contains H2andO2 gases in the ratio of 1 : 4 (w/w). What is the molar ratio of the two gases in the mixture?
A16:1B2:1C1:4D4:1
P - V plots for two gases, undergoing adiabatic processes are as shown in the figure.
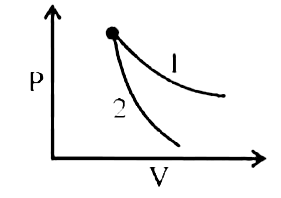
Plots 1 and 2 should correspond respectively toView SolutionP−V plots for two gases during P4 adiabatic process are shown in the figure. Plots 1 and 2 should correspond respectively to
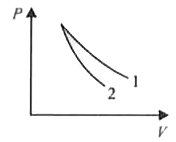 View Solution
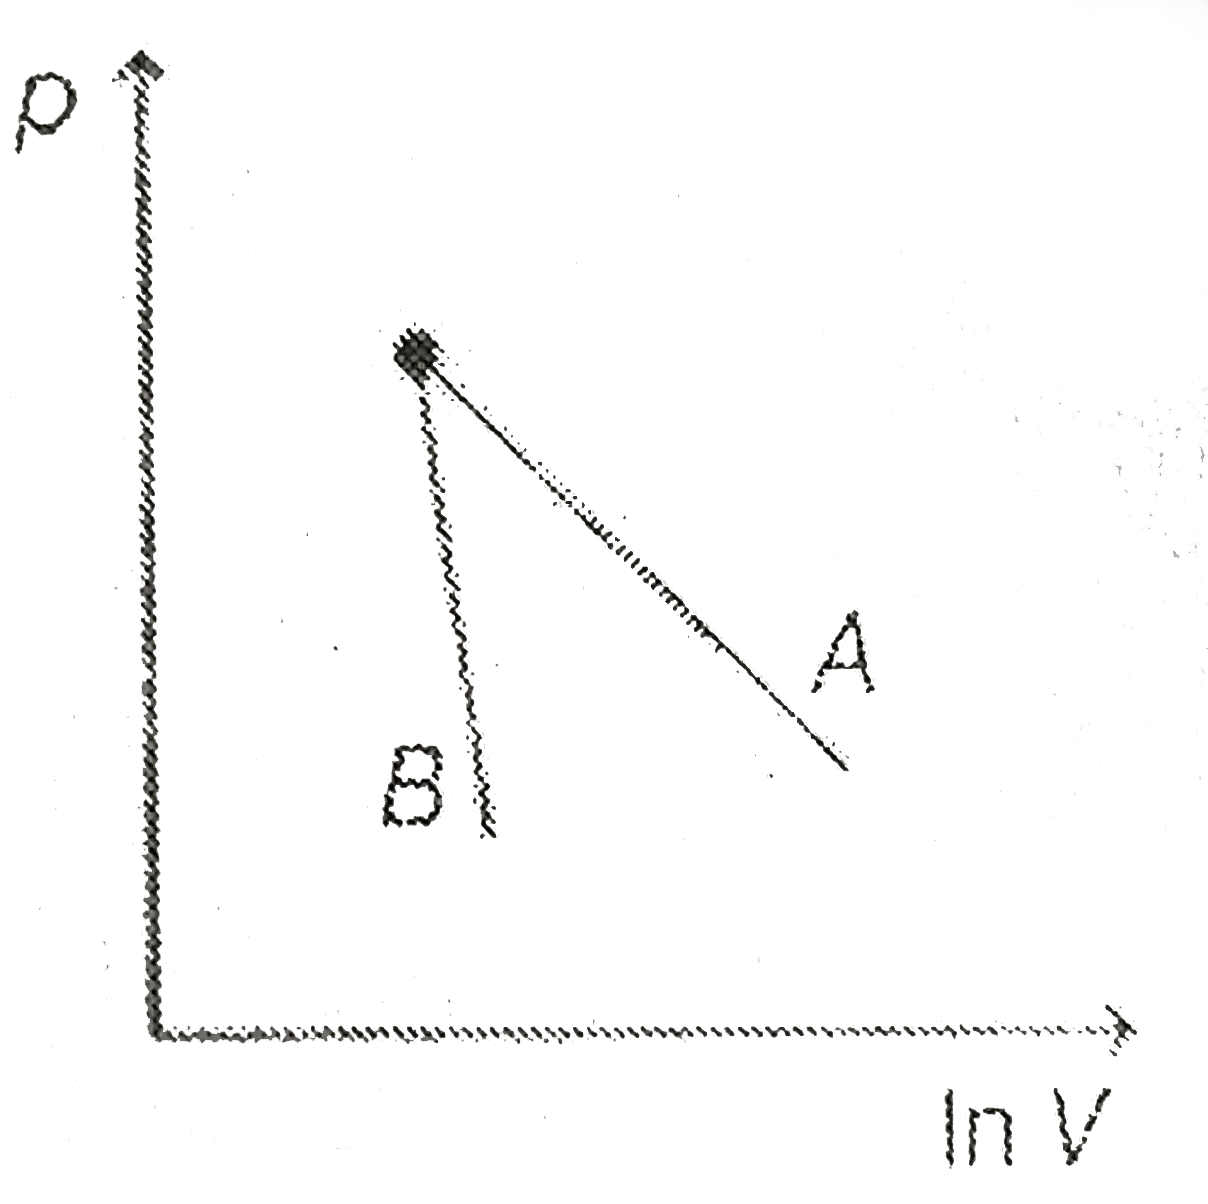
The figure shows the graph of logarithmic reading of pressure and volume for two ideal gases A and B undergoing adiabatic process. From figure, it can be concluded that
 View Solution
The figure shows the graph of logarithmic reading of pressure and volume for two ideal gases A and B undergoing adiabatic process. From figure, it can be concluded that
 View Solution
Assertion: The graph between P V/s 1V is a straight line.
Reason: For adiabatic process P∝1VView Solution

