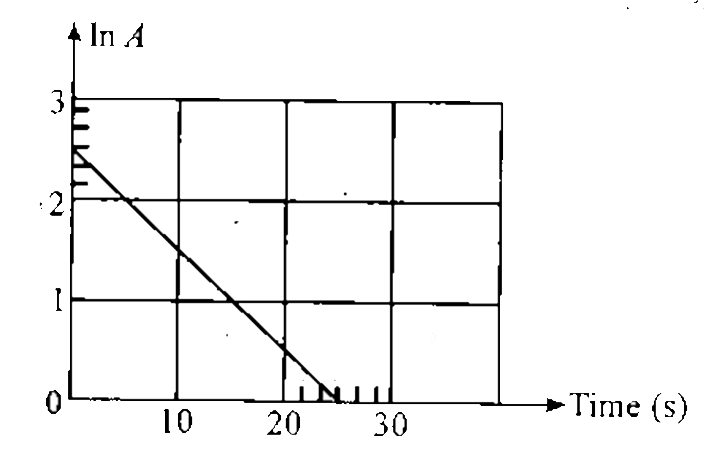
The graph in the figure shows how the count-rate of adioactive source as measured by a Geiger counter varies with time . The relationship between and is Find . (Assume ln12=2.6)
'(## CEN_KSR_PHY_JEE_CO30_E01_036_Q02##)'
The correct Answer is:12
Topper's Solved these Questions
Similar Questions
In the figure show, if the equivalent resistance between points A and B is x then find 5x. (Given: R=2ohm )
'(##CEN_KSR_PHY_JEE_CO20_E01_009_Q06##)'
View SolutionFor the shown circuit, find the effective resistance (in ohms) between the points A and B. (Given: R=5ohm )
'(##CEN_KSR_PHY_JEE_CO20_E01_033_Q27##)'
View Solution
Knowledge Check
The graph shows how the count-rate A of a radioactive source varies with time t. A and t are related as: (assume in (12)=2.5)
 AA=2.5e−10tBA=12e10tCA=2.5e−(0.1t)DA=12e−(0.1t)
A periodic voltage V varies with time t as shown in the figure. T is the time period. The ms value of the voltage is V0k. Find k.
'(##CEN_KSR_PHY_JEE_C24_E01_004_Q02##)'
View SolutionCalculate the time constant (in second), of the circuit.
'(##CEN_KSR_PHY_JEE_CO20_E01_032_Q26##)'
View SolutionThe equivalent capacitance for the network shown in the figure is k7pF. Find k.
'(##CEN_KSR_PHY_JEE_CO19_E01_020_Q10##)'
View SolutionFind out the potential difference (in volt) between points A and B, as shown in the figure
'(##CEN_KSR_PHY_JEE_CO20_E01_003_Q02##)'
View SolutionIn the shown figure, the focal length of equivalent system is 50x13. Find the value of x.
'(##CEN_KSR_PHY_JEE_C26_E01_020_Q07##)'
View SolutionFind n, if the total power dissipated in the circuit is 6n watts.
'(##CEN_KSR_PHY_JEE_CO20_E01_034_Q28##)'
View SolutionThe ratio of time constant in charging and discharging in the circuit shown in the figure is xy. Find (x+y)
'(##CEN_KSR_PHY_JEE_CO23_E01_034_Q12##)'
View Solution
