The graph drawn for the temperature of five days in a village measured with the help of MMT is given in the fig. The day on which the highest temperature recorded is_______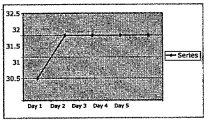 Solution in Telugu
Day 1
Day 2
Day 3
Day 4
Step by step video & image solution for The graph drawn for the temperature of five days in a village measured with the help of MMT is given in the fig. The day on which the highest temperature recorded is_______ by Biology experts to help you in doubts & scoring excellent marks in Class 7 exams.
Updated on:21/07/2023Topper's Solved these Questions
Similar Questions
Essential for metabolic activity.
View SolutionThe following graph shows the temperature forecast and the actual temperature for each day of a week.
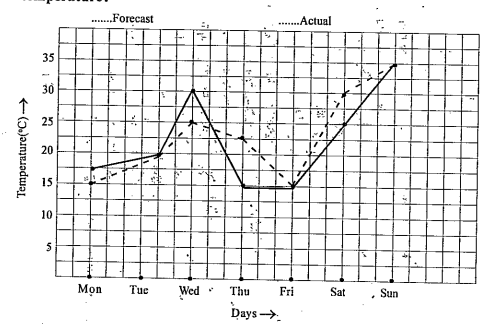
On which days was the forecast temperature the same as the actual temperature?
View SolutionThe following graph shows the temperature forecast and the actual temperature for each day of a week.
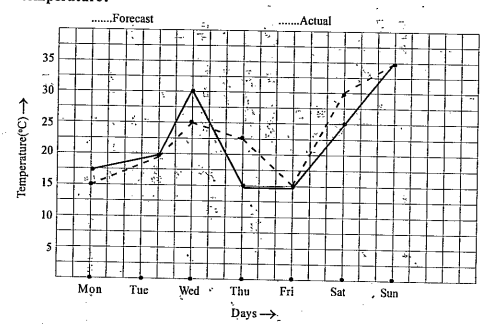
On which day did the actual temperature differ the most from the forecast temperature?
View SolutionThe graph below shows the forecast and actual temperature for each day of a week: Which day are the forecast temperature and the actual same?
View SolutionThe graph below shows the forecast and actual temperature for each day of a week: On which day the difference between the actual temperature and the forecast temperature was greater?
View SolutionDifference between the maximum temperature and the minimum temperature in a day is highest in a
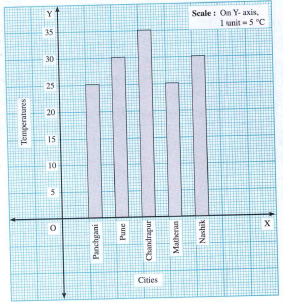
View SolutionThis bar graph shows the temperatures in degree Celsius in different cities on a certain day in February. Observe the graph and answer the questions :
Which city had the highest temperature ?
View SolutionThe temperature recorded in Srinagar is -5^@ C, and Simla is -8^@ C on the same day. Which place is low temperature on that day ? How?
View SolutionThis bar graph shows the temperatures in degree Celsius in different cities on a certain day in February. Observe the graph and answer the questions :
Which city had the highest temperature ?

View SolutionName the thermometer which can automatically record the highest and lowest temperatures reached during the whole day.
View SolutionWe used this to measure the day temperature
View Solutionनिम्न आलेख, किसी सप्ताह के प्रत्येक दिन के लिए पूर्वानुमानित तापमान तथा वास्तविक तापमान दर्शाता है-
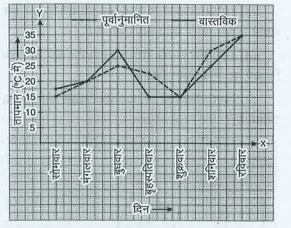 किस दिन पूर्वानुमानित तापमान व वास्तविक तापमान समान था?
View Solutionनिम्न आलेख, किसी सप्ताह के प्रत्येक दिन के लिए पूर्वानुमानित तापमान तथा वास्तविक तापमान दर्शाता है-
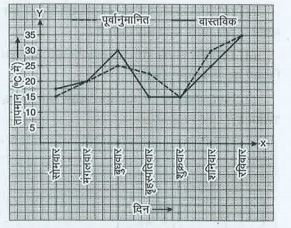 किस दिन वास्तविक तापमान व पूर्वानुमानित तापमान में अन्तर सर्वाधिक था?
View SolutionThe graph shows the maximum temperatures recorded for two consecutive weeks of a town. Study the graph and answer the questions that follow.
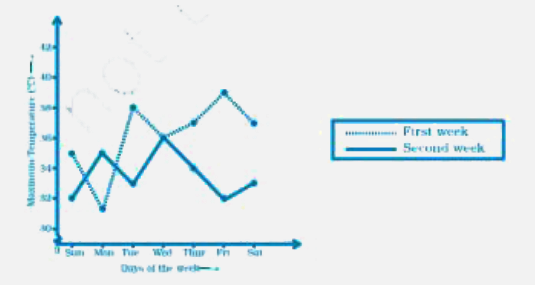
(a) What information is given by the two axes?
(b) In which week was the temperature higher on most of the days?
(c) On which day was the temperature same in both the weeks?
(d) On which day was the difference in temperatures the maximum for both the weeks?
(e) What were the temperatures for both the weeks on Thursday?
(f) On which day was the temperature 35°C for the first week?
(g) On which day was the temperature highest for the second week?
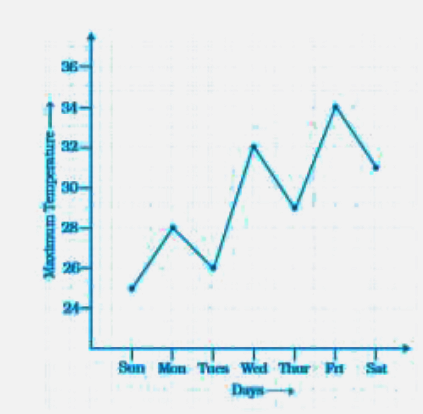
View SolutionStudy the graph and answer the questions that follow.
(a) What information does the graph give?
(b) On which day was the temperature the least?
(c) On which day was the temperature 31∘C?
(d) Which was the hottest day?
View Solution
