Observe the following graph and answer the questions given below .
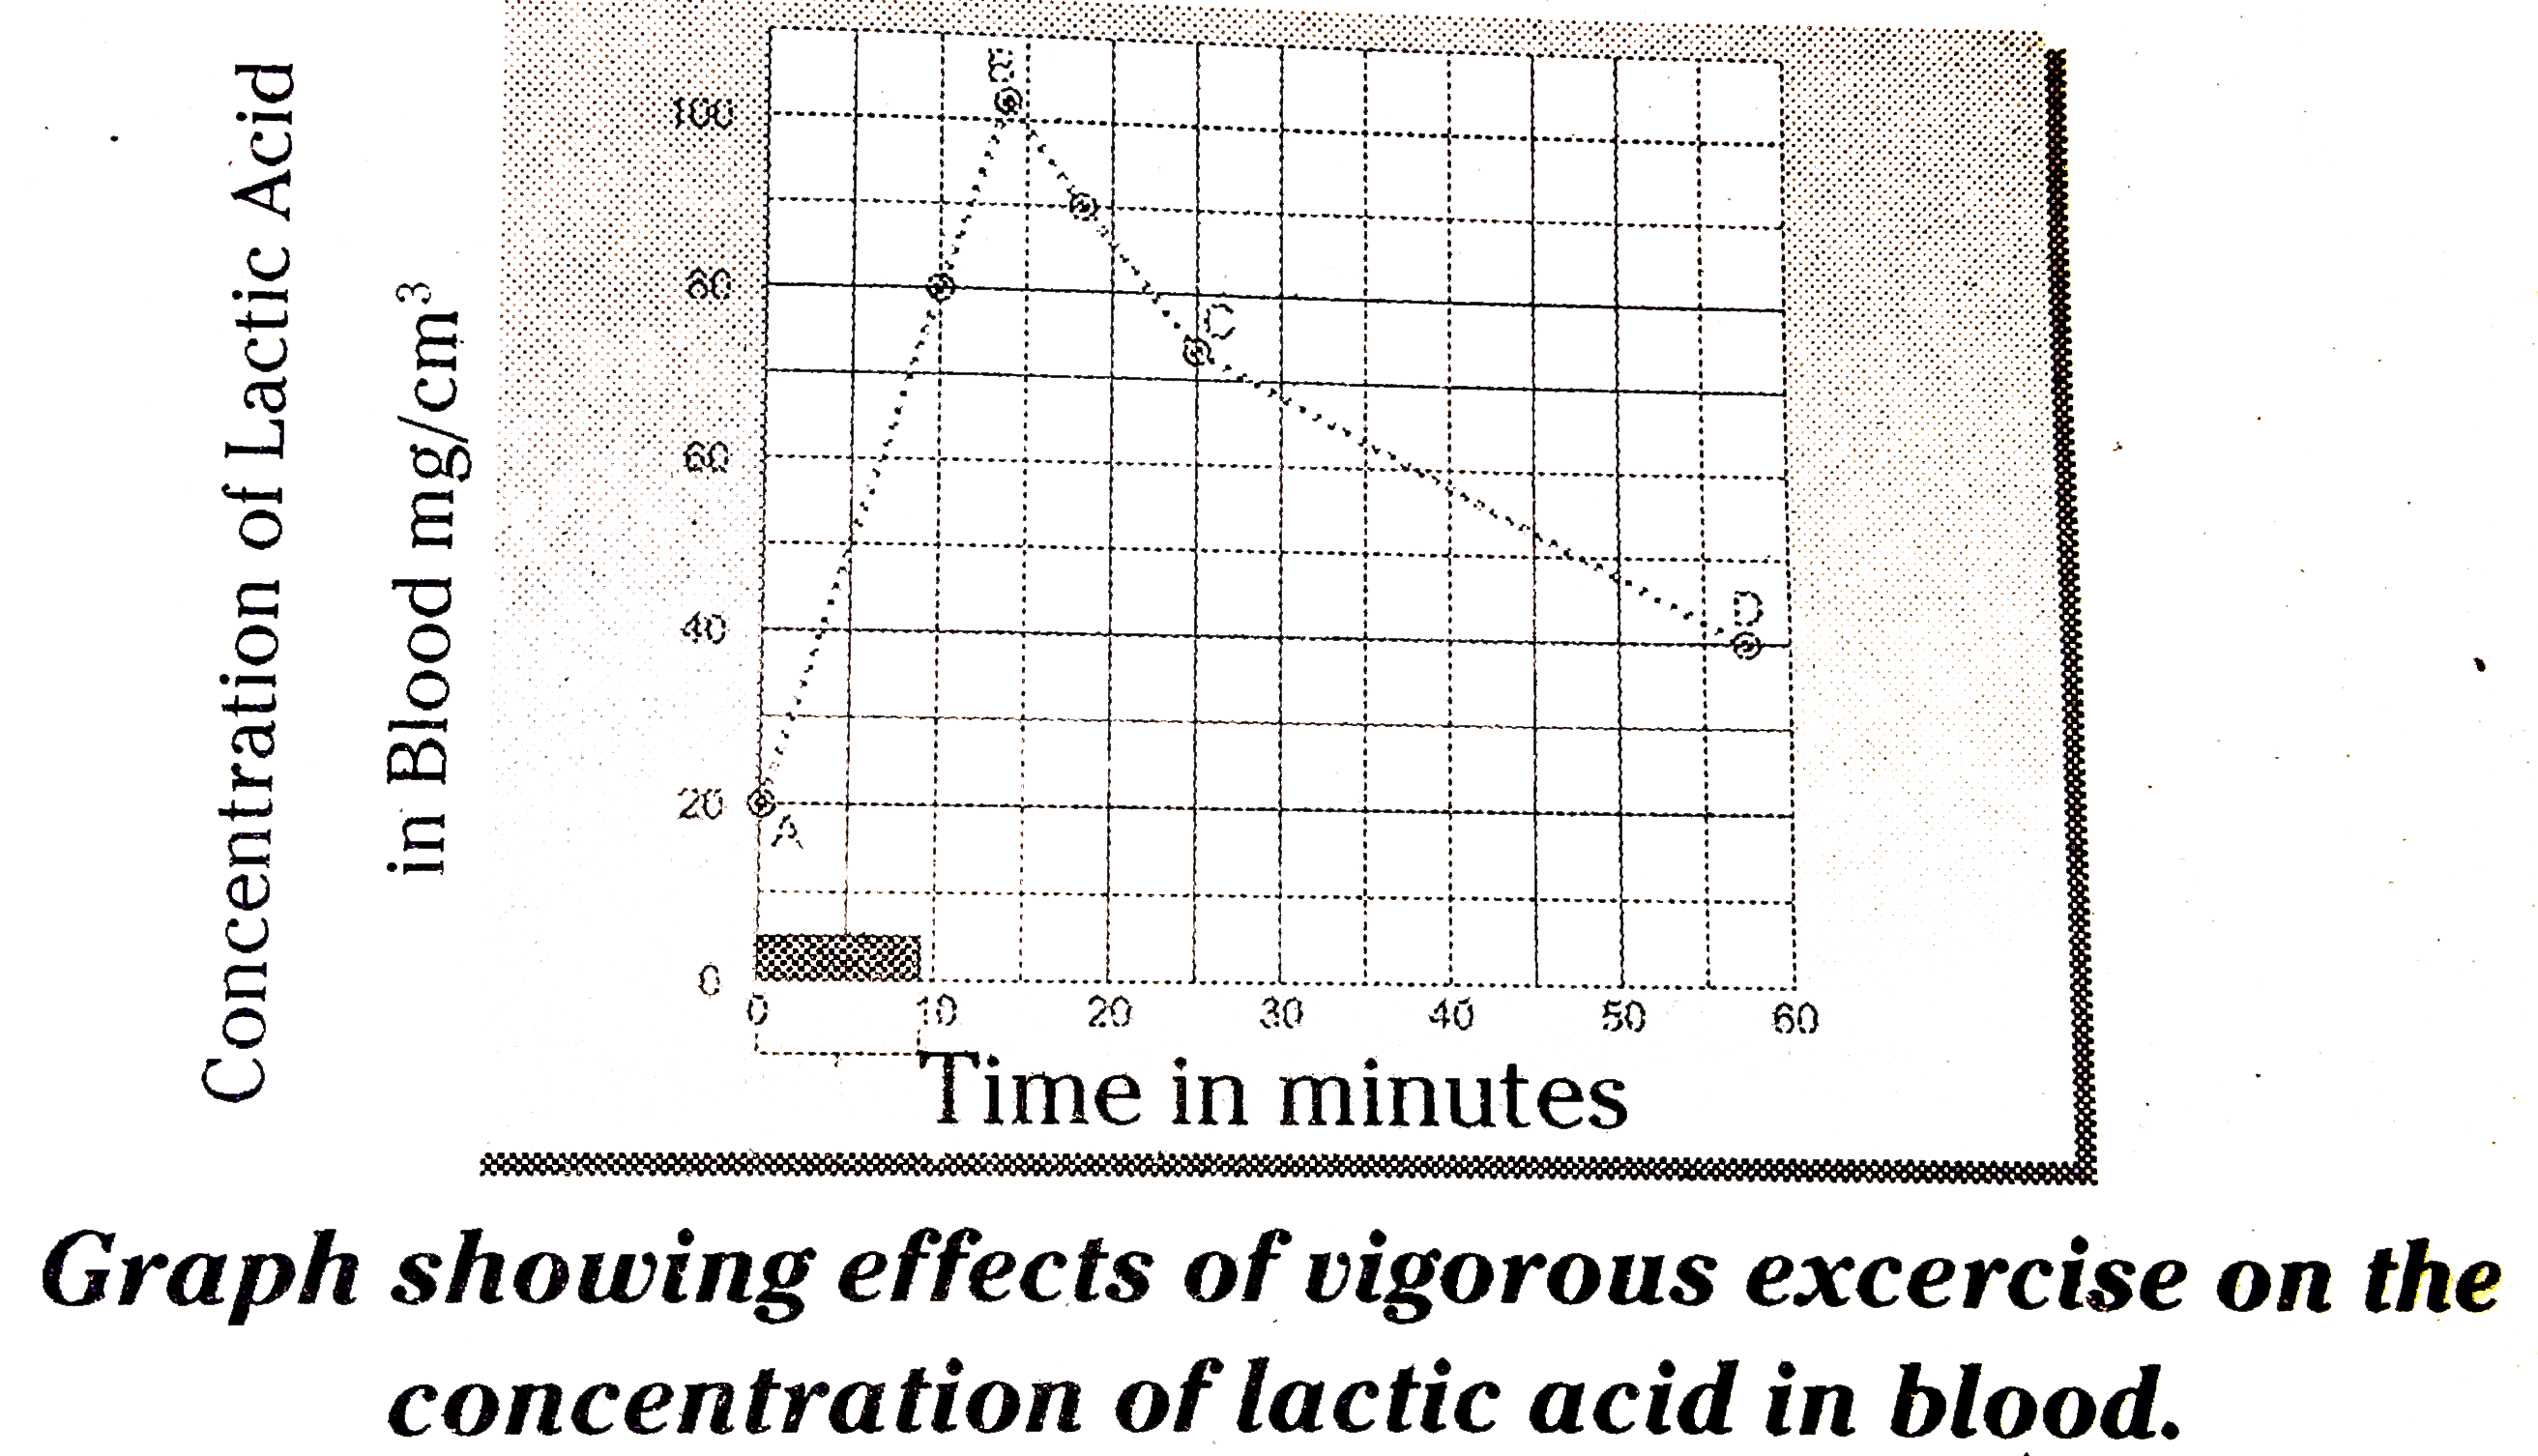
What was the greatest concentration reached during the experiment ?Solution in Telugu
Step by step video solution for Observe the following graph and answer the questions given below . What was the greatest concentration reached during the experiment ? by Biology experts to help you in doubts & scoring excellent marks in Class 10 exams.
Updated on:21/07/2023Topper's Solved these Questions
- RESPIRATIONBOOK - NCERT TELUGUCHAPTER - RESPIRATIONEXERCISE - MEDICINE ORIENTED MATERIAL
56 Videos
- REPRODUCTION - THE GENERATING SYSTEMBOOK - NCERT TELUGUCHAPTER - REPRODUCTION - THE GENERATING SYSTEMEXERCISE - Choose the correct answer
14 Videos
- RESPIRATION - THE ENERGY RELEASING SYSTEMBOOK - NCERT TELUGUCHAPTER - RESPIRATION - THE ENERGY RELEASING SYSTEMEXERCISE - Choose the correct answer
5 Videos
Similar Questions
Respiration is a catabolic process because of
View SolutionThe part of the female reproductive system that produces the eggs……….
View SolutionWe will find vocal cords in
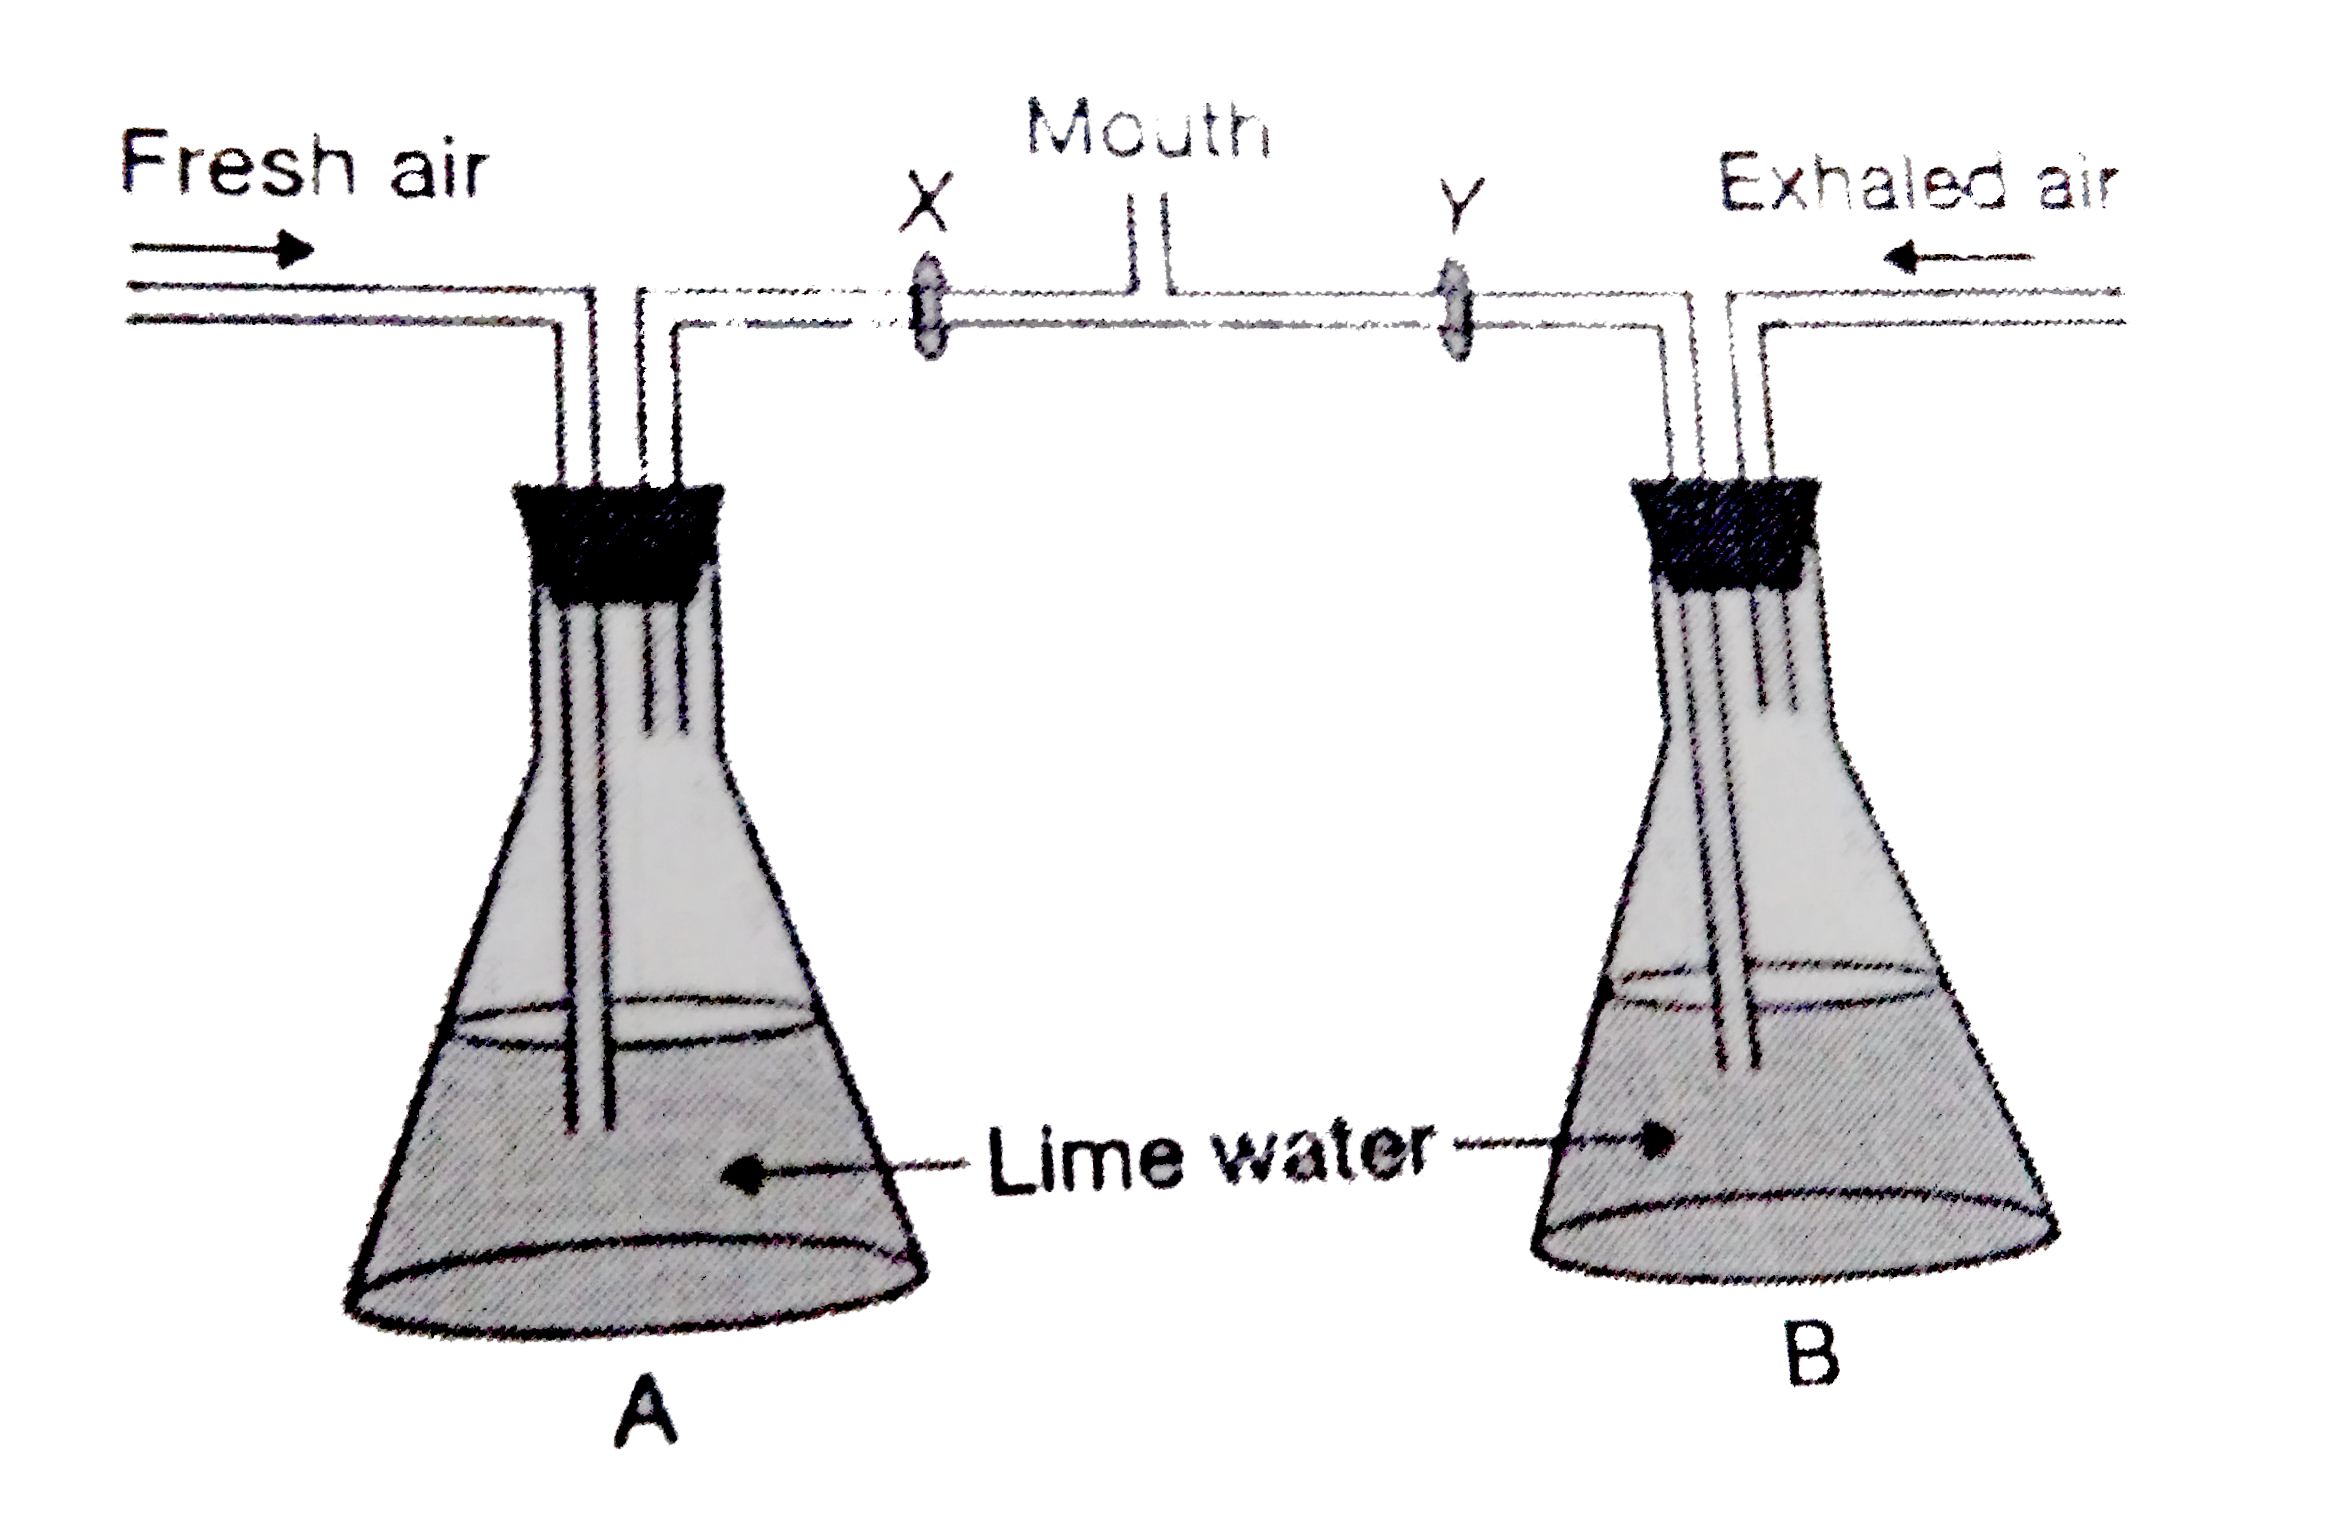
View SolutionObserve the figure given below and answer the following questions.
(a) Will the observation be same in both the flask ?
(b) What inference can be drawn from the given experiments?
View SolutionObserve the following graph and answer the questions given below .
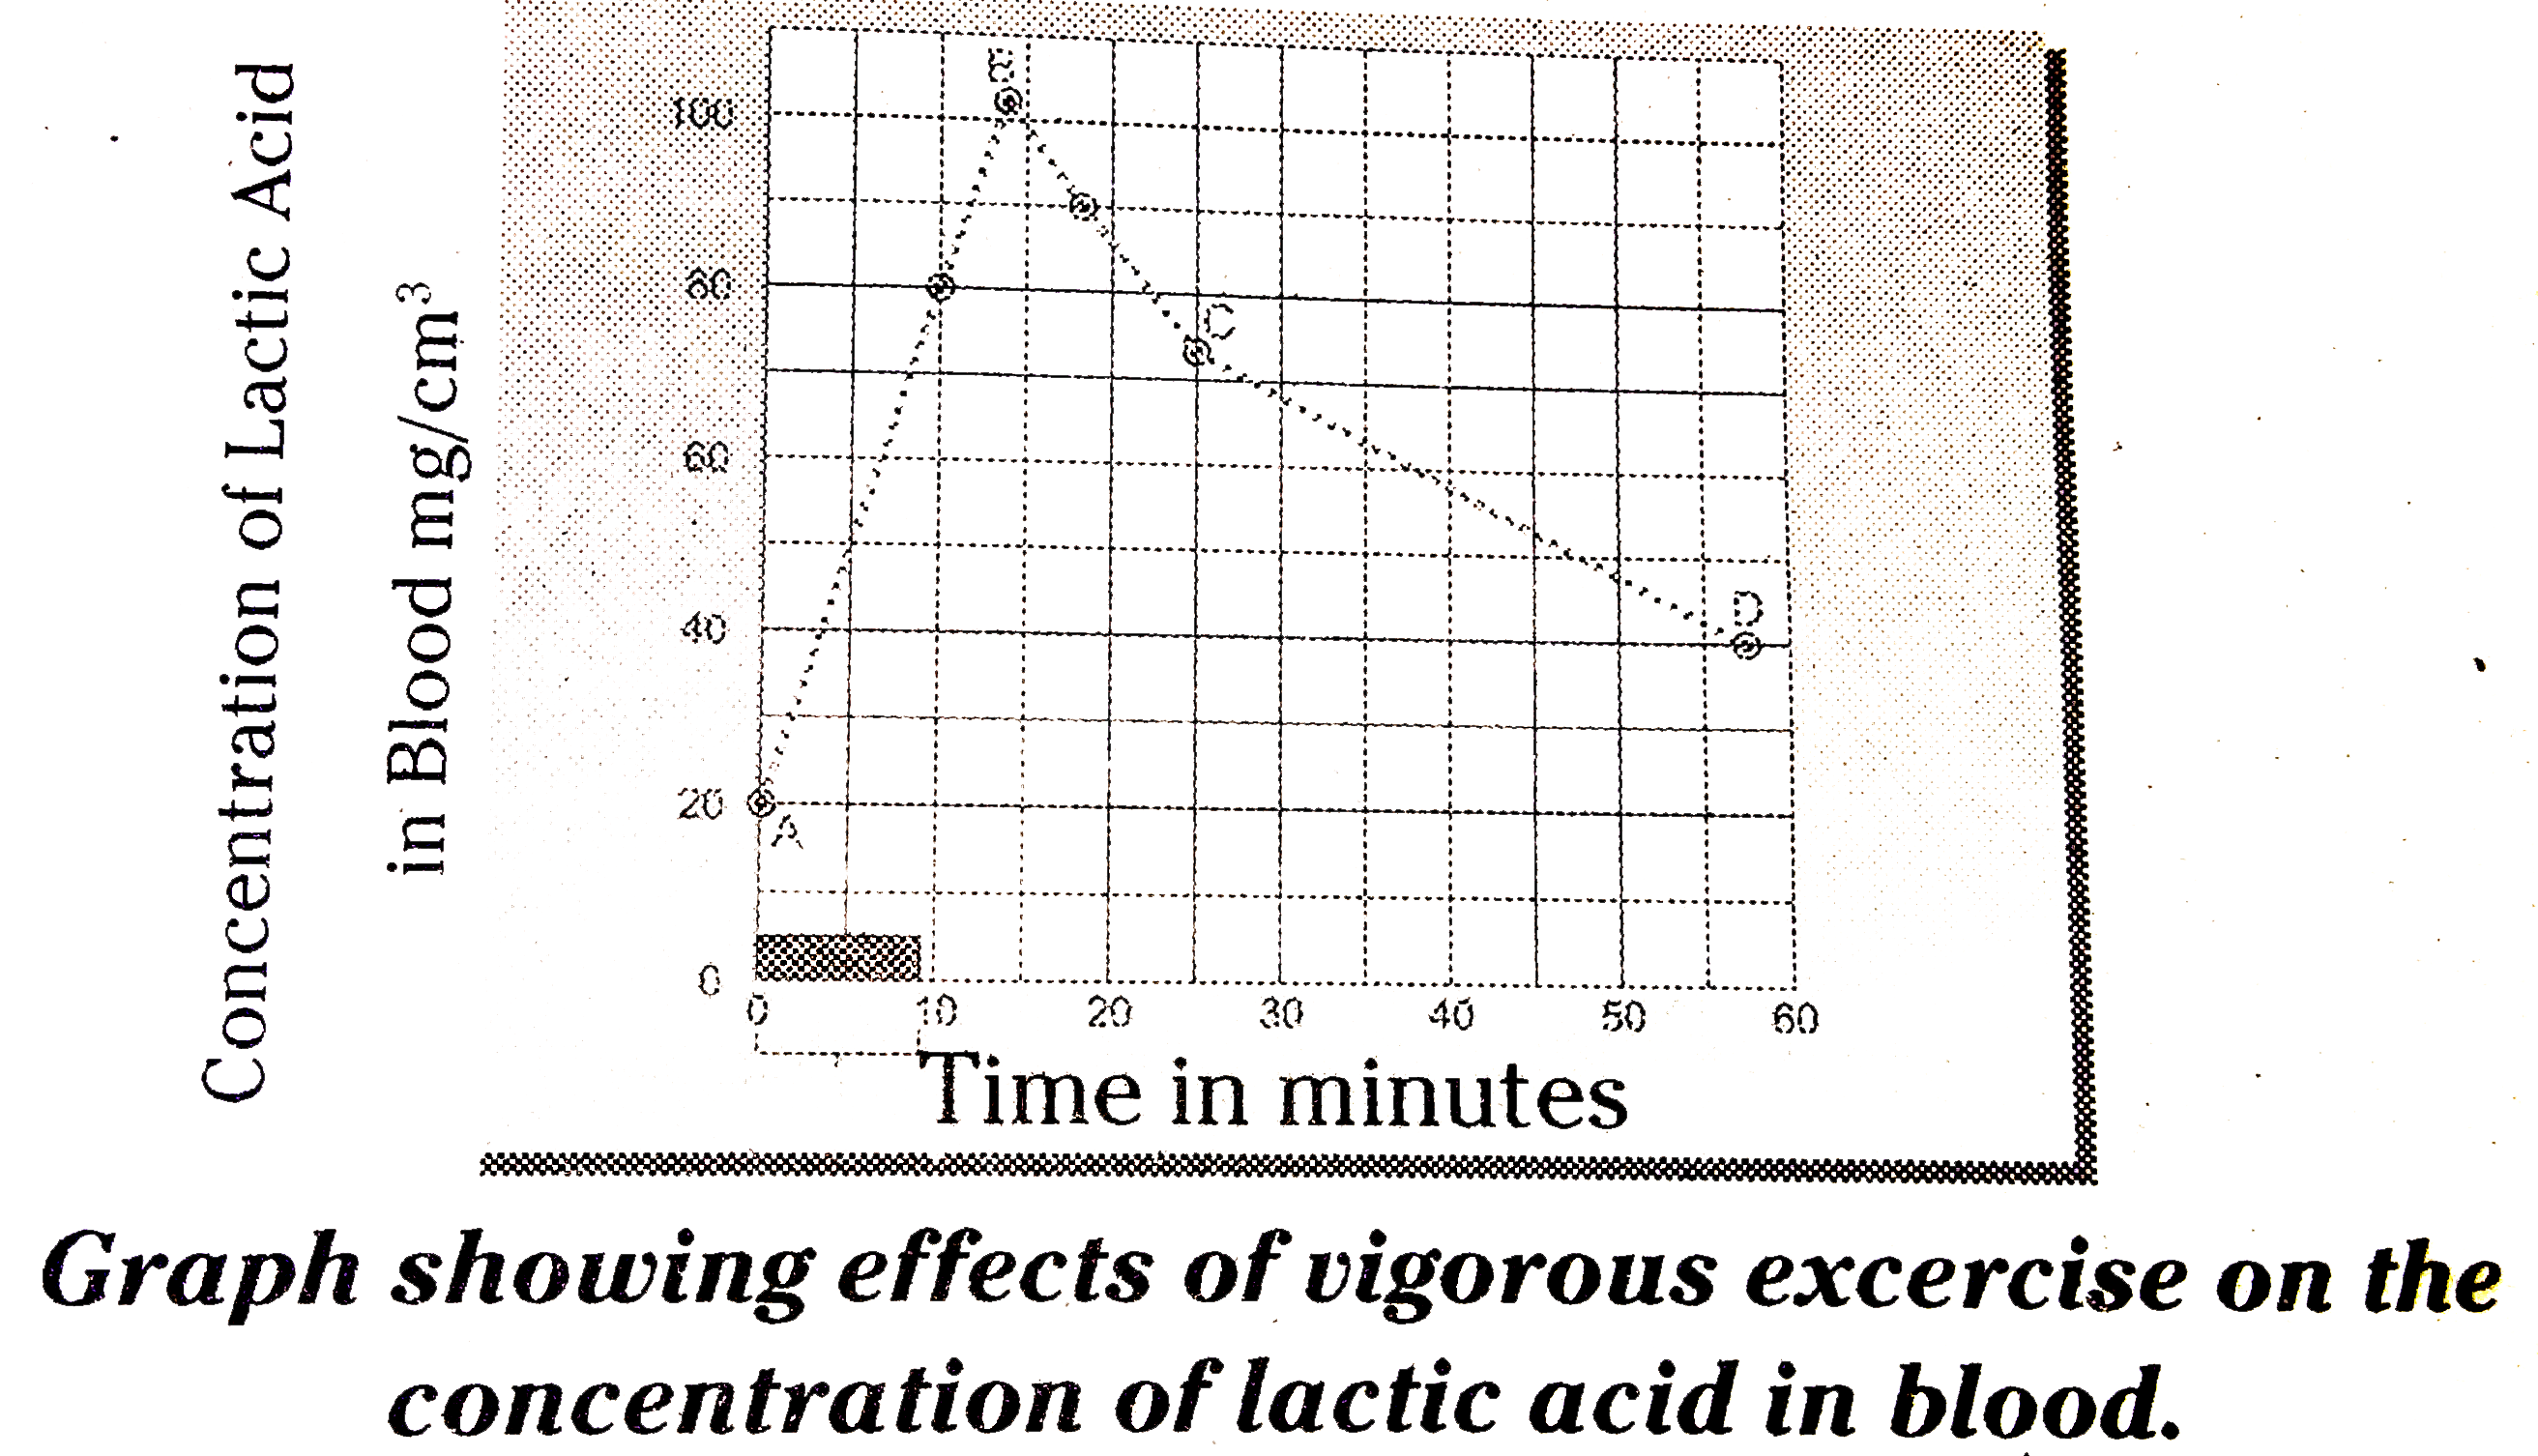
What was the concentration of lactic acid in the blood to start with ?
View SolutionObserve the following graph and answer the questions given below . What was the greatest concentration reached during the experiment ?
View SolutionObserve the following graph and answer the questions given below . What are the two aspects discussed through graph ?
View SolutionObserve the following graph and answer the questions given below .
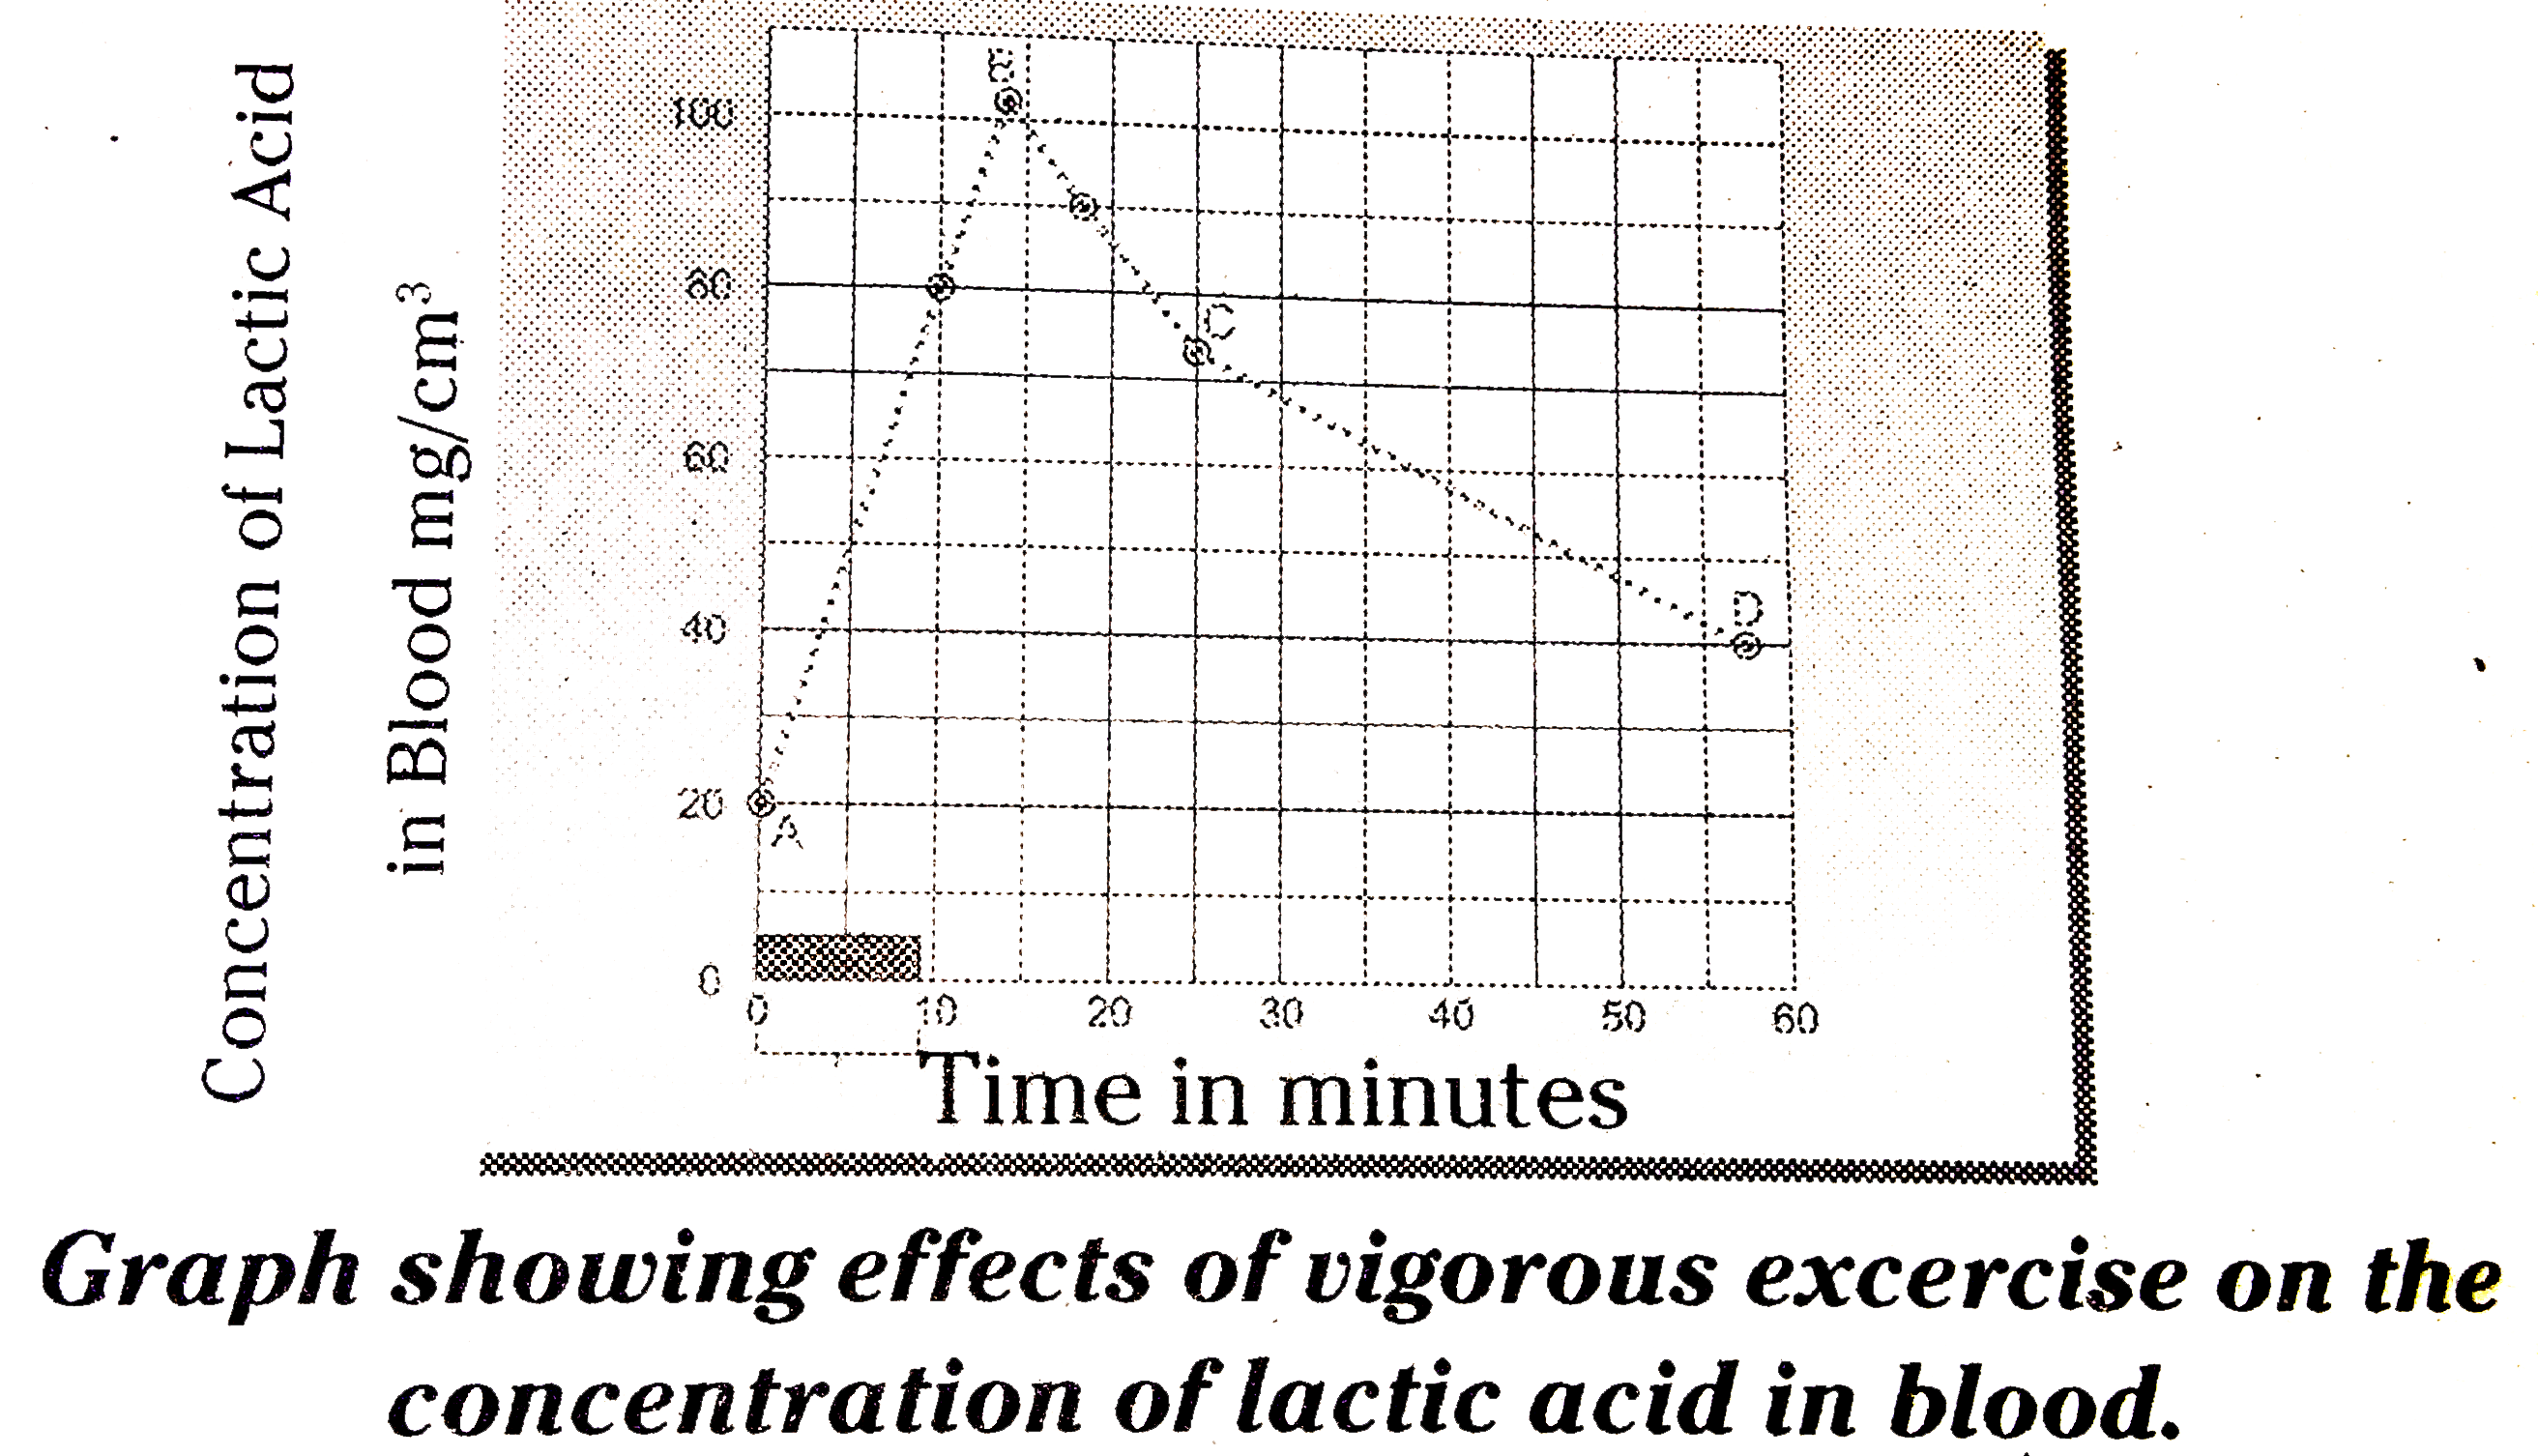
In which state lactic acid concentration is more ?
View SolutionObserve the following graph and answer the questions given below . What are the consequences of oxygen deficit ?
View SolutionObserve the experiment and answer the questions given below.

(a) Who did this experiment?
(b) State the objective of the experiment.
(c) What is concluded through this experiment?
View SolutionThe bar graph given below shows the spending of a family income on various items and savings during 1993. Observe the graph and answer the following questions :
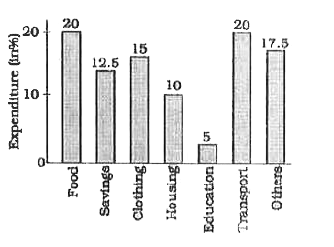
If the total income of the family during 1993 was Rs. 100000, the savings of the family in 1993 was :
View SolutionObserve the illustration and answer the questions given below. What happens to 'B' when it reaches tissue?
View SolutionThe diagram given below is an experiment conducted to study a factor necessary for photosynthesis Observe the diagram and then answer the following questions
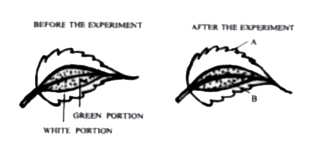
What is the aim of the experiment
View SolutionThe diagram given below represents an experiment to prove the importance of a factor in photosynthesis. Answer the questions that follow What will you observe in the experimental What will you observe in the experimental
View SolutionObserve the bar graph given below :
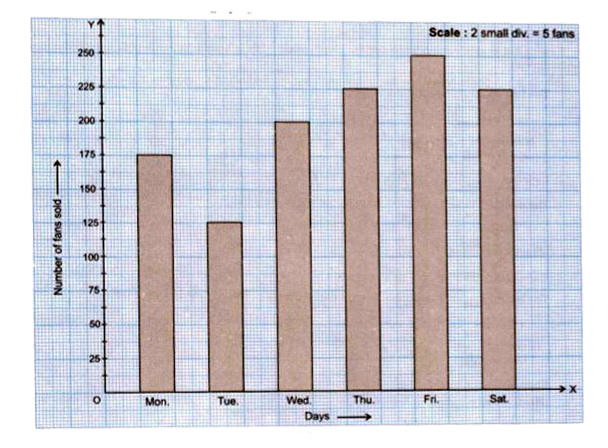
Read the bar graph carefully and answer the following questions :
What information is given by the bar graph?
View SolutionObserve the bar graph given below :
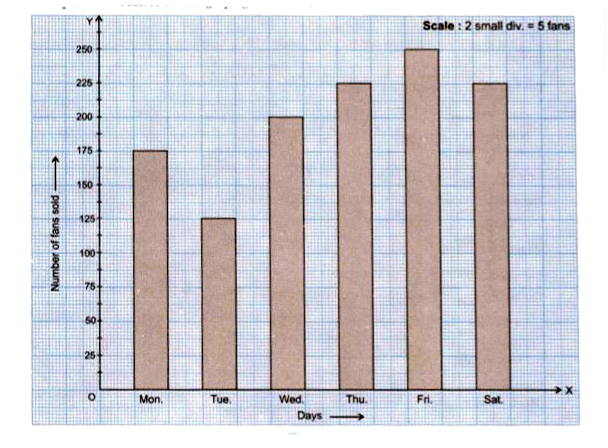
Read the bar graph carefully and answer the following questions :
What was the total sale during the week?
View Solution
