Complete the chart :
(NAV_GCI_VII_C05_S01_020_Q01.png" width="80%">
(NAV_GCI_VII_C05_S01_020_S01.png" width="80%">
Similar Questions
In the following graph, state the absolute and local maximum and minimum values of the function.
(##CEN_GRA_C01_S01_022_Q01.png" width="80%">
View SolutionIn the arrangement shown, all the surfaces are smooth, strings and pulleys are light. Find the tension in the string.
(CPS_V01_C06_S01_015_Q01.png" width="80%">
View Solution
Knowledge Check
Match the bond enthalpics given in column II with
the molecular given in column I and mark the appropriate choice .
(##MRV_CHE_MCQ_XI_C05_E01_270_Q01.png" width="80%">A(A)→(i),(B)→(ii),(C)→(iii)B(A)→(iii),(B)→(ii),(C)→(i)C(A)→(i),(B)→(iii),(C)→(ii)D(A)→(iii),(B)→(i),(C)→(ii)Match the following and choose the correct code
(##AHT_TGT_SCI_P02_E01_098_Q01.png" width="80%">A B
B C
C D
D
The relative stablility of the compounds:
(GRB_ORG_CHM_P1_C07_E01_260_Q01.png" width="80%">AI>II>III>IV>V>VIBVI>V>IV>III>II>ICI>III>V>II>IV>VIDII>I>IV>III>V>VI
The given diagram is highly diagrammatic representation of mammalian heart. In this diagram
(##EVR_ANM_ICSE_BIO_X_C07_E01_020_Q01.png" width="80%">
What do the arrows indicate ?
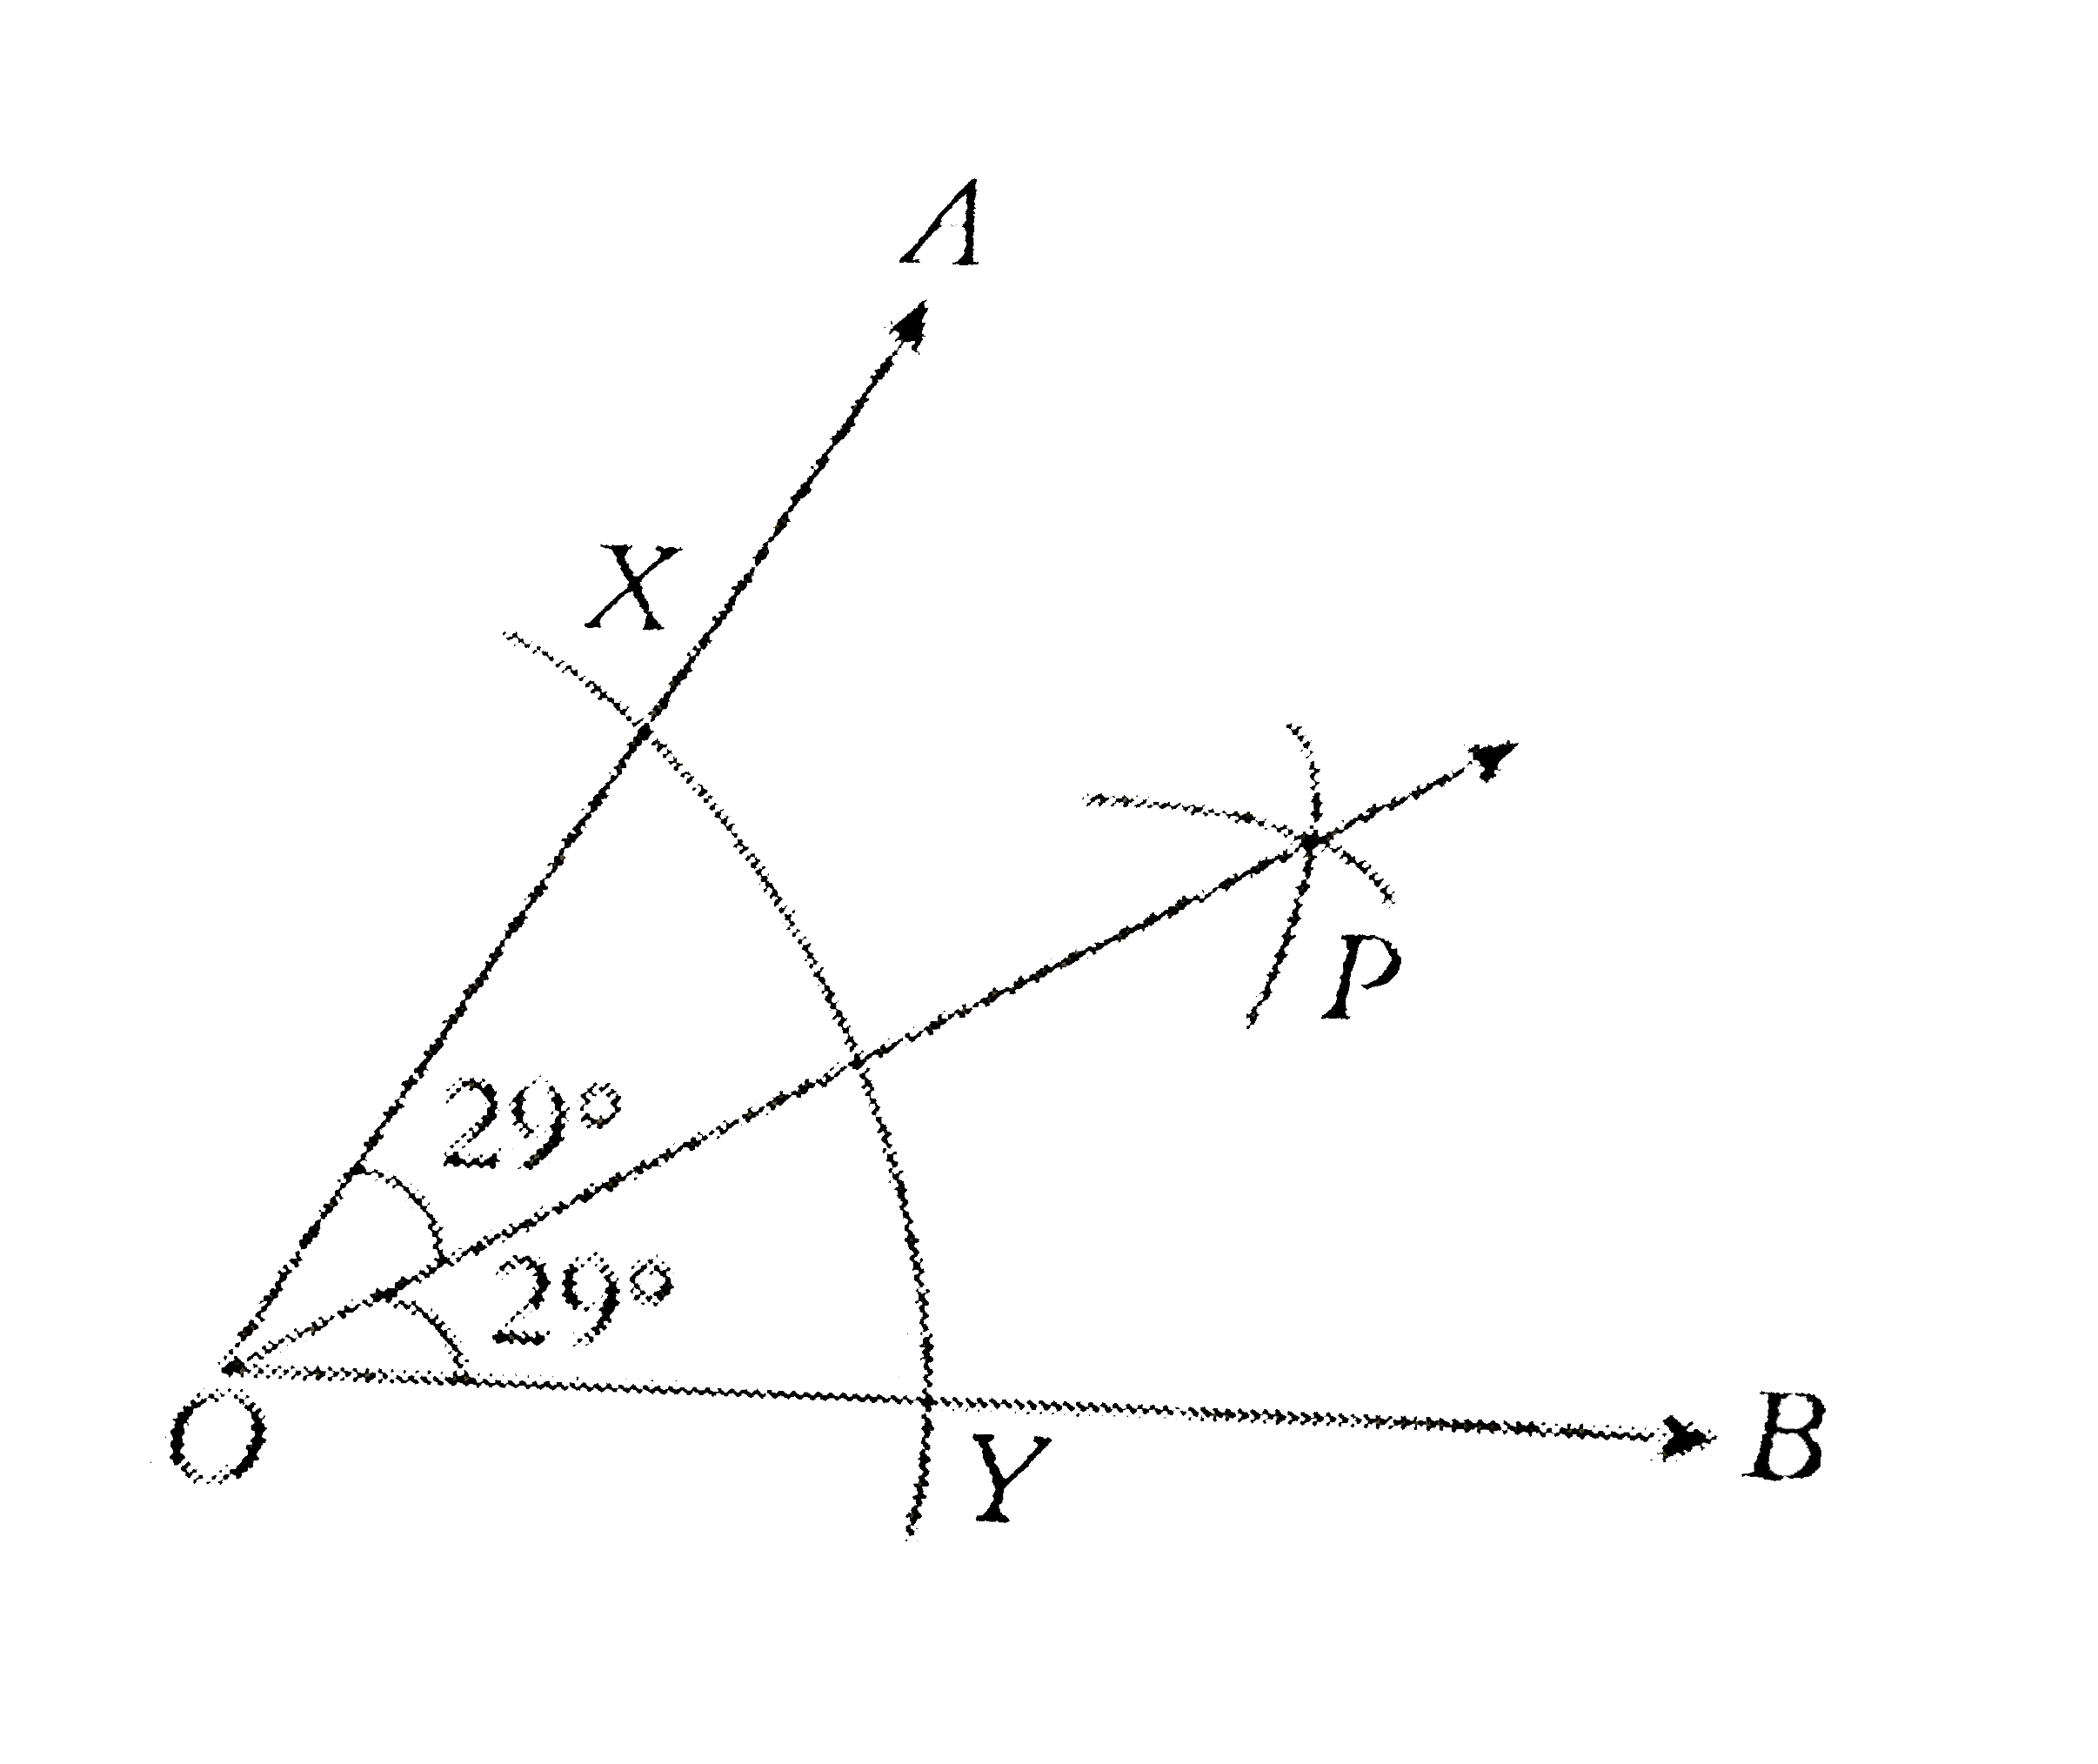
View SolutionDraw the bisector of ∠AOB=58∘

View SolutionDoes the graph below represent a function or a relation?
(##CEN_GRA_C01_S01_002_Q01.png" width="80%">
View SolutionIn the figure shown
(##AHT_PGT_PHY_C10_E01_006_Q01.png" width="80%">
View SolutionMatch List -I with List -II and select the correct answer using the codes given below :
'(##SGC_KSV_INH_P01_C05_E01_015_Q01.png" width="80%">
View Solution
