Does the graph below represent a function or a relation?
(##CEN_GRA_C01_S01_002_Q01.png" width="80%">
Vertical line x = 2 meets the above graph at (2, 1) and (2, 2). Hence the graph does not represent a function.
Topper's Solved these Questions
- BOOK - CENGAGECHAPTER - GETTING STARTED WITH GRAPHSEXERCISE - Exercise18videos
GETTING STARTED WITH GRAPHS
- BOOK - CENGAGECHAPTER - FUNCTIONSEXERCISE - Question Bank30videos
FUNCTIONS
- BOOK - CENGAGECHAPTER - GRAPH OF INVERSE TRIGONOMETRIC FUNCTIONSEXERCISE - Exercise18videos
GRAPH OF INVERSE TRIGONOMETRIC FUNCTIONS
Similar Questions
The graph of the second derivation f''(x) is given in the following figure. State the x - coordinate of the point of inflection of f. Given reasons for your answer.
(##CEN_GRA_C01_S01_024_Q01.png" width="80%">View SolutionCheck weather the following function/functions is/are periodic or not? Find the period in case the function is periodic.
(##CEN_GRA_C01_S01_013_Q01.png" width="80%">View Solution
Knowledge Check
- Question 1 - Select One
In figure ,PR = ?
(##CEN_JEE_MAT_X_C14_E01_032_Q01.png" width="80%">A20 cmB22 cmC24 cmD26 cm - Question 2 - Select One
In the figure shown
(##AHT_PGT_PHY_C10_E01_006_Q01.png" width="80%">AP>P0BP<P0CP=P0DP=0
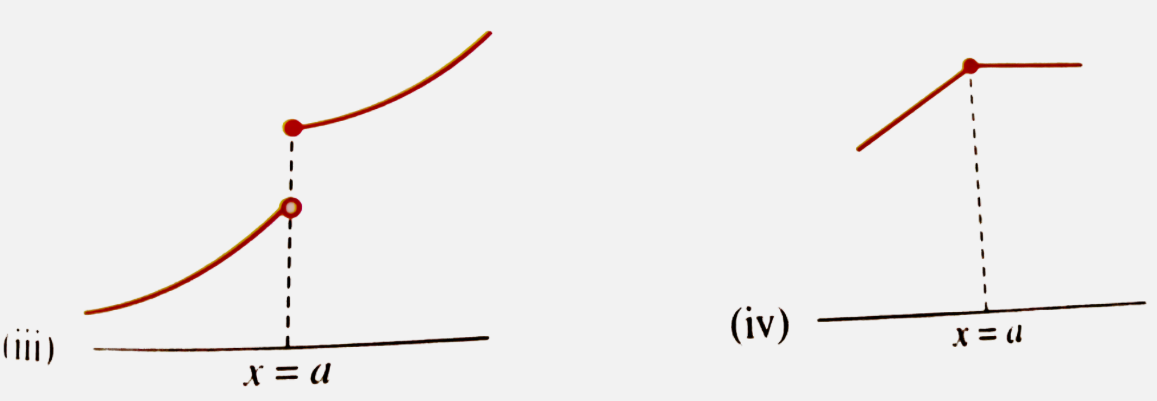
For each of the following graphs, comment whether f(x) is increasing or decreasing or neither increasing nor decreasing at x = a.
(##CEN_GRA_C01_S01_018_Q01.png" width="80%">
 View Solution
(#FIITJEE_PHY_MB_02_C01_SLV_052_Q01.png" width="80%">
View SolutionThe graph of y=f(x) is as shown in the following figure.
(##CEN_GRA_C01_S01_016_Q01.png" width="80%">
Identify the points of discontinuity and give the reason for the same.View SolutionThe figure shows the graphs of f, f' and f'' . Identify each curve and explain your choices.
(##CEN_GRA_C01_S01_025_Q01.png" width="80%">View SolutionThe graph of the derivative f'(x) is given in the following figure.
(b) Find the values of x for which f has local maximum or minimum.
(c) Find the intervals in which f is concave upward or downward.
(d) Find the point of inflection.
(##CEN_GRA_C01_S01_023_Q01.png" width="80%">View SolutionIn the following graph, state the absolute and local maximum and minimum values of the function.
(##CEN_GRA_C01_S01_022_Q01.png" width="80%">View Solution

