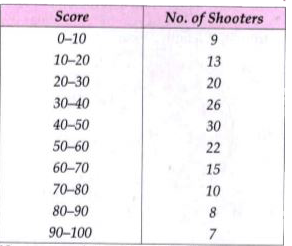
The table shows the distribution of the scores obtained by 160 shooters in a shooting competition. Use a graph sheet and draw an ogive for the distribution. (Take 2 cm = 10 scores on the X-axis and 2 cm = 20 shooters on the Y-axis)

Use your graph to estimate the following :
(i) The median.
(ii) The interquartile range.
(iii) The number of shooters who obtained a score of more than 85%.
The correct Answer is:44, 31, 11
Topper's Solved these Questions
Similar Questions
The daily wages of 80 workers in a project are given below.

Use a graph paper to draw an ogive for the above distribution. (Use a scale of 2 cm = Rs 50 on X-axis and 2 cm = 10 workers on Y-axis). Use your ogive to estimate :
the median wage of the workers.
View SolutionThe following table shows the distribution of the heights of a group of students:

Use a graph sheet to draw an Ogive for the distribution. Use the Ogive to find:
the inter quartile range
View SolutionThe daily wages of 80 workers in a project are given below.

Use a graph paper to draw an ogive for the above distribution. (Use a scale of 2 cm = Rs 50 on X-axis and 2 cm = 10 workers on Y-axis). Use your ogive to estimate :
the lower quartile wage of workers.
View SolutionMarks obtained by 200 students in an examination are given below :

Draw an ogive for the given distribution taking 2 cm = 10 marks on one axis and 2 cm = 20 students on the other axis. Using the graph, determine :
(i) The median marks
View SolutionThe weight of 50 workers is given below :

Draw an ogive of the given distribution using a graph sheet. Take 2 cm = 10 kg on one axis and 2 cm = 5 workers along the other axis. Use a graph to estimate the following the upper and lower quartiles.
View SolutionThe daily wages of 80 workers in a project are given below.

Use a graph paper to draw an ogive for the above distribution. (Use a scale of 2 cm = Rs 50 on X-axis and 2 cm = 10 workers on Y-axis). Use your ogive to estimate :
the number of workers who earn more than Rs 625 daily.
View SolutionThe weight of 50 workers is given below :

Draw an ogive of the given distribution using a graph sheet. Take 2 cm = 10 kg on one axis and 2 cm = 5 workers along the other axis. Use a graph to estimate the following: if weight 95 kg and above is considered overweight find the number of workers who are overweight.
View SolutionThe following table shows the distribution of the heights of a group of students:

Use a graph sheet to draw an Ogive for the distribution. Use the Ogive to find:
the number of students whose height is more than 168 cm
View SolutionThe following table shows the distribution of the heights of a group of students:

Use a graph sheet to draw an Ogive for the distribution. Use the Ogive to find:
the number of students whose height is less than 148 cm.
View SolutionMarks obtained by 200 students in an examination are given below :

Draw an ogive for the given distribution taking 2 cm = 10 marks on one axis and 2 cm = 20 students on the other axis. Using the graph, determine :
(ii) The number of students who failed if minimum marks required to pass is 40.
View Solution
