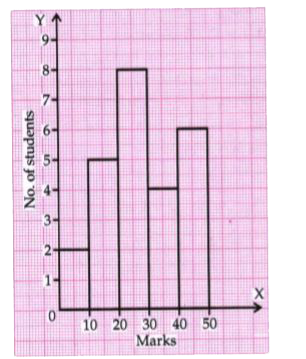
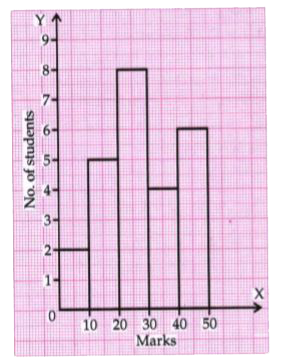
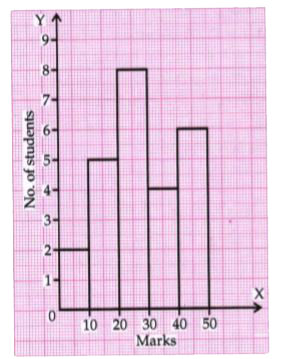
The historgam below represents the scores obtained by 25 students in a Mathematics mental test. Use the data to :
(ii) to calculate mean.

The correct Answer is:27.8
Step by step video, text & image solution for The historgam below represents the scores obtained by 25 students in a Mathematics mental test. Use the data to : (ii) to calculate mean. by Maths experts to help you in doubts & scoring excellent marks in Class 10 exams.
Updated on:21/07/2023Topper's Solved these Questions
Similar Questions
The historgam below represents the scores obtained by 25 students in a Mathematics mental test. Use the data to :
(iii) To determine the Modal class.

View SolutionThe historgam below represents the scores obtained by 25 students in a Mathematics mental test. Use the data to :
(i) Frame a frequency distribution table.

View SolutionThe histogram below represents the scores obtained by 25 students in a Mathematics mental test. Use the data to,
(i) Frame a frequency distribution table
(ii) To calculate mean
View SolutionCalculate the mean of the scores of 20 students in a mathematics test

View SolutionThe table shows the marks obtained by 25 students in a class test. Find the mean of the marks obtained

View SolutionThe distribution given below, shows the marks obtained by 25 students in an aptitude test. Find the median and mode of the distribution.
View SolutionFollowing are the marks obtained by 9 student in a mathematics test
50,69,20,33,53,39,40,65,59,
The mean deviation from the median is
View SolutionFollowing table shows the marks obtained by 8 students in English and Mathematics.

A candidate scored 85 marks in Y but was absent from the X test. Estimate his probable score for other test.
View SolutionThe frequency distribution of scores obtained by 230 candidates in a medical entrance test is as follos :

Draw a less than cumulative curve (ogive to represent the data.
View SolutionThe marks obtained by 100 students in a Mathematics test are given below :

Draw an ogive for the given distribution on a graph sheet.
(Use a scale of 2 cm = 10 units on both axis).
Use the ogive to estimate the :
(ii) lower quartile.
View Solution
