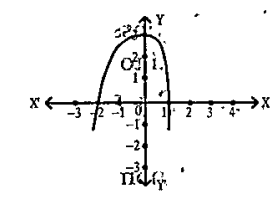
The following is the graph of a polynomial. Find the zeroes of the polynomial from the given graph.
 Solution in Telugu
−2,3
1,3
−2,1
3,0
Step by step video & image solution for The following is the graph of a polynomial. Find the zeroes of the polynomial from the given graph. by Maths experts to help you in doubts & scoring excellent marks in Class 10 exams.
Updated on:21/07/2023Topper's Solved these Questions
- POLYNOMIALSBOOK - VGS PUBLICATION-BRILLIANTCHAPTER - POLYNOMIALSEXERCISE - Creative Bits for CCE Model Examination
119 Videos
- PAIR OF LINEAR EQUATIONS IN TWO VARIABLESBOOK - VGS PUBLICATION-BRILLIANTCHAPTER - PAIR OF LINEAR EQUATIONS IN TWO VARIABLESEXERCISE - EXERCISE
262 Videos
- PROBABILITYBOOK - VGS PUBLICATION-BRILLIANTCHAPTER - PROBABILITYEXERCISE - EXERCISE
220 Videos
Similar Questions
A quadratic polynomial whose zeroes are 5 and -2 is
View SolutionThe cost of 1kg potatoes and 2 kg tomatoes was Rs. 30 on a certain day. After two days, the cost of 2 kg potatoes and 4 kg tomatoes was found to be Rs. 66.Identify the unknowns in each situation. We observe that there are two unknowns in each case.
View SolutionOutcomes of which of the following experiments are equally likely ?(1)Getting a digit 1, 2, 3, 4, 5 or 6 when a dice is rolled.(2)Selecting a different colour ball from a bag of 5 red balls, 4 blue balls and 1 blackball.Winning in a game of carrom.(3) Units place of a two digit number selected may be 0, 1, 2, 3, 4, 5, 6, 7, 8 or 9.(4) Selecting a different colour ball from a bag of 10 red balls, 10 blue balls and 10 black balls.(5) Raining on a particular day of July.Are the outcomes of every experiment equally likely?
View SolutionWhich of the following are correct chain isomers of butane ? (i)
View SolutionDetermine the point of symmetry of a regular hexagon.
View SolutionDtermine the images of the following figure about the given line :
View SolutionMatch the following Column A to Column B

View SolutionMatch the following Column A to Column B

View SolutionMatch the following Column A to Column B

View SolutionFind the area of figure given below.

View SolutionFind the perimeter of the figure given below.

View SolutionFind the area of the figure given below.

View SolutionThe inequation represented by the graph given below is :
View SolutionThe inequation that best describes the graph given below is _________
View SolutionThe inequation that best describes the following graph is _________
View SolutionWhich inequations represent the shaded region in the given figure
View Solution
