On Ellingham diagrams if two graphs intersect each other, what does the point of intersection indicate ?
ΔG<0
ΔG=0
ΔG>0
Depends upon other conditions
To answer the question regarding the intersection of two graphs on an Ellingham diagram, we can follow these steps:
1. Understanding the Ellingham Diagram:
- The Ellingham diagram is a graphical representation that plots the standard Gibbs free energy change (ΔG°) against temperature (T). It is used to analyze the stability of oxides and sulfides and their ease of reduction.
2. Identifying the Axes:
- On the Ellingham diagram, the y-axis represents the standard Gibbs free energy change (ΔG°), while the x-axis represents the temperature (T).
3. Interpreting the Graphs:
- Each line on the Ellingham diagram corresponds to a specific reaction, typically the formation of an oxide or sulfide from its elements.
4. Understanding Intersection Points:
- When two lines intersect on the Ellingham diagram, it indicates that at that specific temperature, the Gibbs free energy change (ΔG°) for both reactions is equal.
5. Significance of ΔG° = 0:
- The point of intersection signifies that the Gibbs free energy change (ΔG) for the reactions represented by the two lines is zero at that temperature. This means that the two reactions are at equilibrium at that temperature.
6. Conclusion:
- Therefore, the point of intersection on the Ellingham diagram indicates that the two reactions can occur under the same conditions, and it is a critical point for determining the feasibility of reduction processes.
Final Answer:
The point of intersection of two graphs on an Ellingham diagram indicates that the Gibbs free energy change (ΔG) for both reactions is equal to zero at that temperature, signifying equilibrium between the two reactions.
---
- The Ellingham diagram is a graphical representation that plots the standard Gibbs free energy change (ΔG°) against temperature (T). It is used to analyze the stability of oxides and sulfides and their ease of reduction.
- On the Ellingham diagram, the y-axis represents the standard Gibbs free energy change (ΔG°), while the x-axis represents the temperature (T).
- Each line on the Ellingham diagram corresponds to a specific reaction, typically the formation of an oxide or sulfide from its elements.
- When two lines intersect on the Ellingham diagram, it indicates that at that specific temperature, the Gibbs free energy change (ΔG°) for both reactions is equal.
- The point of intersection signifies that the Gibbs free energy change (ΔG) for the reactions represented by the two lines is zero at that temperature. This means that the two reactions are at equilibrium at that temperature.
- Therefore, the point of intersection on the Ellingham diagram indicates that the two reactions can occur under the same conditions, and it is a critical point for determining the feasibility of reduction processes.
The point of intersection of two graphs on an Ellingham diagram indicates that the Gibbs free energy change (ΔG) for both reactions is equal to zero at that temperature, signifying equilibrium between the two reactions.
Topper's Solved these Questions
- GENERAL PRINCIPLES AND PROCESSES OF ISOLATION OF ELEMENTSBOOK - AAKASH INSTITUTE ENGLISHCHAPTER - GENERAL PRINCIPLES AND PROCESSES OF ISOLATION OF ELEMENTSEXERCISE - Objective type Questions (More than one option are correct)
11 Videos
- GENERAL PRINCIPLES AND PROCESSES OF ISOLATION OF ELEMENTSBOOK - AAKASH INSTITUTE ENGLISHCHAPTER - GENERAL PRINCIPLES AND PROCESSES OF ISOLATION OF ELEMENTSEXERCISE - Linked Comprehension Type Questions
9 Videos
- GENERAL PRINCIPLES AND PROCESSES OF ISOLATION OF ELEMENTSBOOK - AAKASH INSTITUTE ENGLISHCHAPTER - GENERAL PRINCIPLES AND PROCESSES OF ISOLATION OF ELEMENTSEXERCISE - Try Yourself
33 Videos
- GENERAL PRINCIPLES AND PROCESSES OF ISOLATION OF ELEMENTSBOOK - AAKASH INSTITUTE ENGLISHCHAPTER - GENERAL PRINCIPLES AND PROCESSES OF ISOLATION OF ELEMENTSEXERCISE - Assignment (Section-D) Assertion-Reason Type Question
15 Videos
- HALOALKANES AND HALOARENES BOOK - AAKASH INSTITUTE ENGLISHCHAPTER - HALOALKANES AND HALOARENES EXERCISE - ASSIGNMENT SECTION -D
15 Videos
Similar Questions
Can two isothermal curves intersect each other?
View SolutionMagnetic lines of force may intersect each other.
View SolutionSTATEMENT -1 : No two electric field line can intersect each other.
and
STATEMENT-2 : At point of intersection electric fieldmust be zero.
View SolutionTwo circles touching both the axes intersect at (3,-2) then the coordinates of their other point of intersection is
View SolutionProve that the line of centres of two intersecting circles subtends equal angles at the two points of intersection
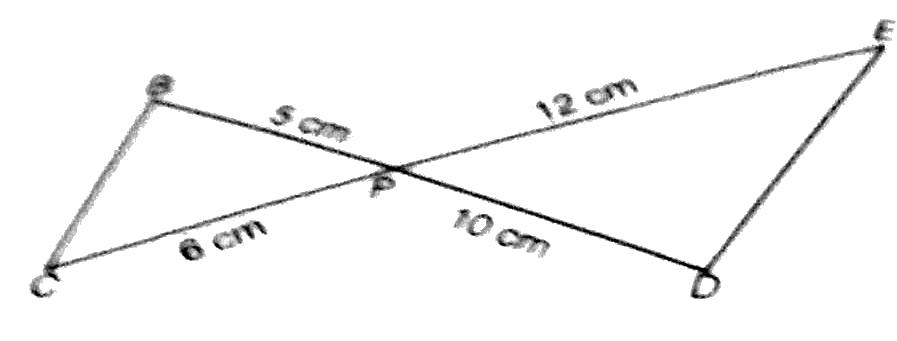
View SolutionIn figure BD and CE intersect each other at the point P. IsΔPBC~ΔPDE? Why?

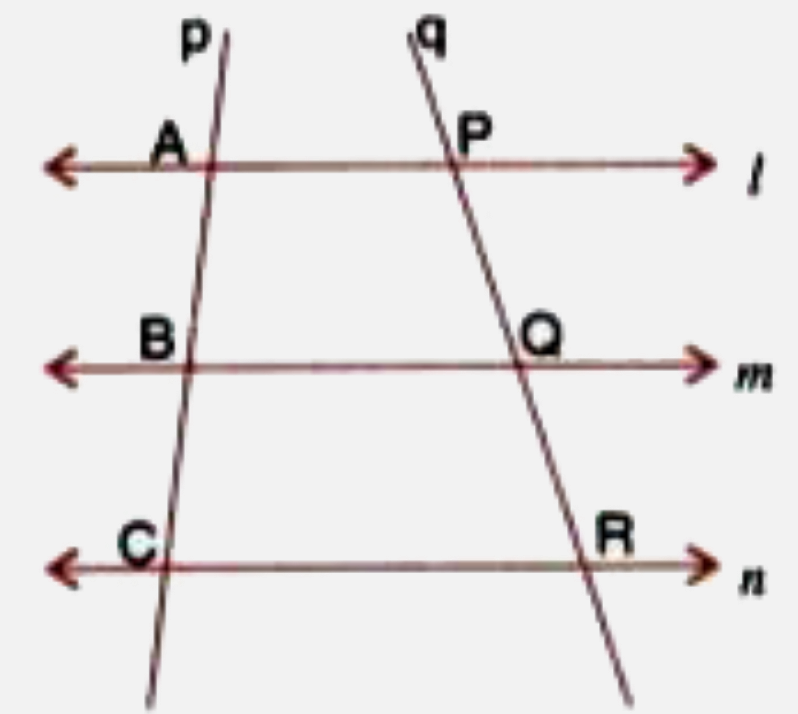
View SolutionIn the following diagram, lines l, m and n are parallel to each other. Two transversals p and q intersect the parallel lines at points A, B, C and P, Q, R as shown.

Prove that : ABBC=PQQR
Join A and R. Let AR meets BQ at point D.
View Solution(A) : No two electric lines of force can intersect each other
(R ): Tangent at any point of electric line of force gives the direction of electric field.
View SolutionIn some cases, Ellingham diagrams (graphs) show a bend. What do you refer from it ?
View SolutionIn some cases, Ellingham diagrams (graphs) show a bend. What do you refer from it ?
View Solution
