Which of the following can represent a linear function for each x∈R ?
A
f(x)=x2+5
B
f(x)=1x2
C
f(x)=mx+c,m≠0
D
f(x)=x3+3x2+2
Video Solution
Text Solution
The correct Answer is:C
|
Answer
Step by step video & image solution for Which of the following can represent a linear function for each x in R ? by Maths experts to help you in doubts & scoring excellent marks in Class 12 exams.
Updated on:21/07/2023Topper's Solved these Questions
- RELATIONS AND FUNCTIONS BOOK - AAKASH INSTITUTE ENGLISHCHAPTER - RELATIONS AND FUNCTIONS EXERCISE - Assignment (Section - B) Objective Type Questions (one option is correct)
86 Videos
- RELATIONS AND FUNCTIONS BOOK - AAKASH INSTITUTE ENGLISHCHAPTER - RELATIONS AND FUNCTIONS EXERCISE - Assignment (Section - C) Objective Type Questions (More than one option are correct)
17 Videos
- RELATIONS AND FUNCTIONS BOOK - AAKASH INSTITUTE ENGLISHCHAPTER - RELATIONS AND FUNCTIONS EXERCISE - Try Yourself
70 Videos
- PROBABILITYBOOK - AAKASH INSTITUTE ENGLISHCHAPTER - PROBABILITYEXERCISE - ASSIGNMENT SECTION-J (aakash challengers questions)
11 Videos
- SEQUENCES AND SERIES BOOK - AAKASH INSTITUTE ENGLISHCHAPTER - SEQUENCES AND SERIES EXERCISE - Assignment (SECTION - J) Aakash Challengers
11 Videos
Similar Questions
Knowledge Check
A function f(x) is defined as even if and only if f(x)=f(−x) for all real values of x. Which one of the following graphs represents an even function f(x) ?
A B
B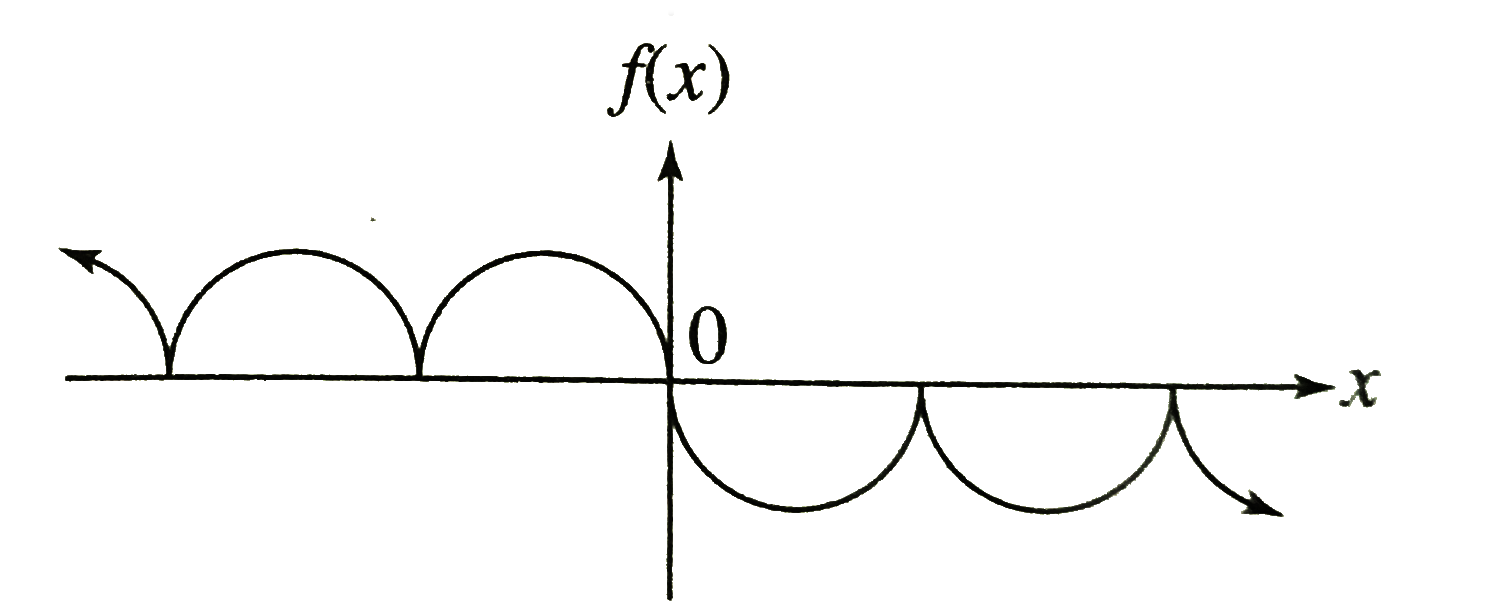 C
C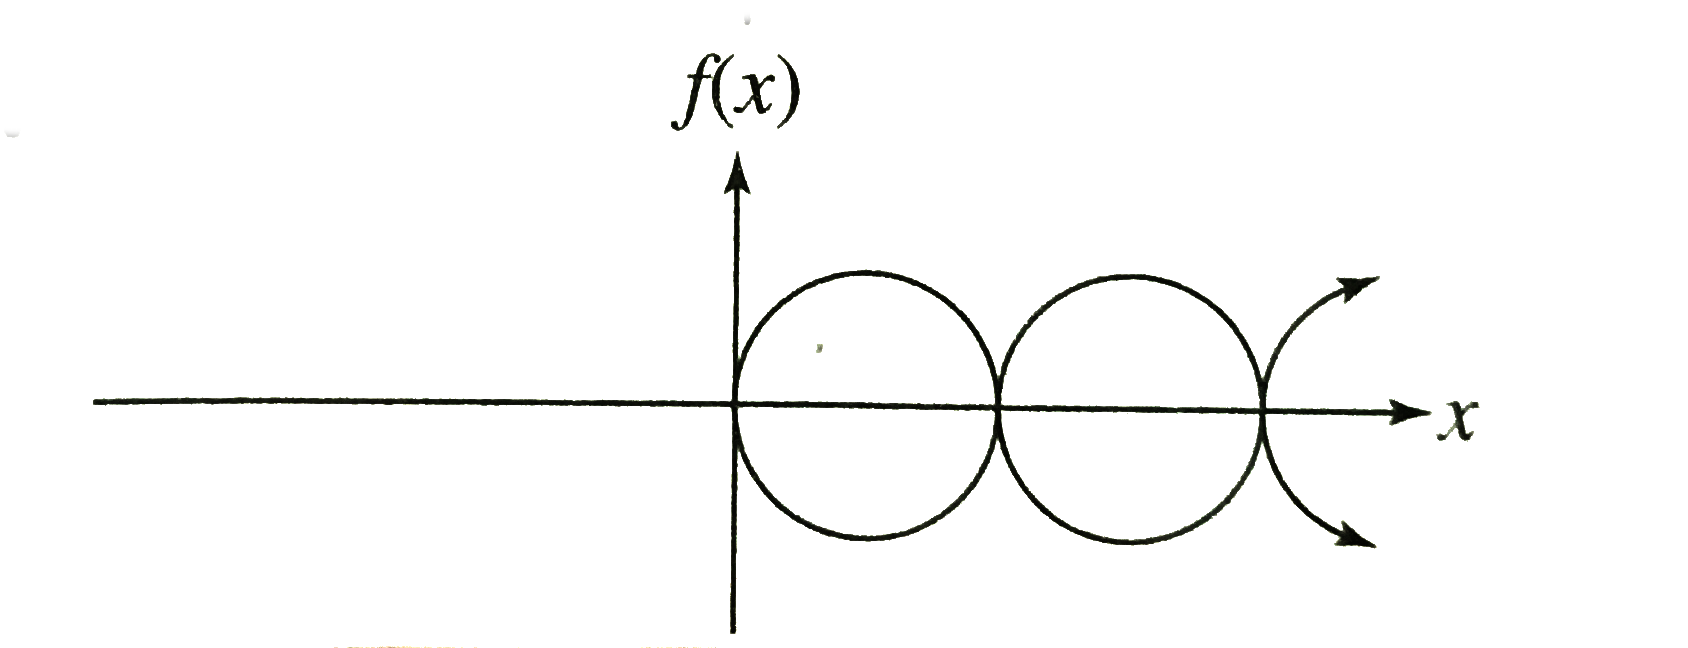 D
D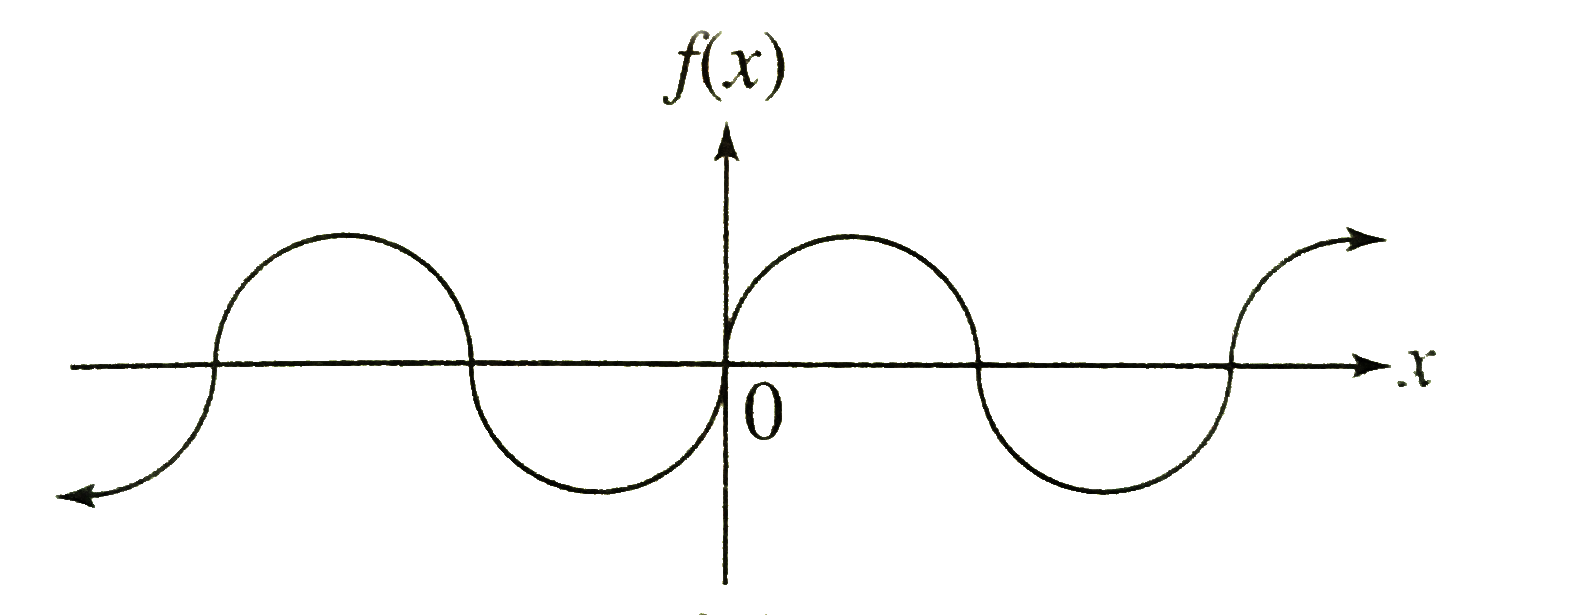
Which of the following represents the functions of veins in the leaves ?
ATransport of organic food materialBMechanical supportCTransport of organic food materialDAll of these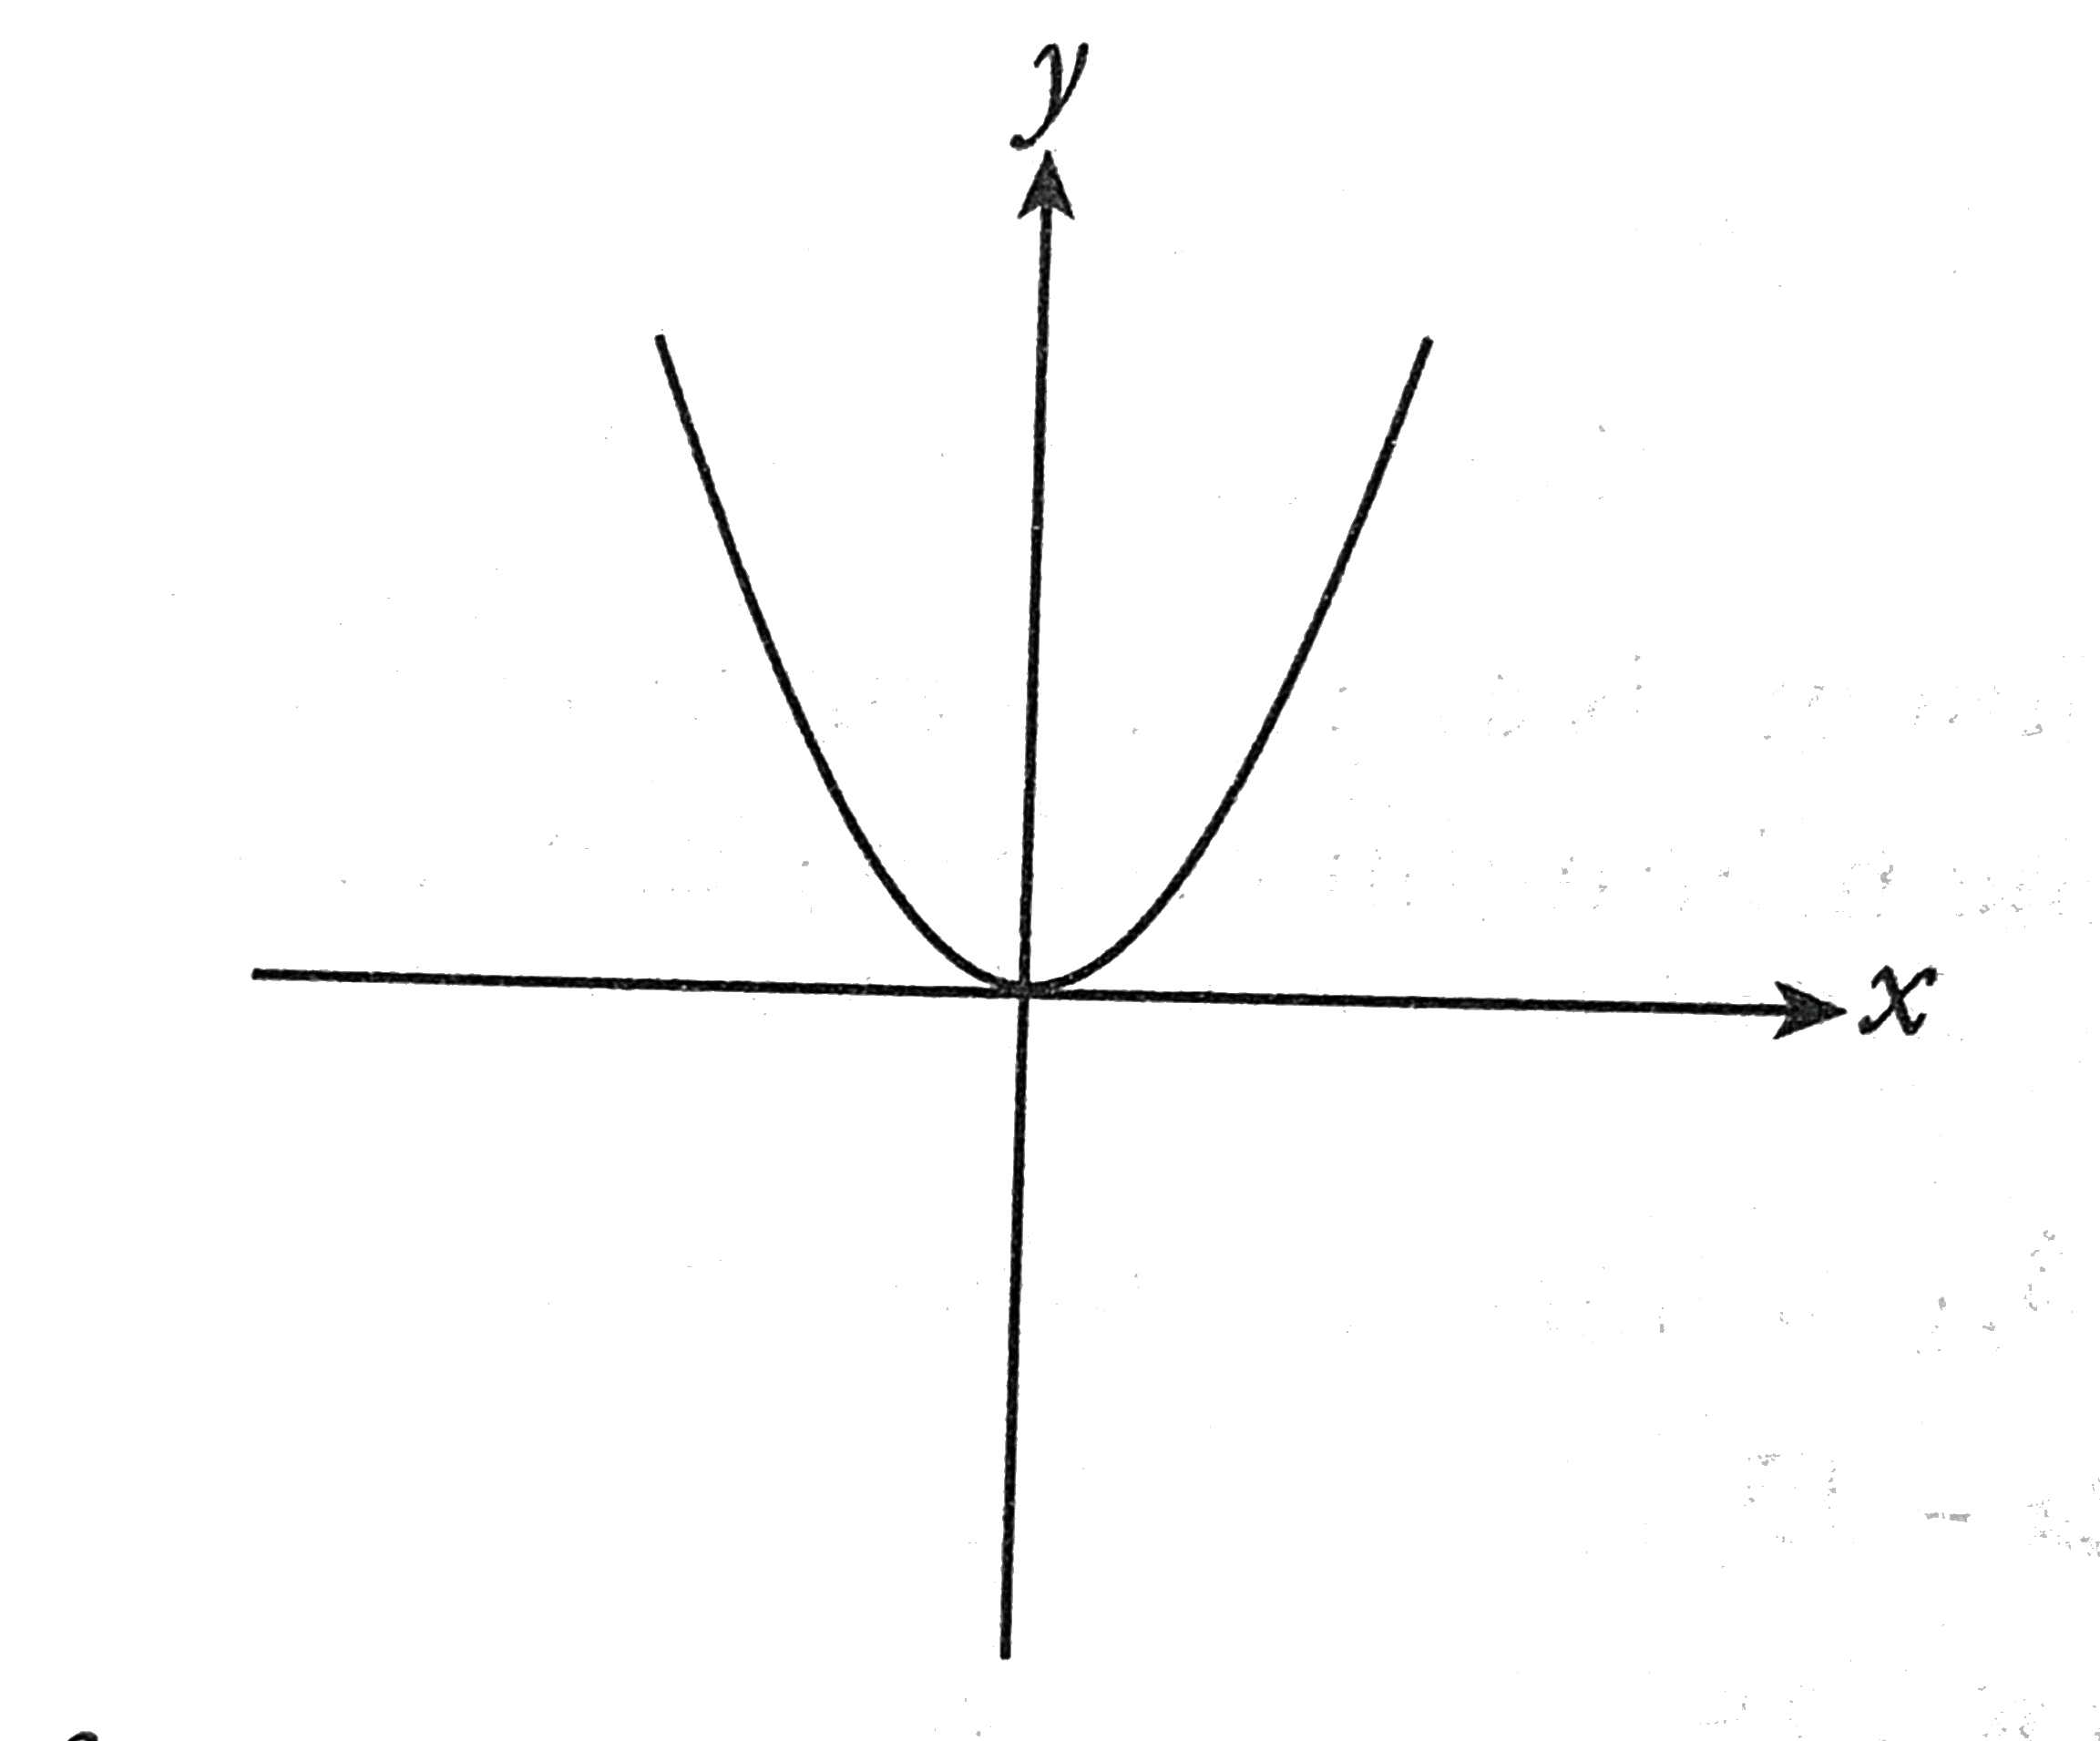
The quadratic y=f(x) is shown above. Which of the following graphs represents the function y=f(x+3)−4?A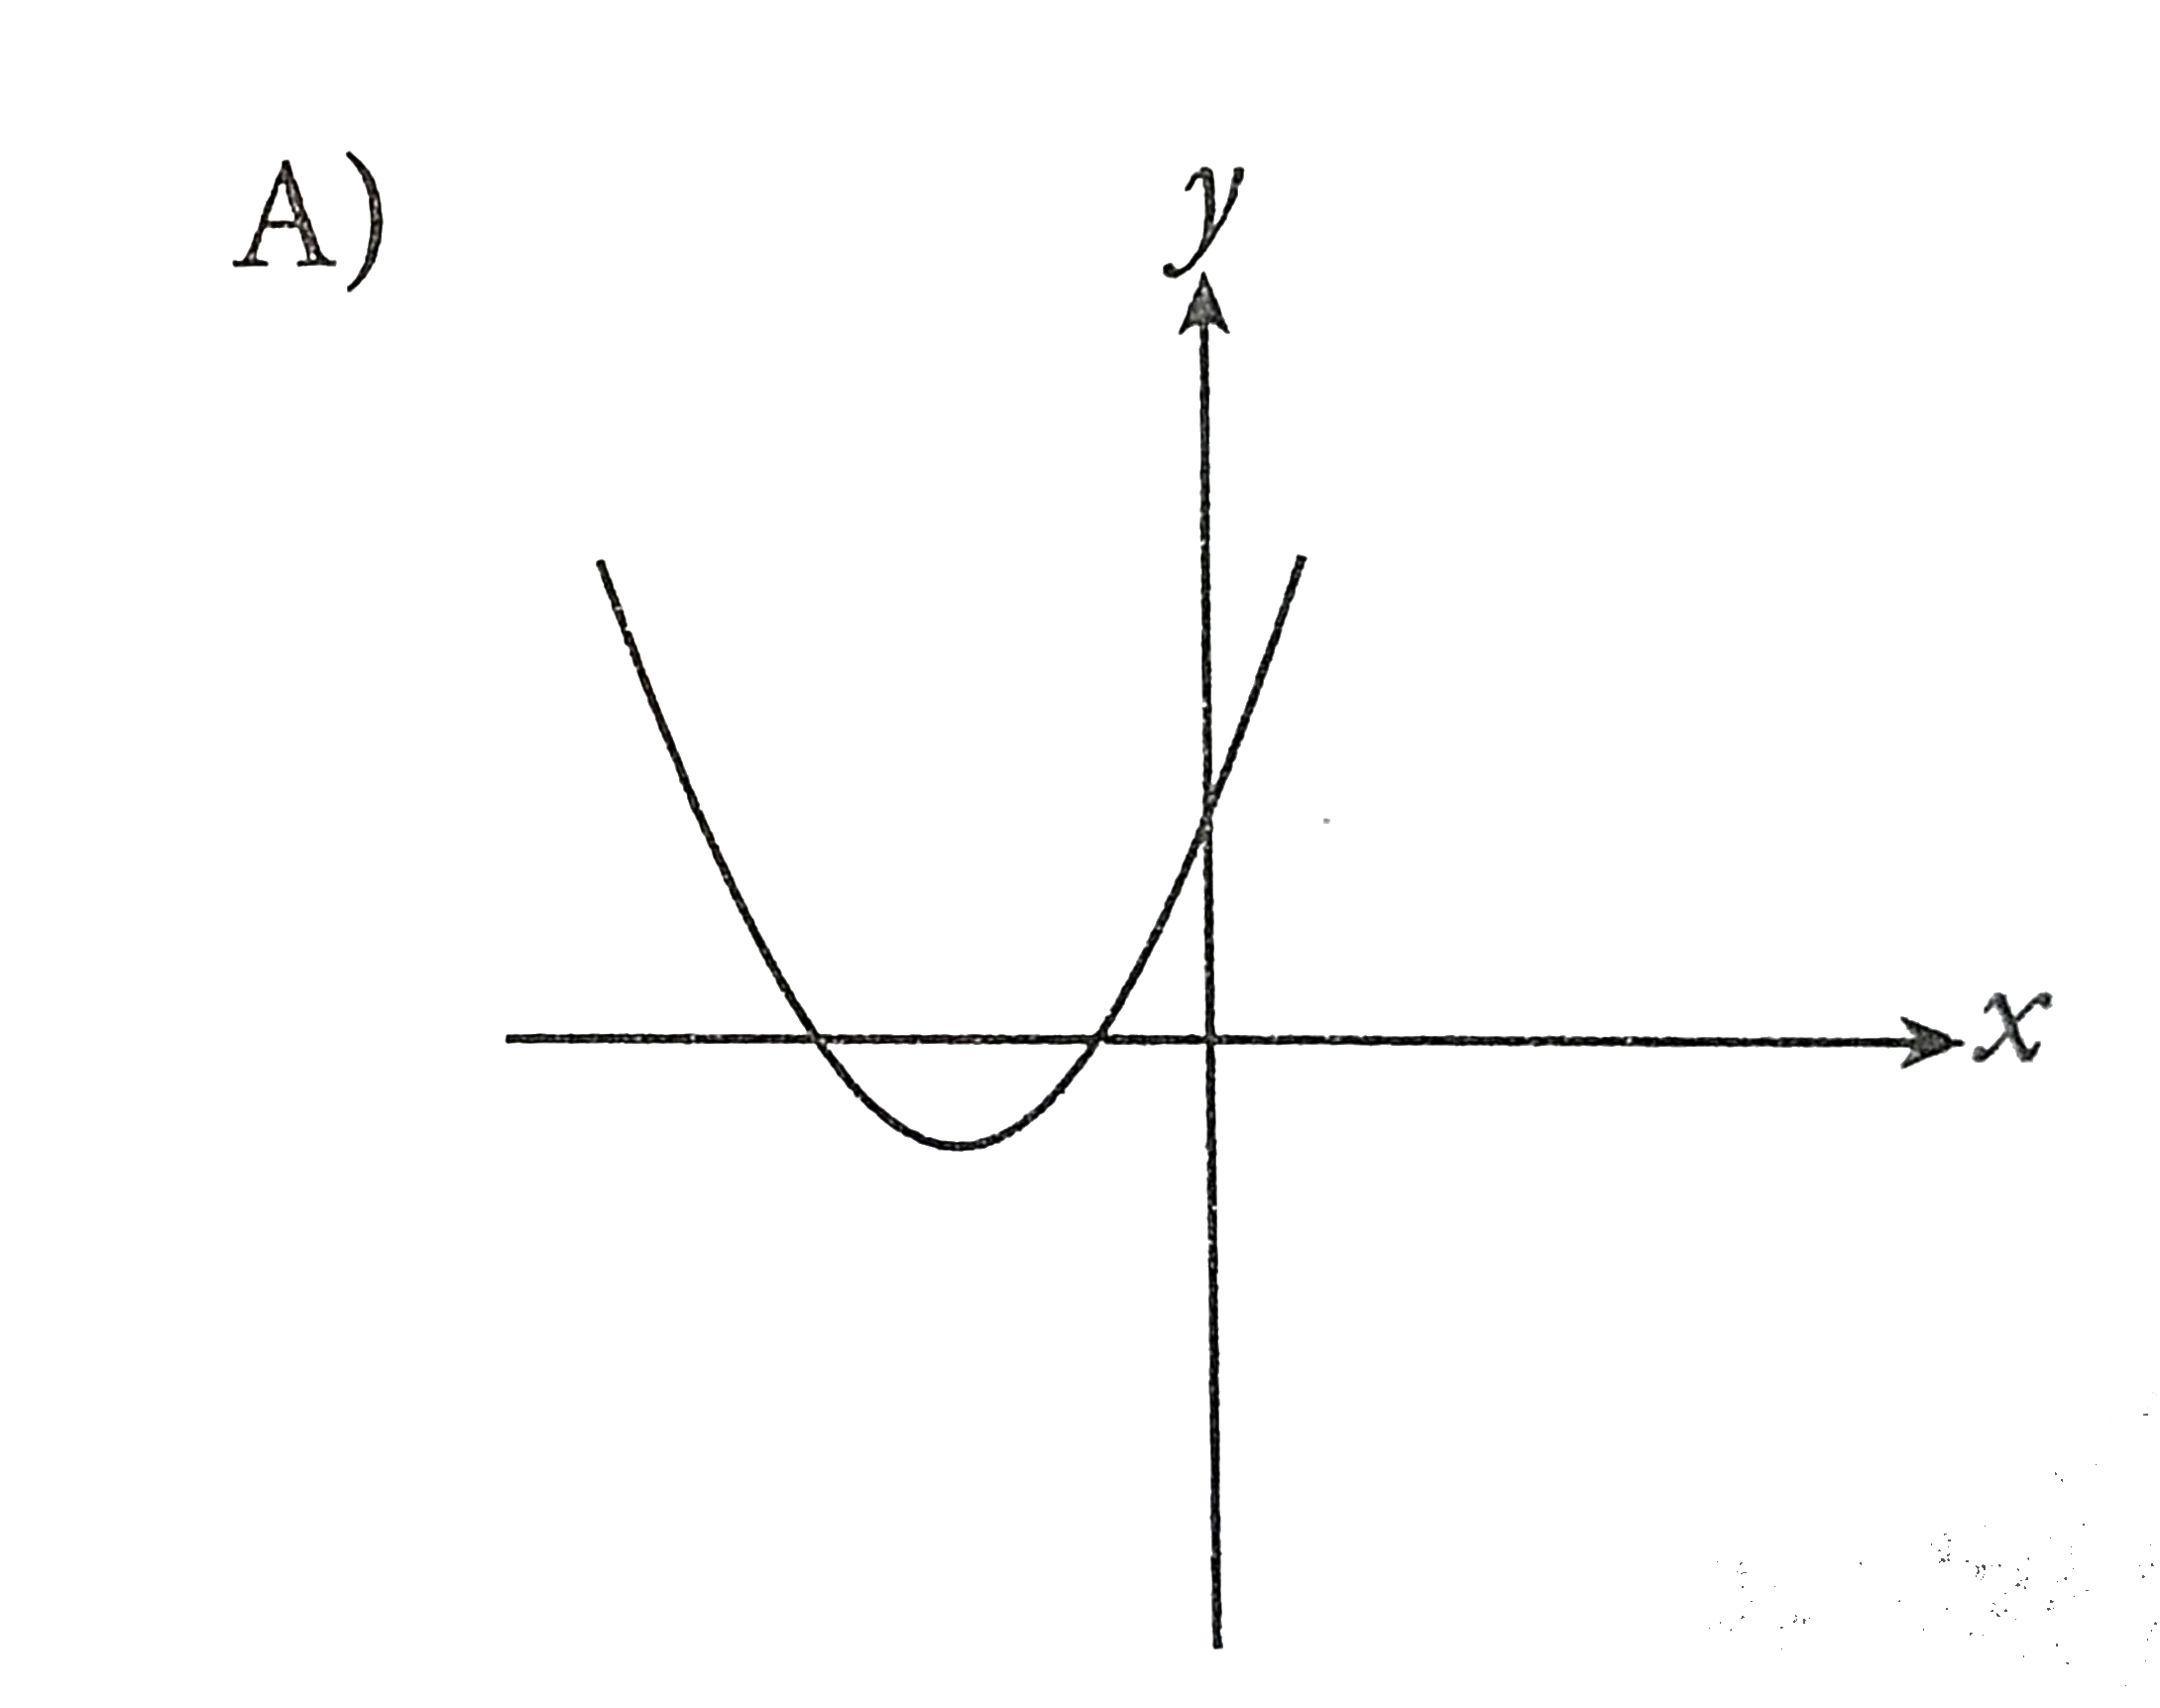 B
B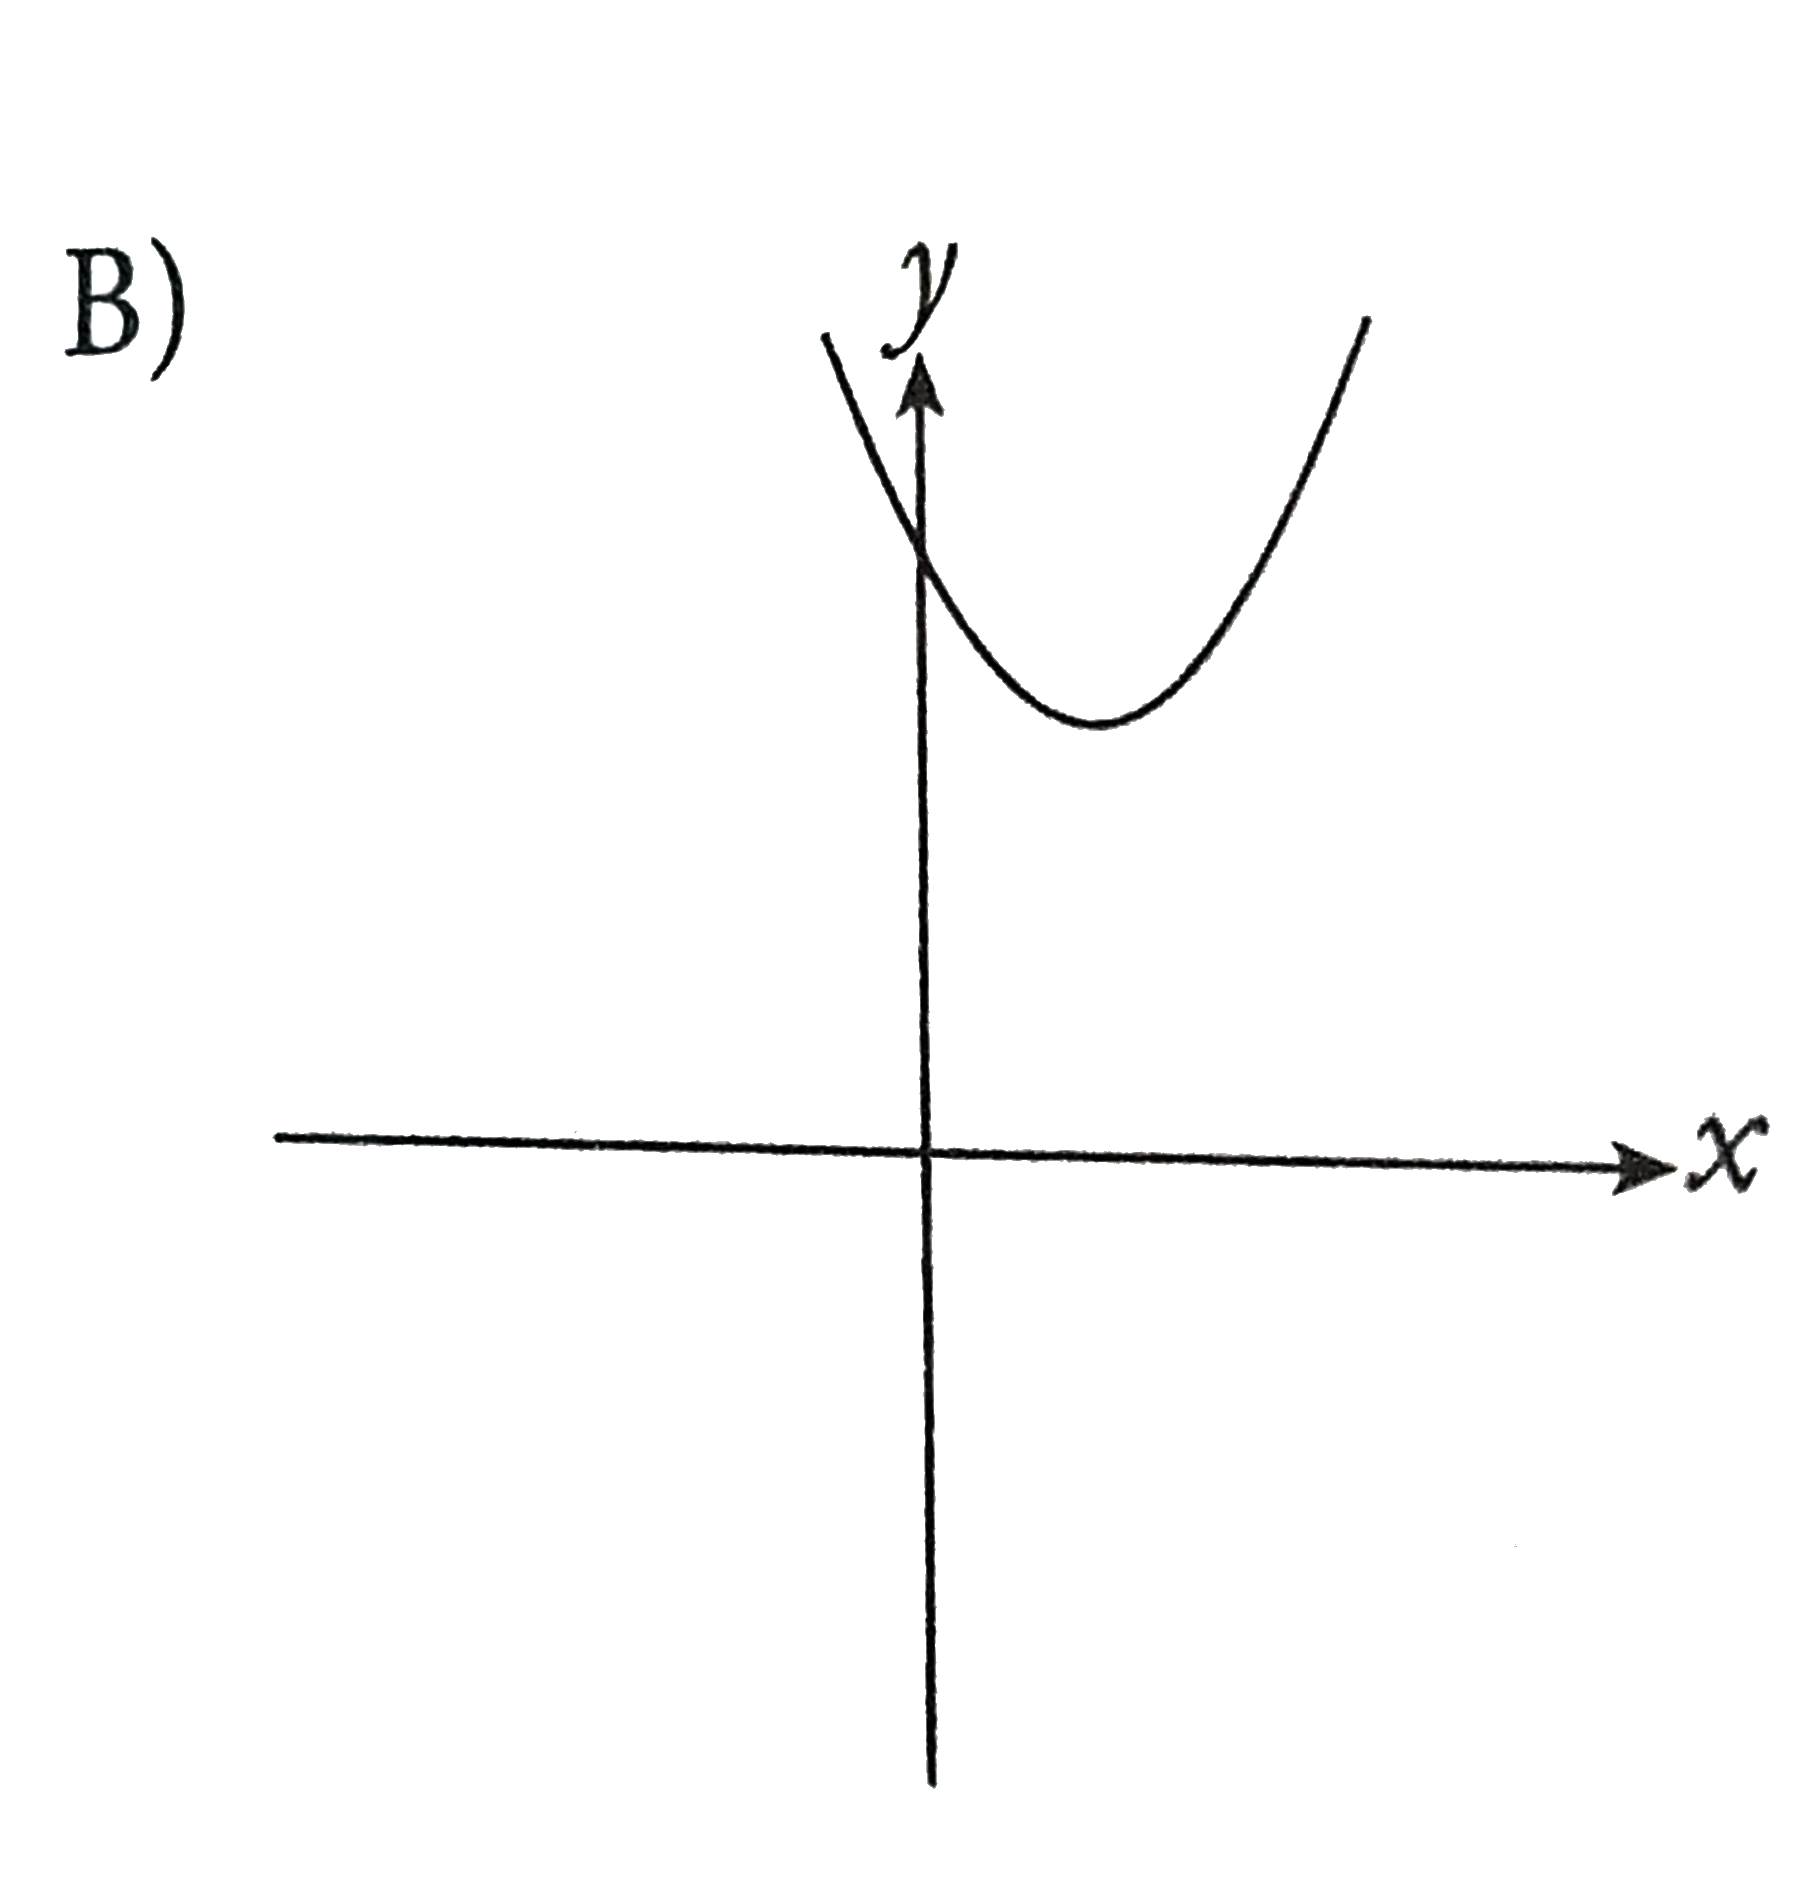 C
C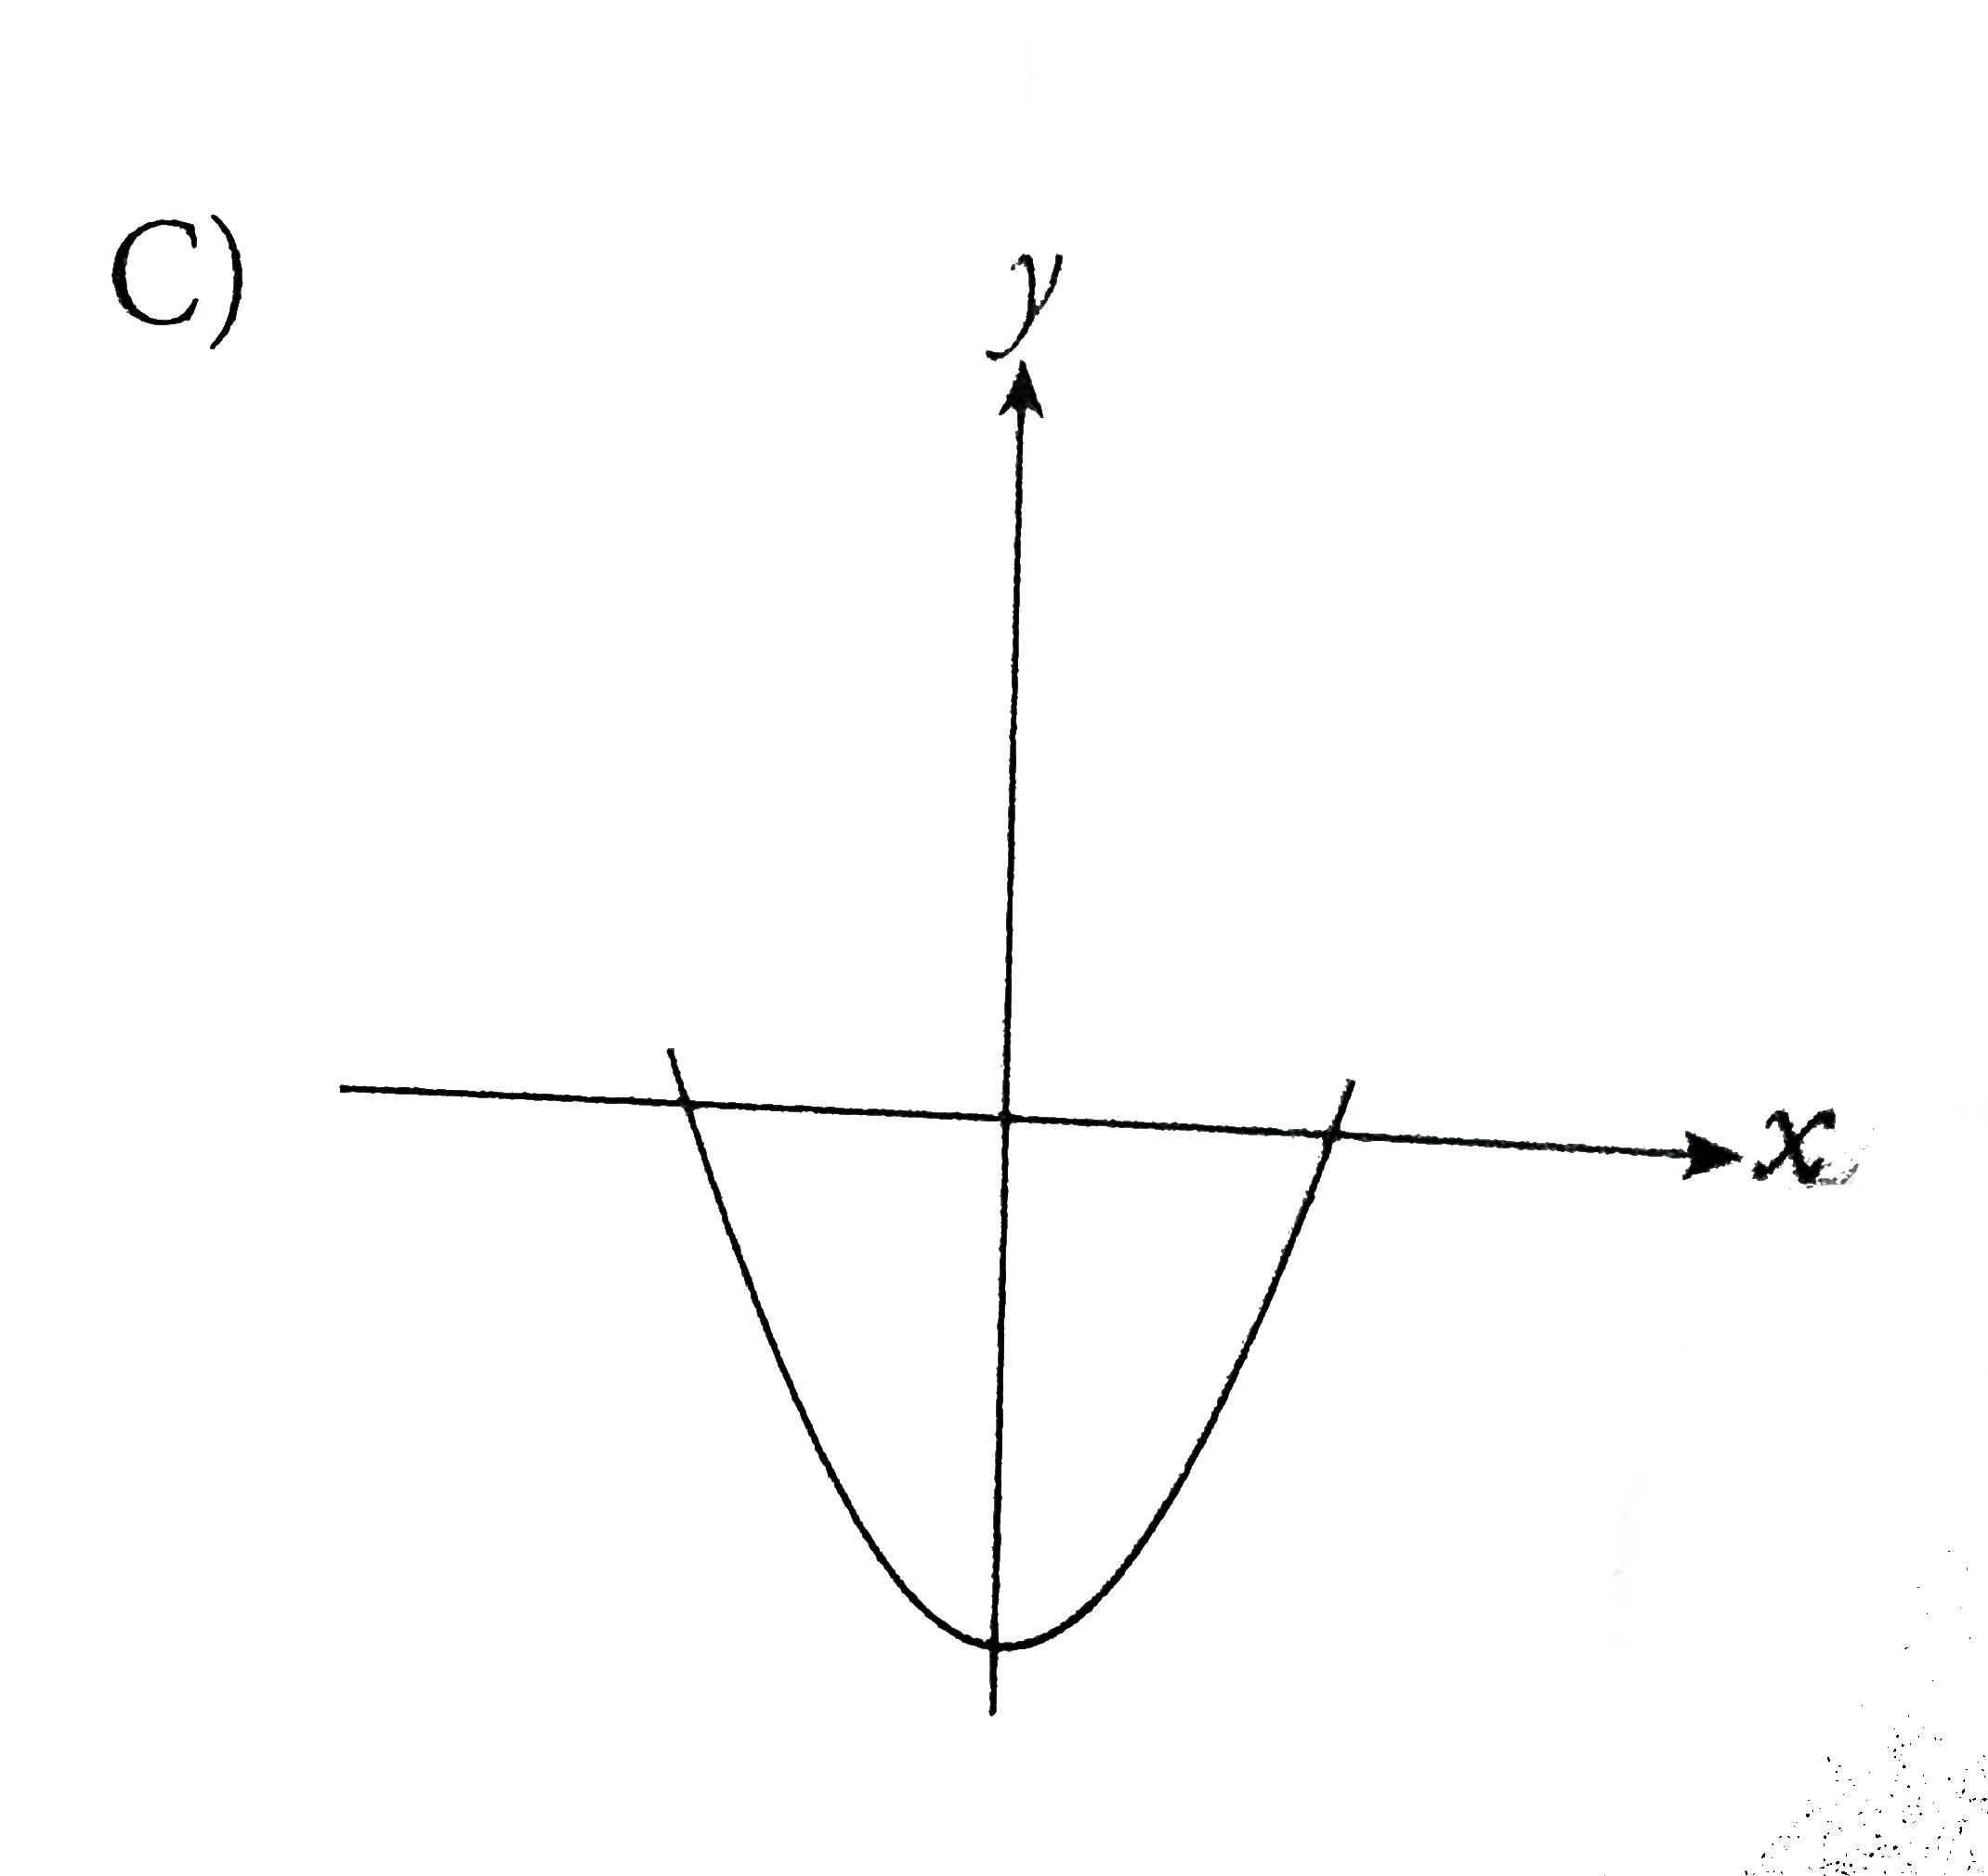 D
D
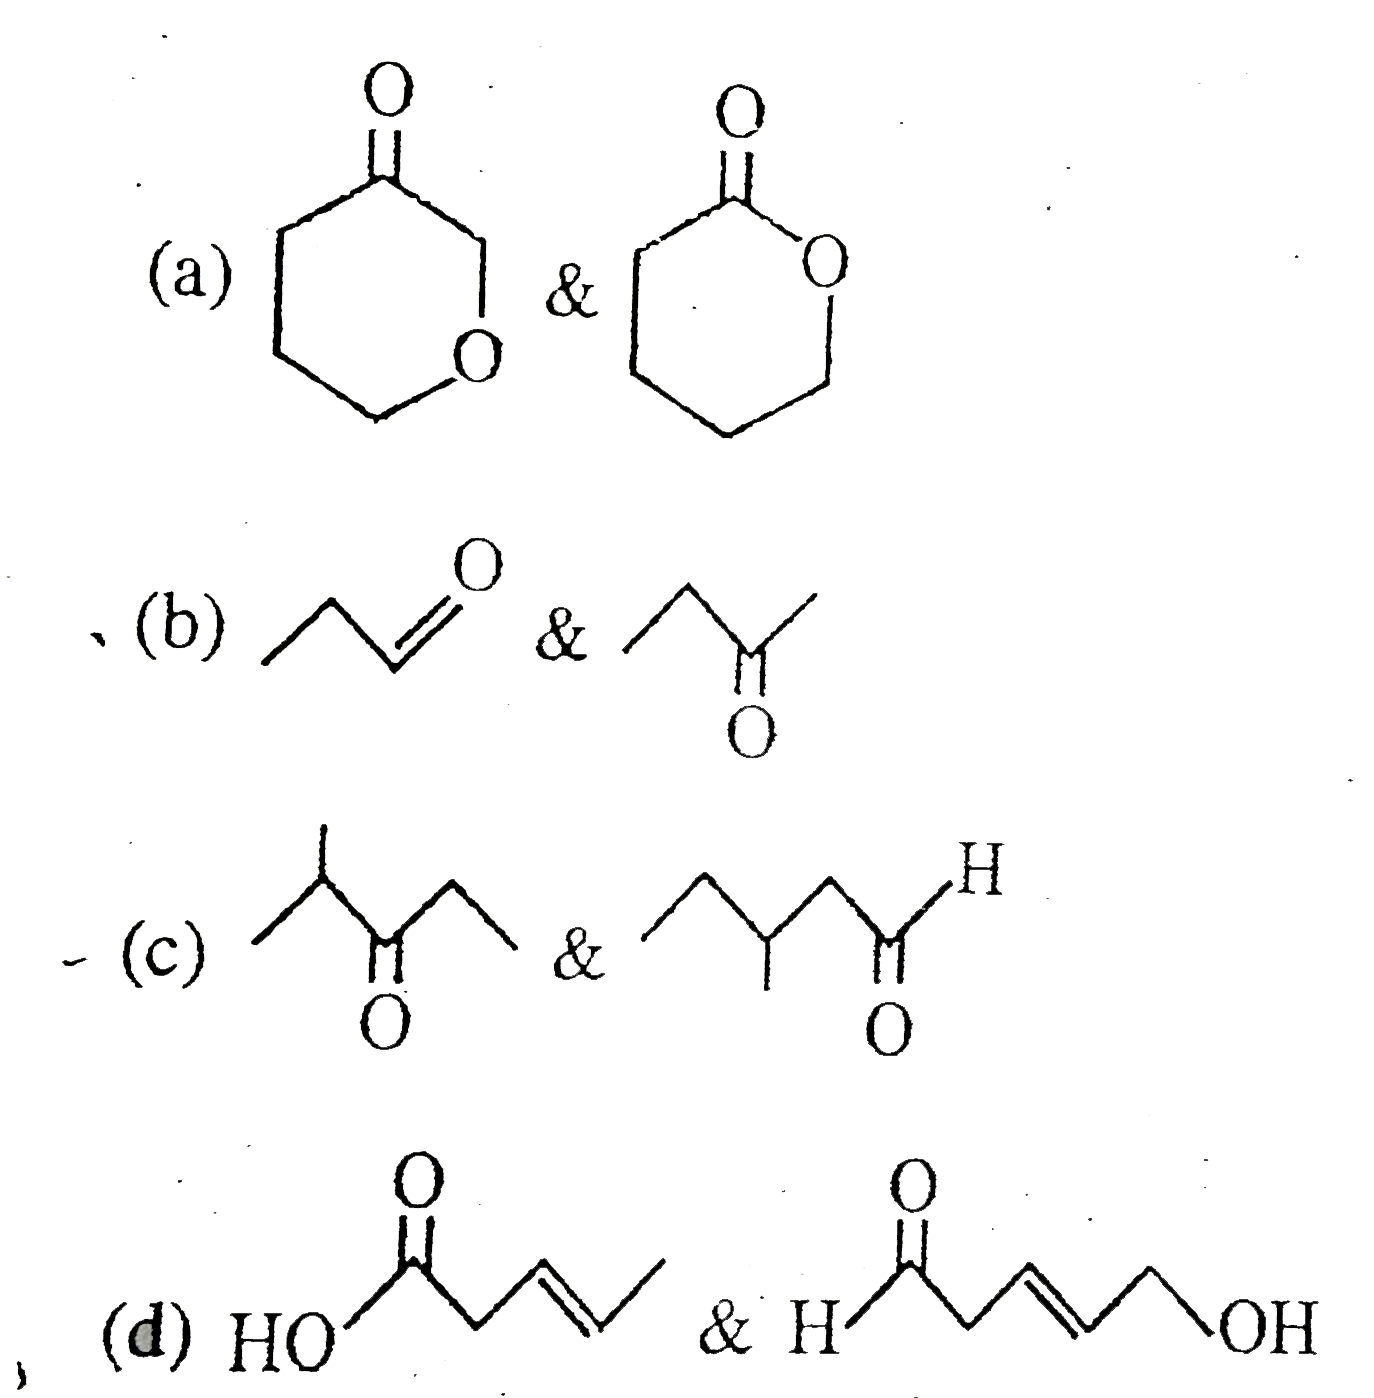
Which of the following are not functional isomers of each other ?
View SolutionWhich of the following can represent the curve x2=−2y ?
View SolutionWhich one of the following graphs represent a one-one function? (FIGURE)
View SolutionWhich of the following function x has range R :
View SolutionWhich of the following arrow diagrams represents a function from Xto Y?
View Solution

