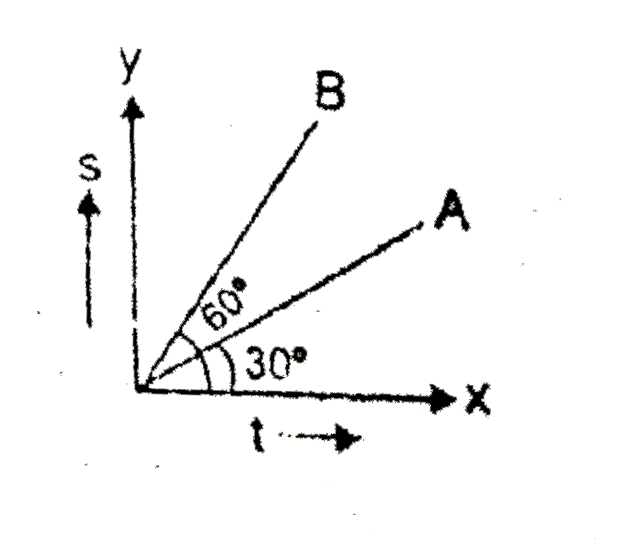
The displacement-time graph of two moving objects A and B are shown in the figure given below. Which of the following is incorrect?
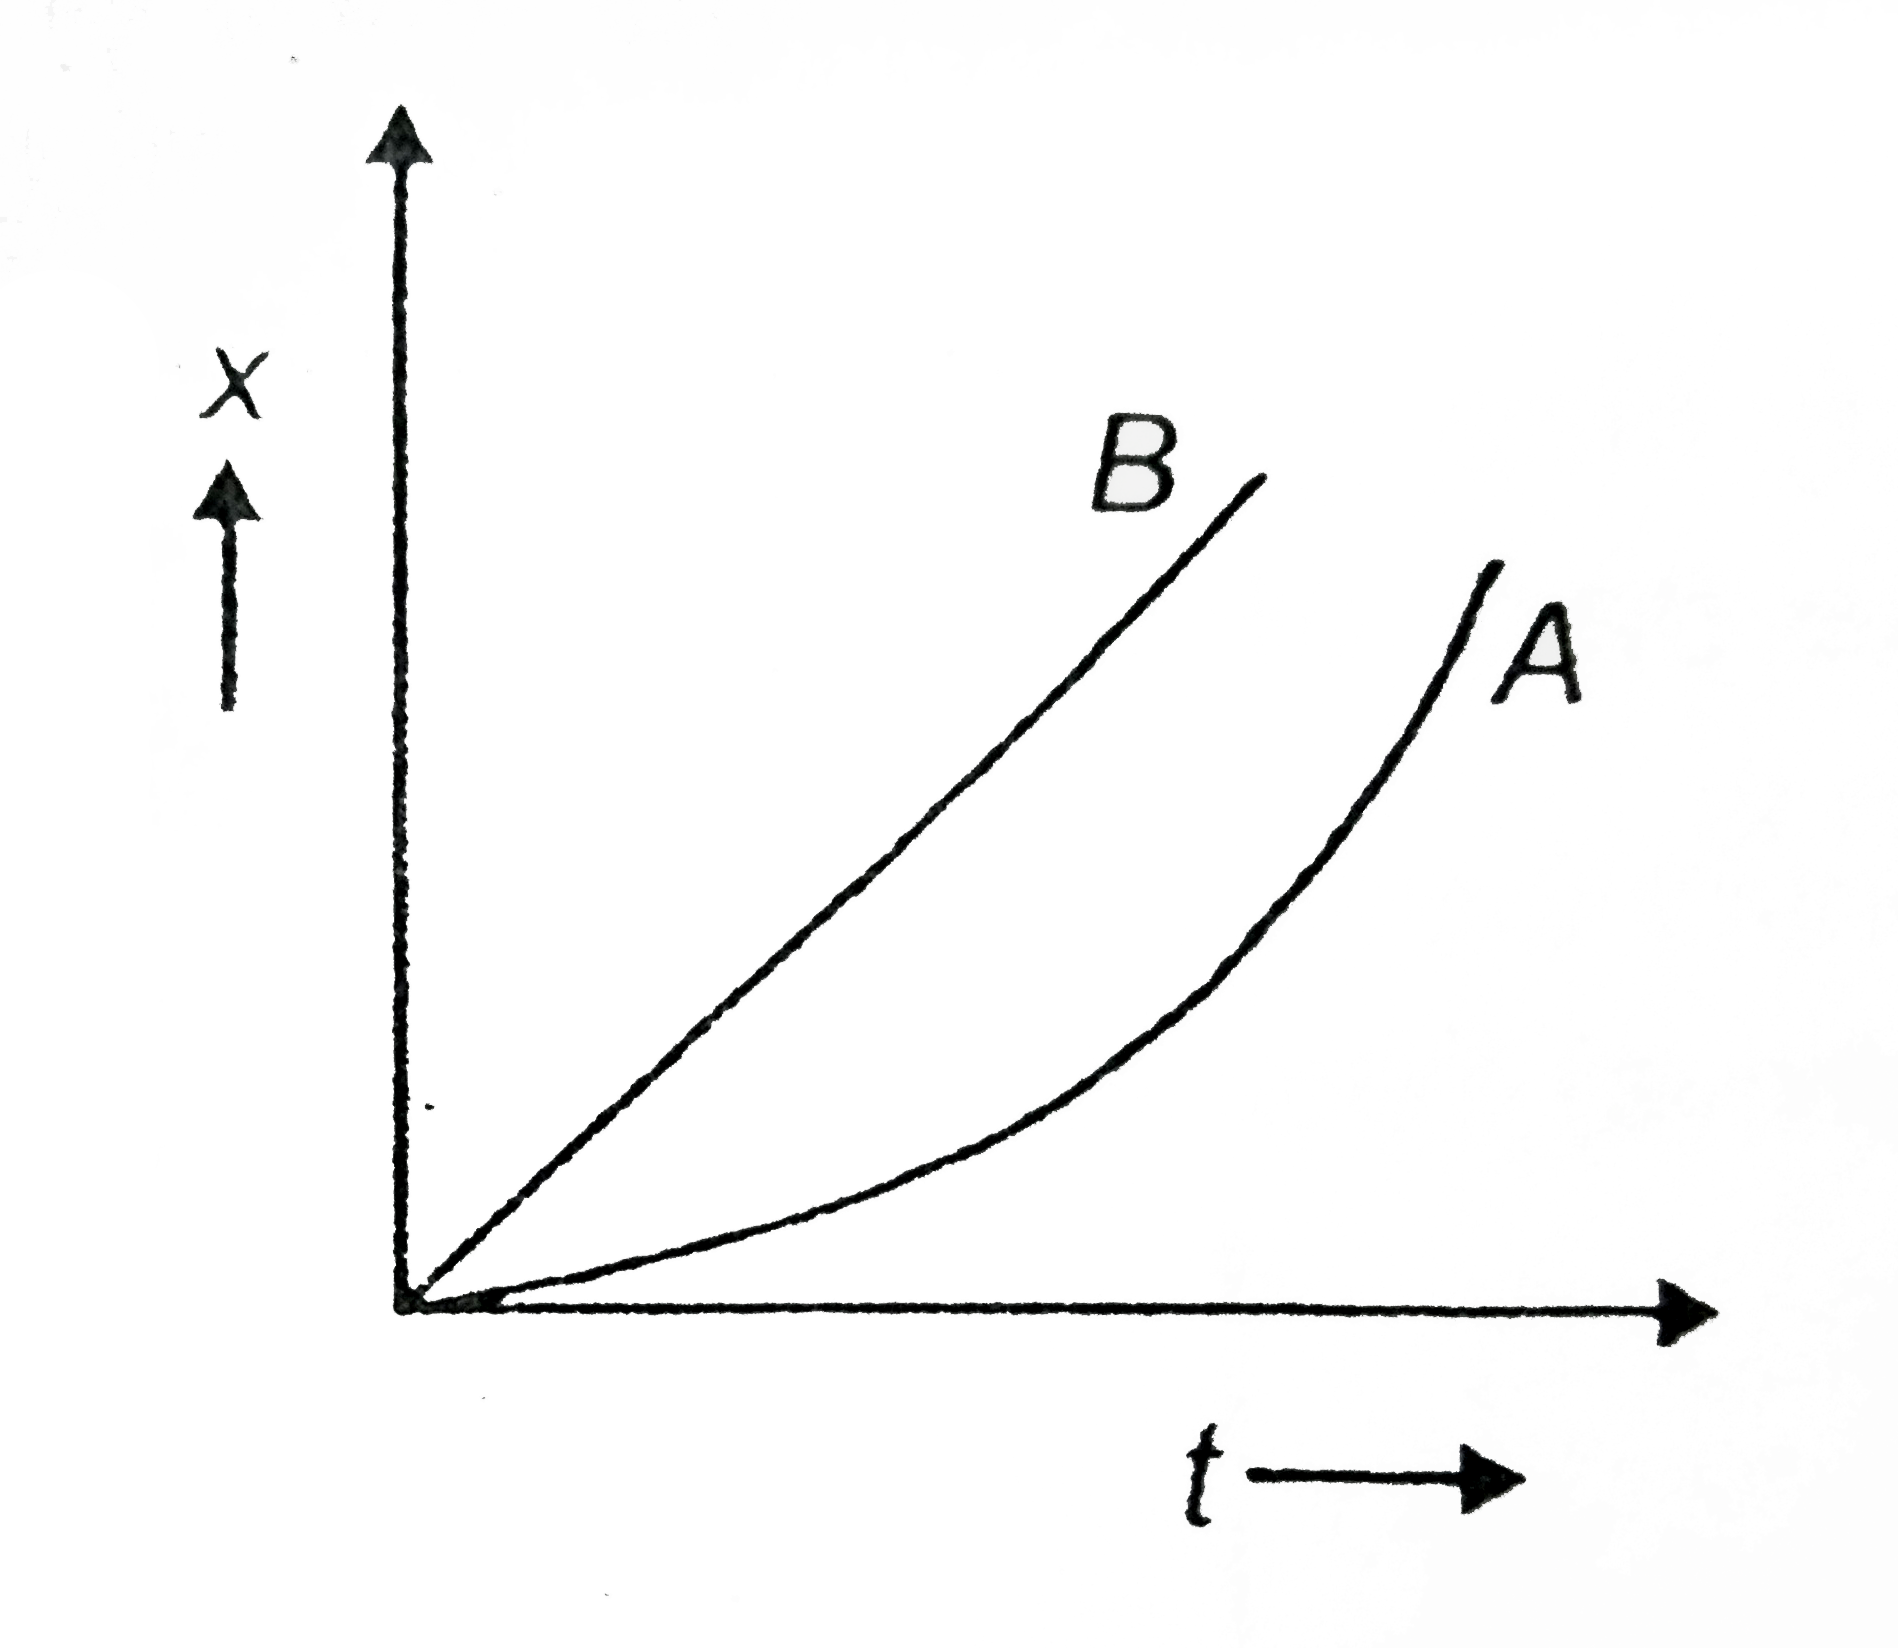
B is moving with constant velocity
A is moving with increasing speed
B is moving with non - zero constant acceleration
Acceleration of A may be constant
The correct Answer is:C
Step by step video & image solution for The displacement-time graph of two moving objects A and B are shown in the figure given below. Which of the following is incorrect? by Physics experts to help you in doubts & scoring excellent marks in Class 12 exams.
Updated on:21/07/2023Topper's Solved these Questions
- MOTION IN A STRAIGHT LINEBOOK - AAKASH INSTITUTE ENGLISHCHAPTER - MOTION IN A STRAIGHT LINEEXERCISE - ASSIGNMENT (SECTION - A)
58 Videos
- MOTION IN A STRAIGHT LINEBOOK - AAKASH INSTITUTE ENGLISHCHAPTER - MOTION IN A STRAIGHT LINEEXERCISE - ASSIGNMENT (SECTION - B)
33 Videos
- MOTION IN A STRAIGHT LINEBOOK - AAKASH INSTITUTE ENGLISHCHAPTER - MOTION IN A STRAIGHT LINEEXERCISE - TRY YOURSELF
40 Videos
- MOTION IN A PLANEBOOK - AAKASH INSTITUTE ENGLISHCHAPTER - MOTION IN A PLANEEXERCISE - Assignement section -J (Aakash Challengers Questions)
7 Videos
- MOTION IN STRAIGHT LINEBOOK - AAKASH INSTITUTE ENGLISHCHAPTER - MOTION IN STRAIGHT LINEEXERCISE - Assignment (SECTION - J)
2 Videos
Similar Questions
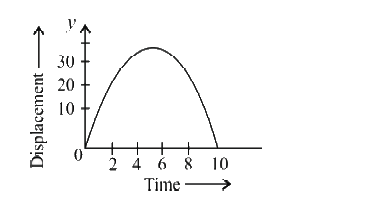
The displacement-time graph of a moving object is shown in figure. Which of the velocity-time graphs shown in figure could represent the motion of the same body ?
View Solution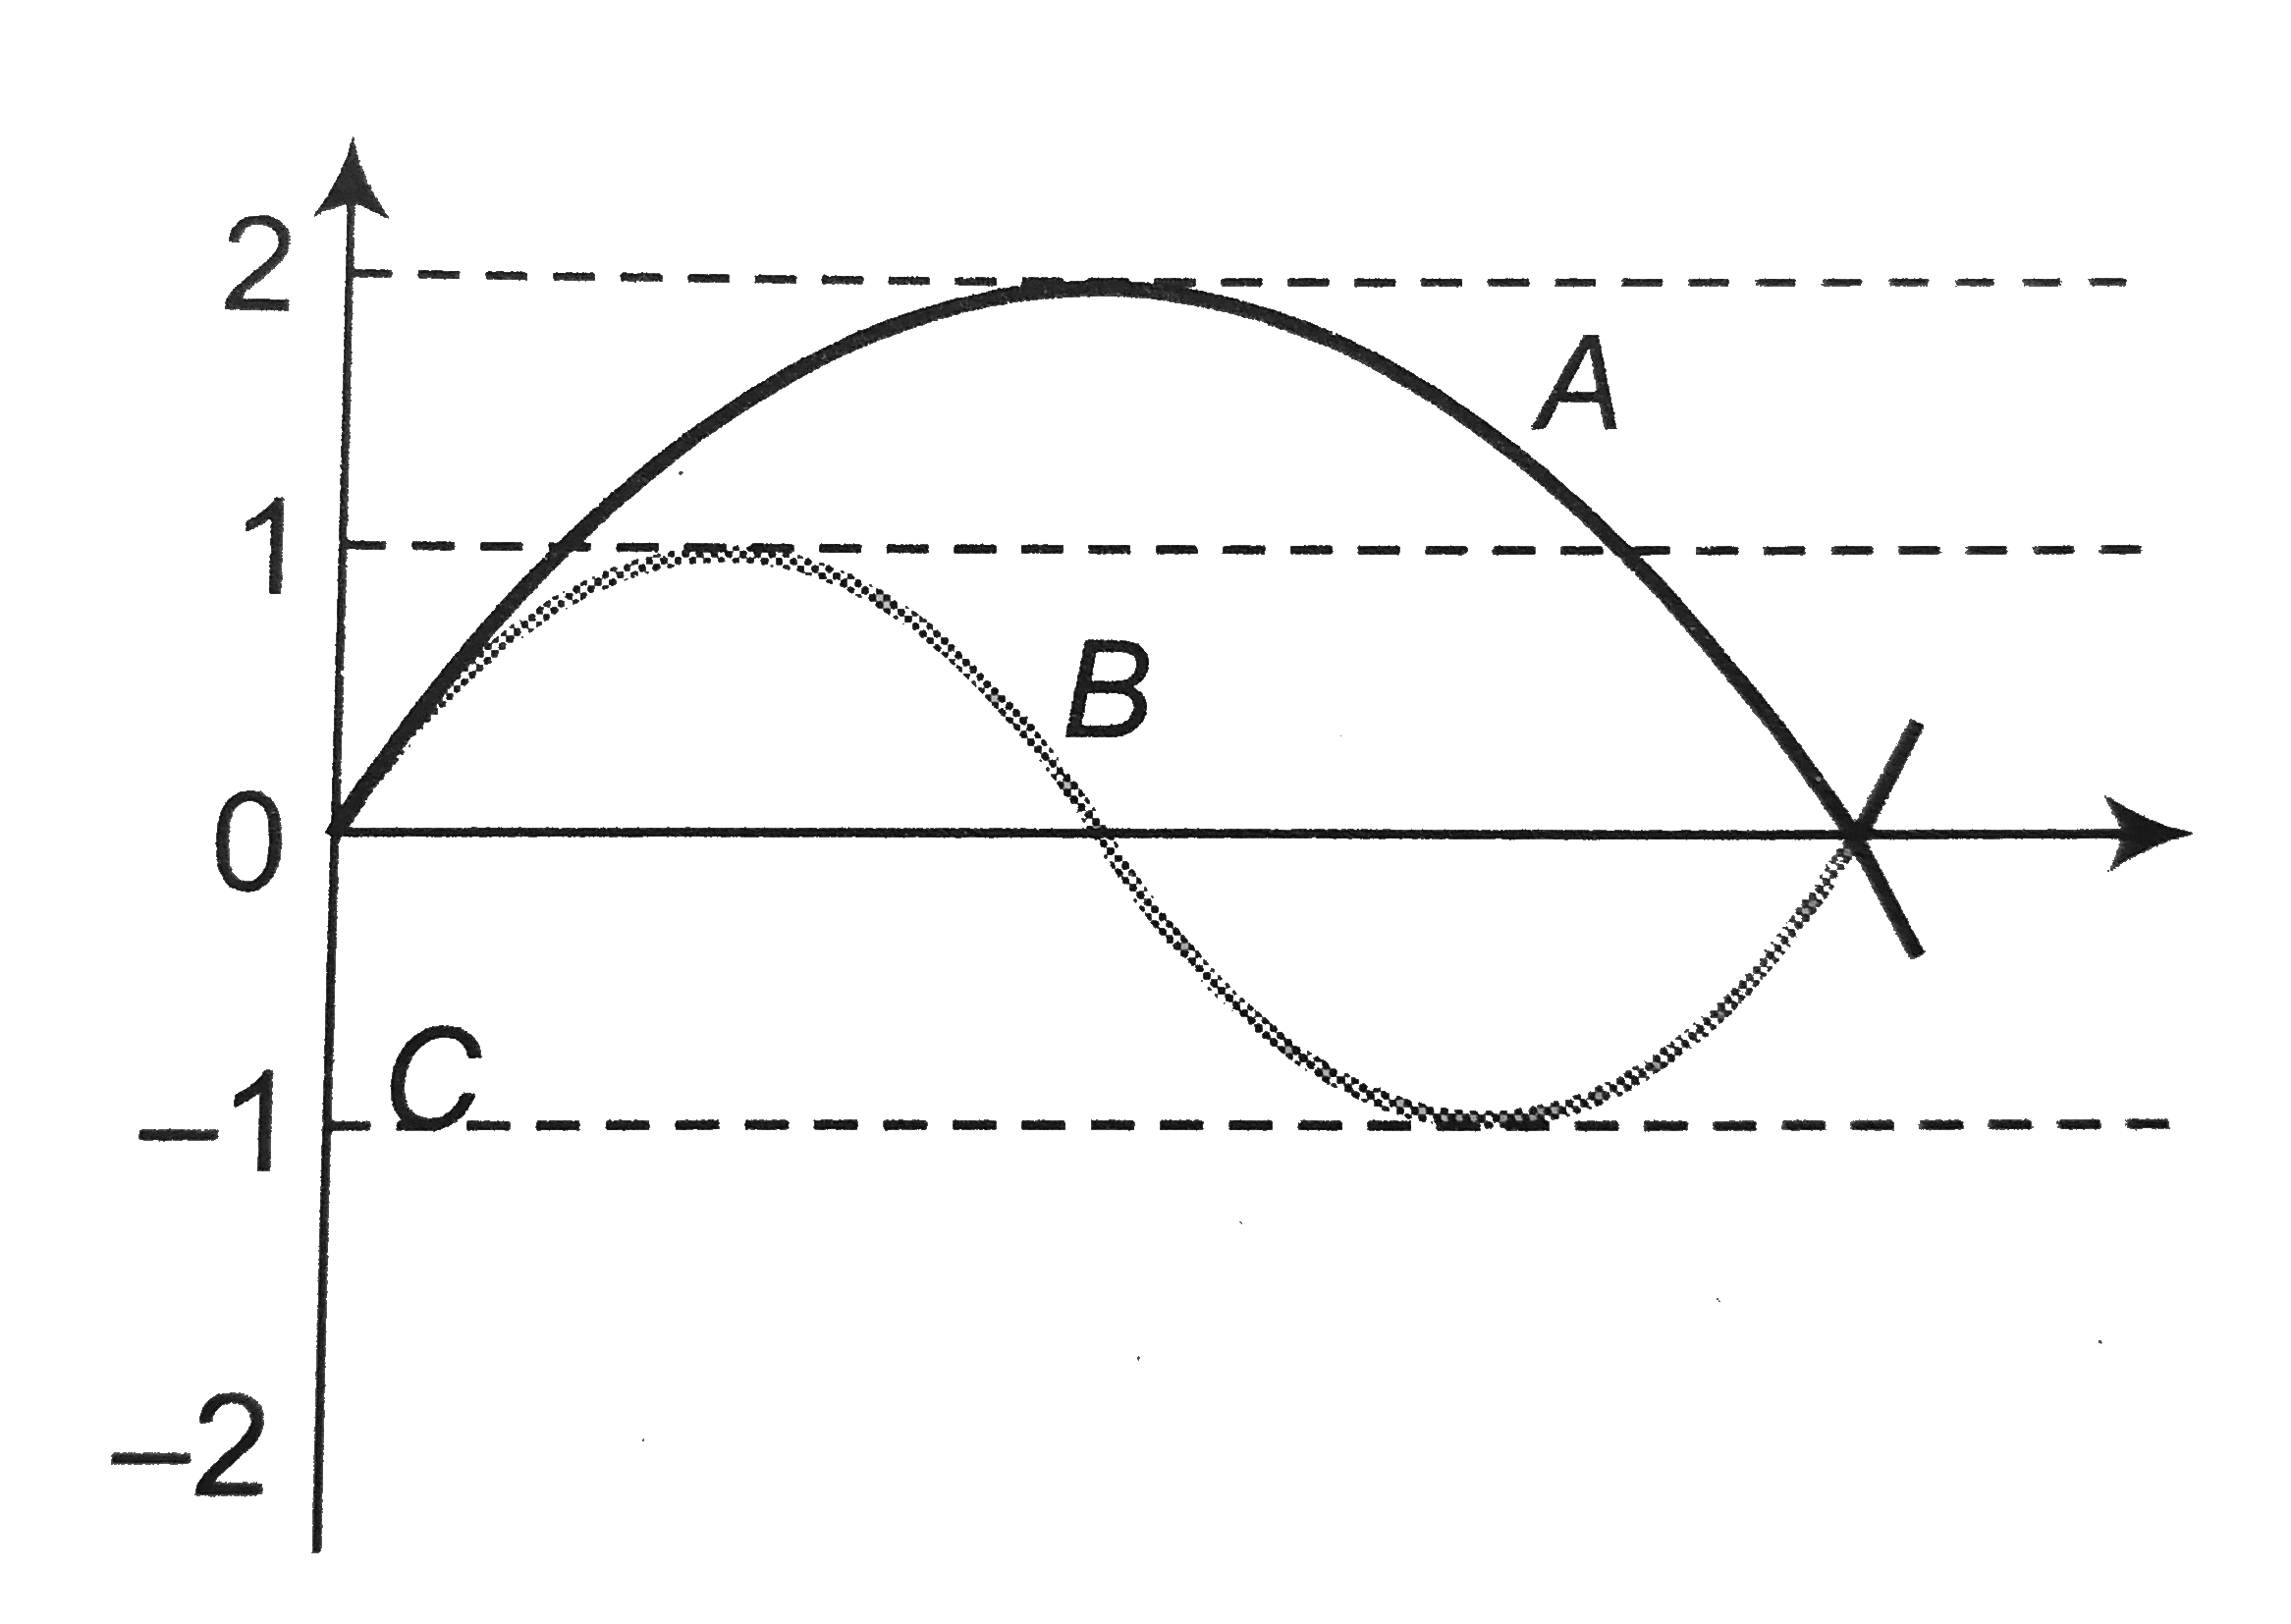
The displacement time graph for two sound waves A and B are shown in the figure. Then the ratio of their intensities IA/IB is equal to
View Solution
Knowledge Check
The velocity -displacement graph of a particle is as shown in the figure. Which of the following graphs correctly represents the variation of acceleration with displacement?
 A
A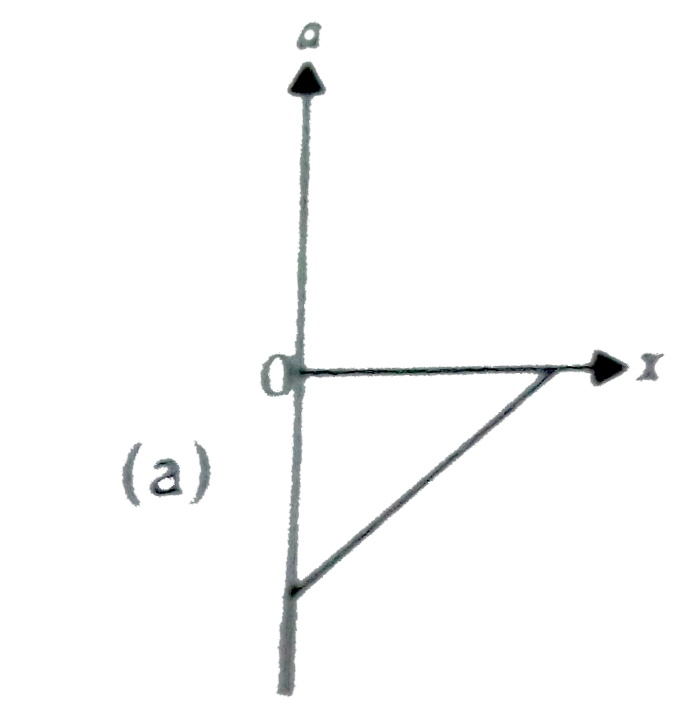 B
B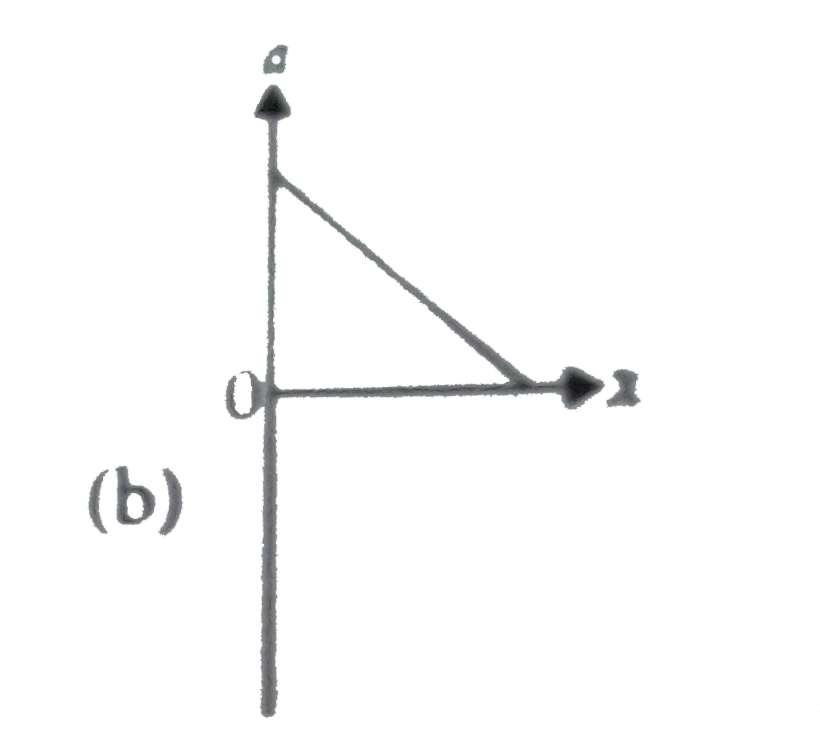 C
C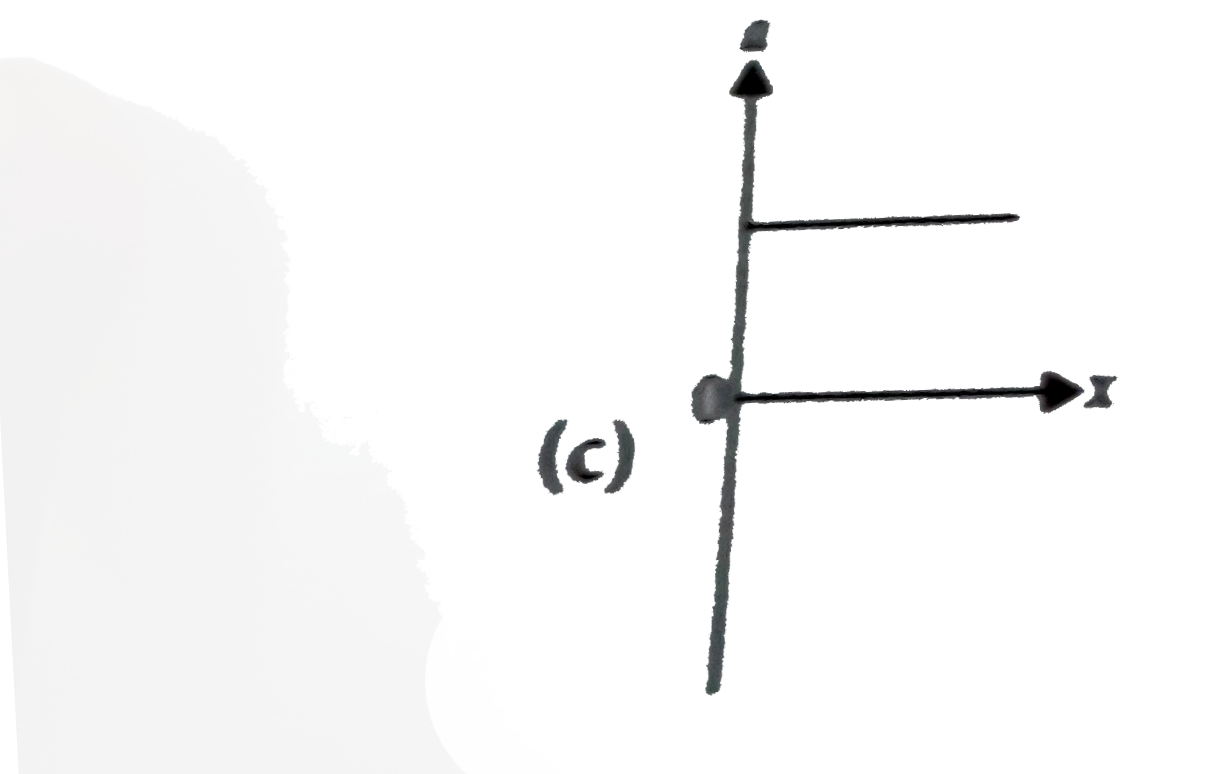 D
D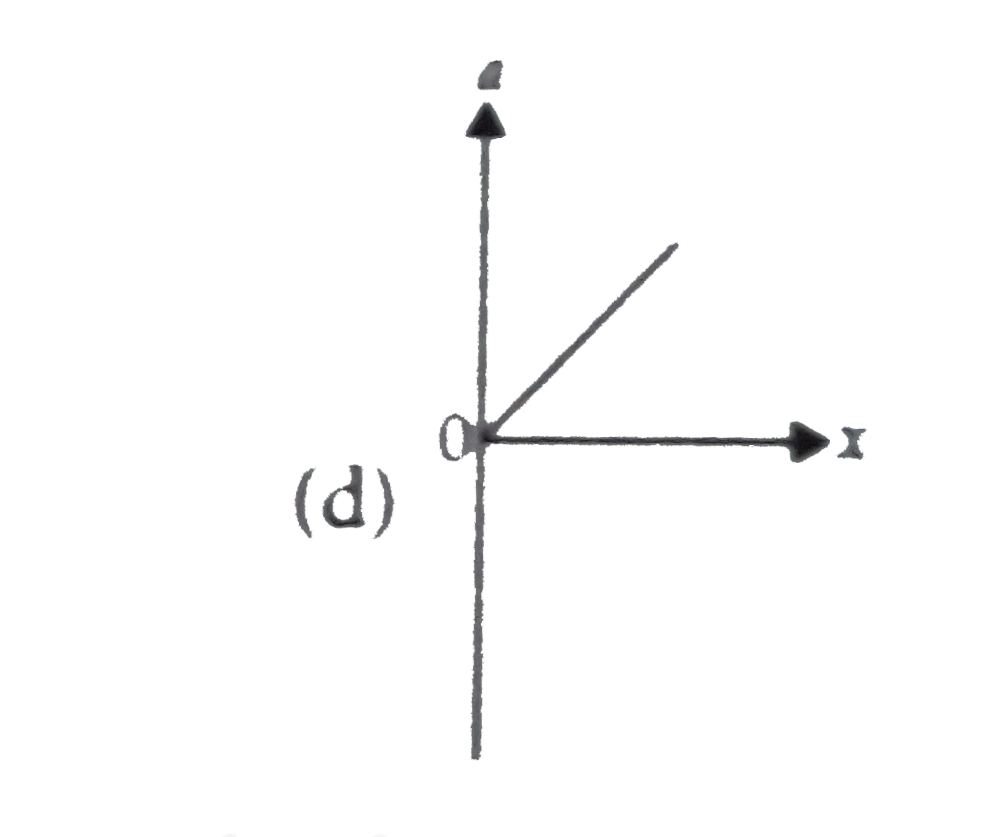

The displacement time graph for two sound waves A and B are shown in the figure. Then the ratio of their intensities IA/IB is equal to
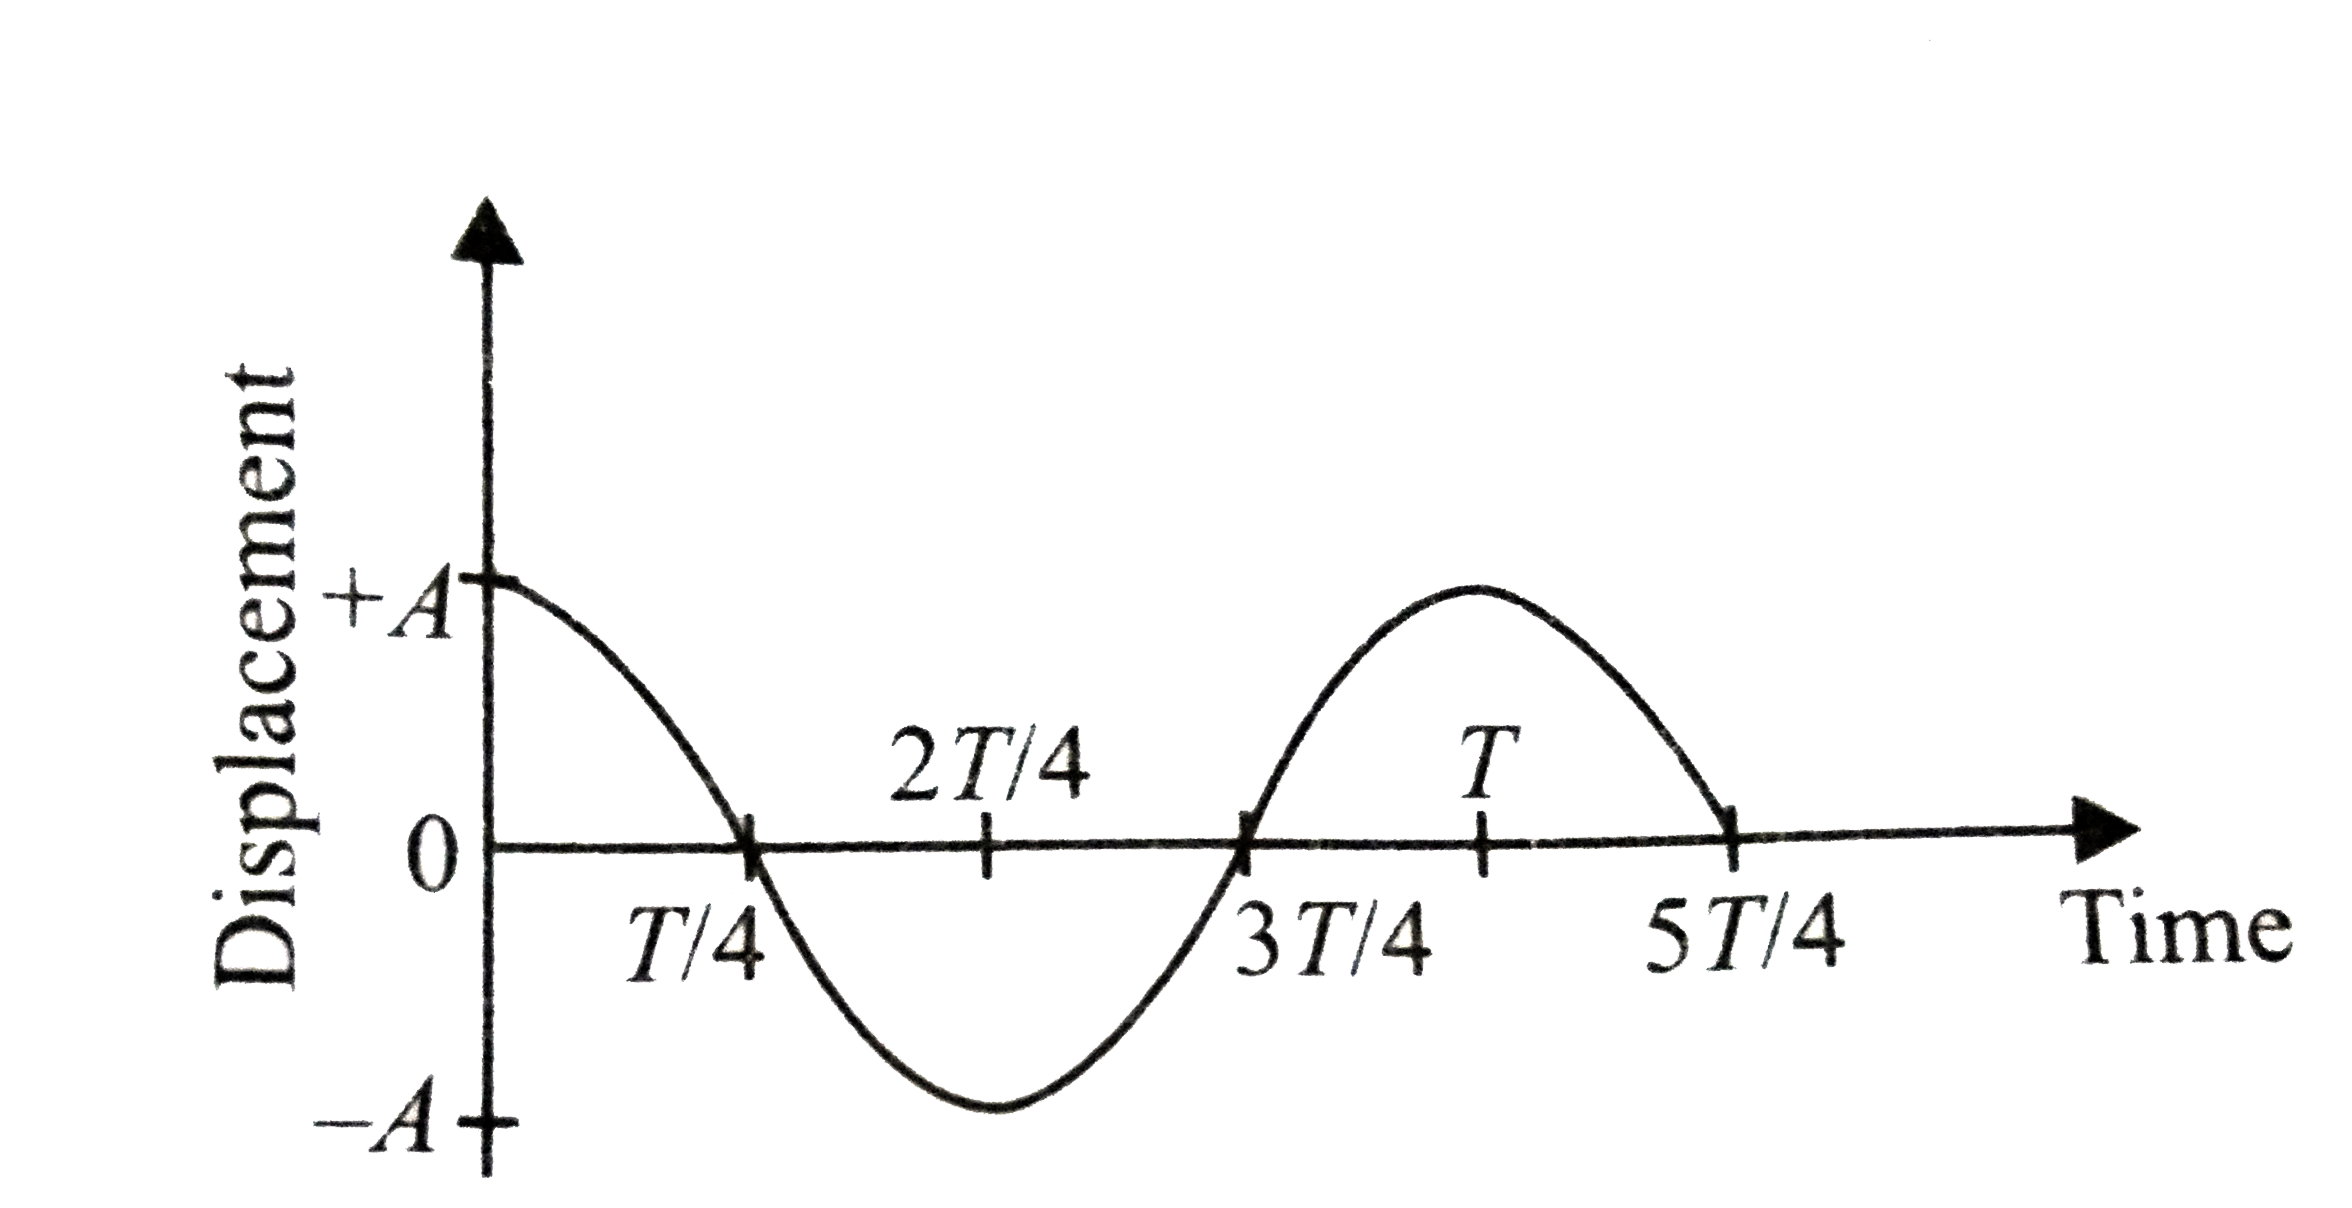
View SolutionThe displacement-time graph of a particle executing SHM is shown in figure. Which of the following statement is/are true ?
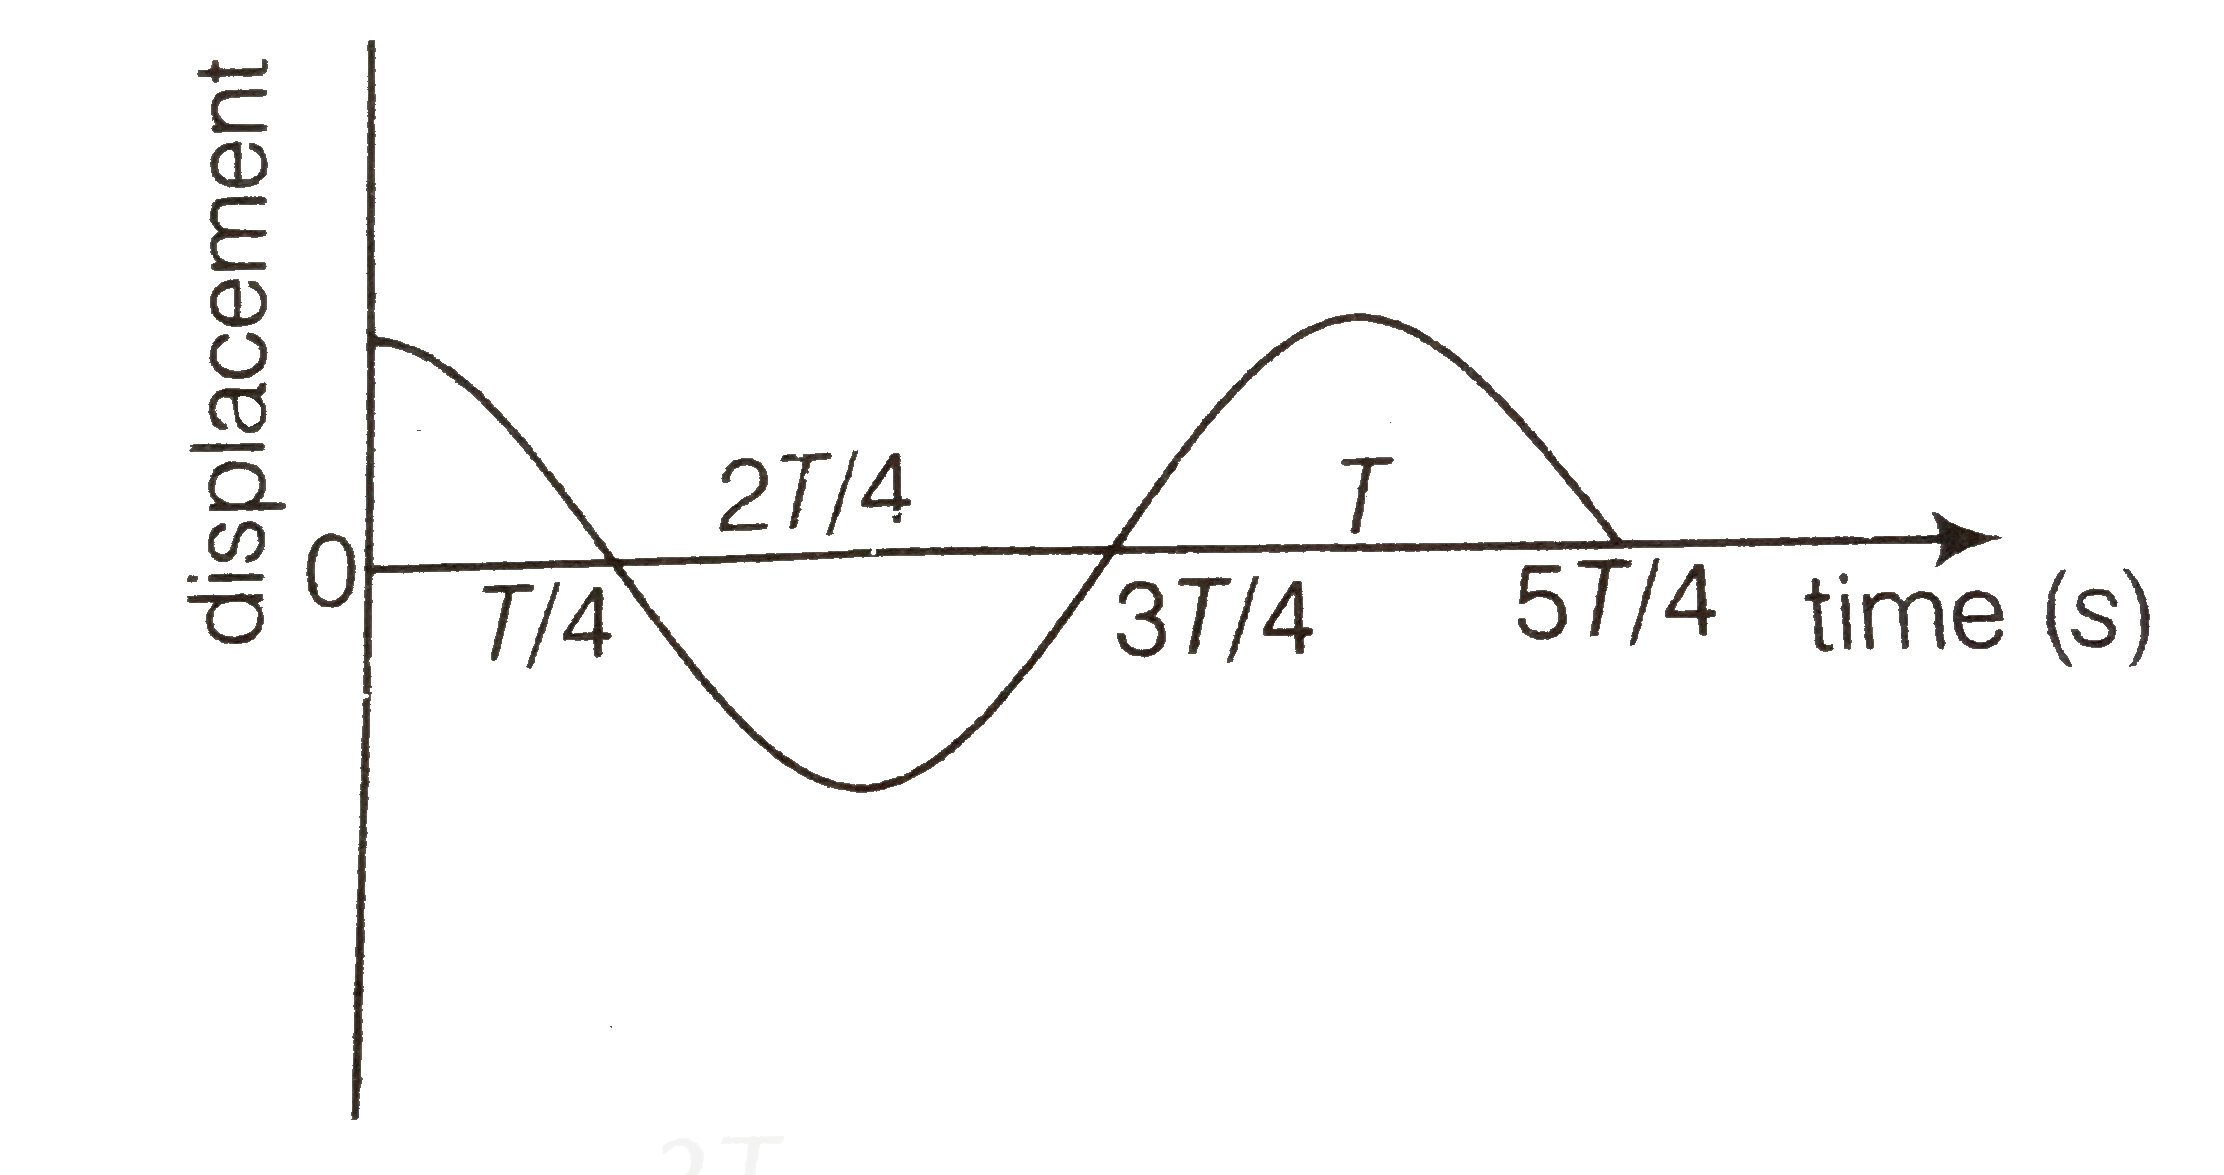
View SolutionThe displacement-time graph for a particle executing SHM is as shown in figure. Which of the following statements is correct?
View SolutionDisplacement time graph of a particle moving in a straight line is a shown in figure.

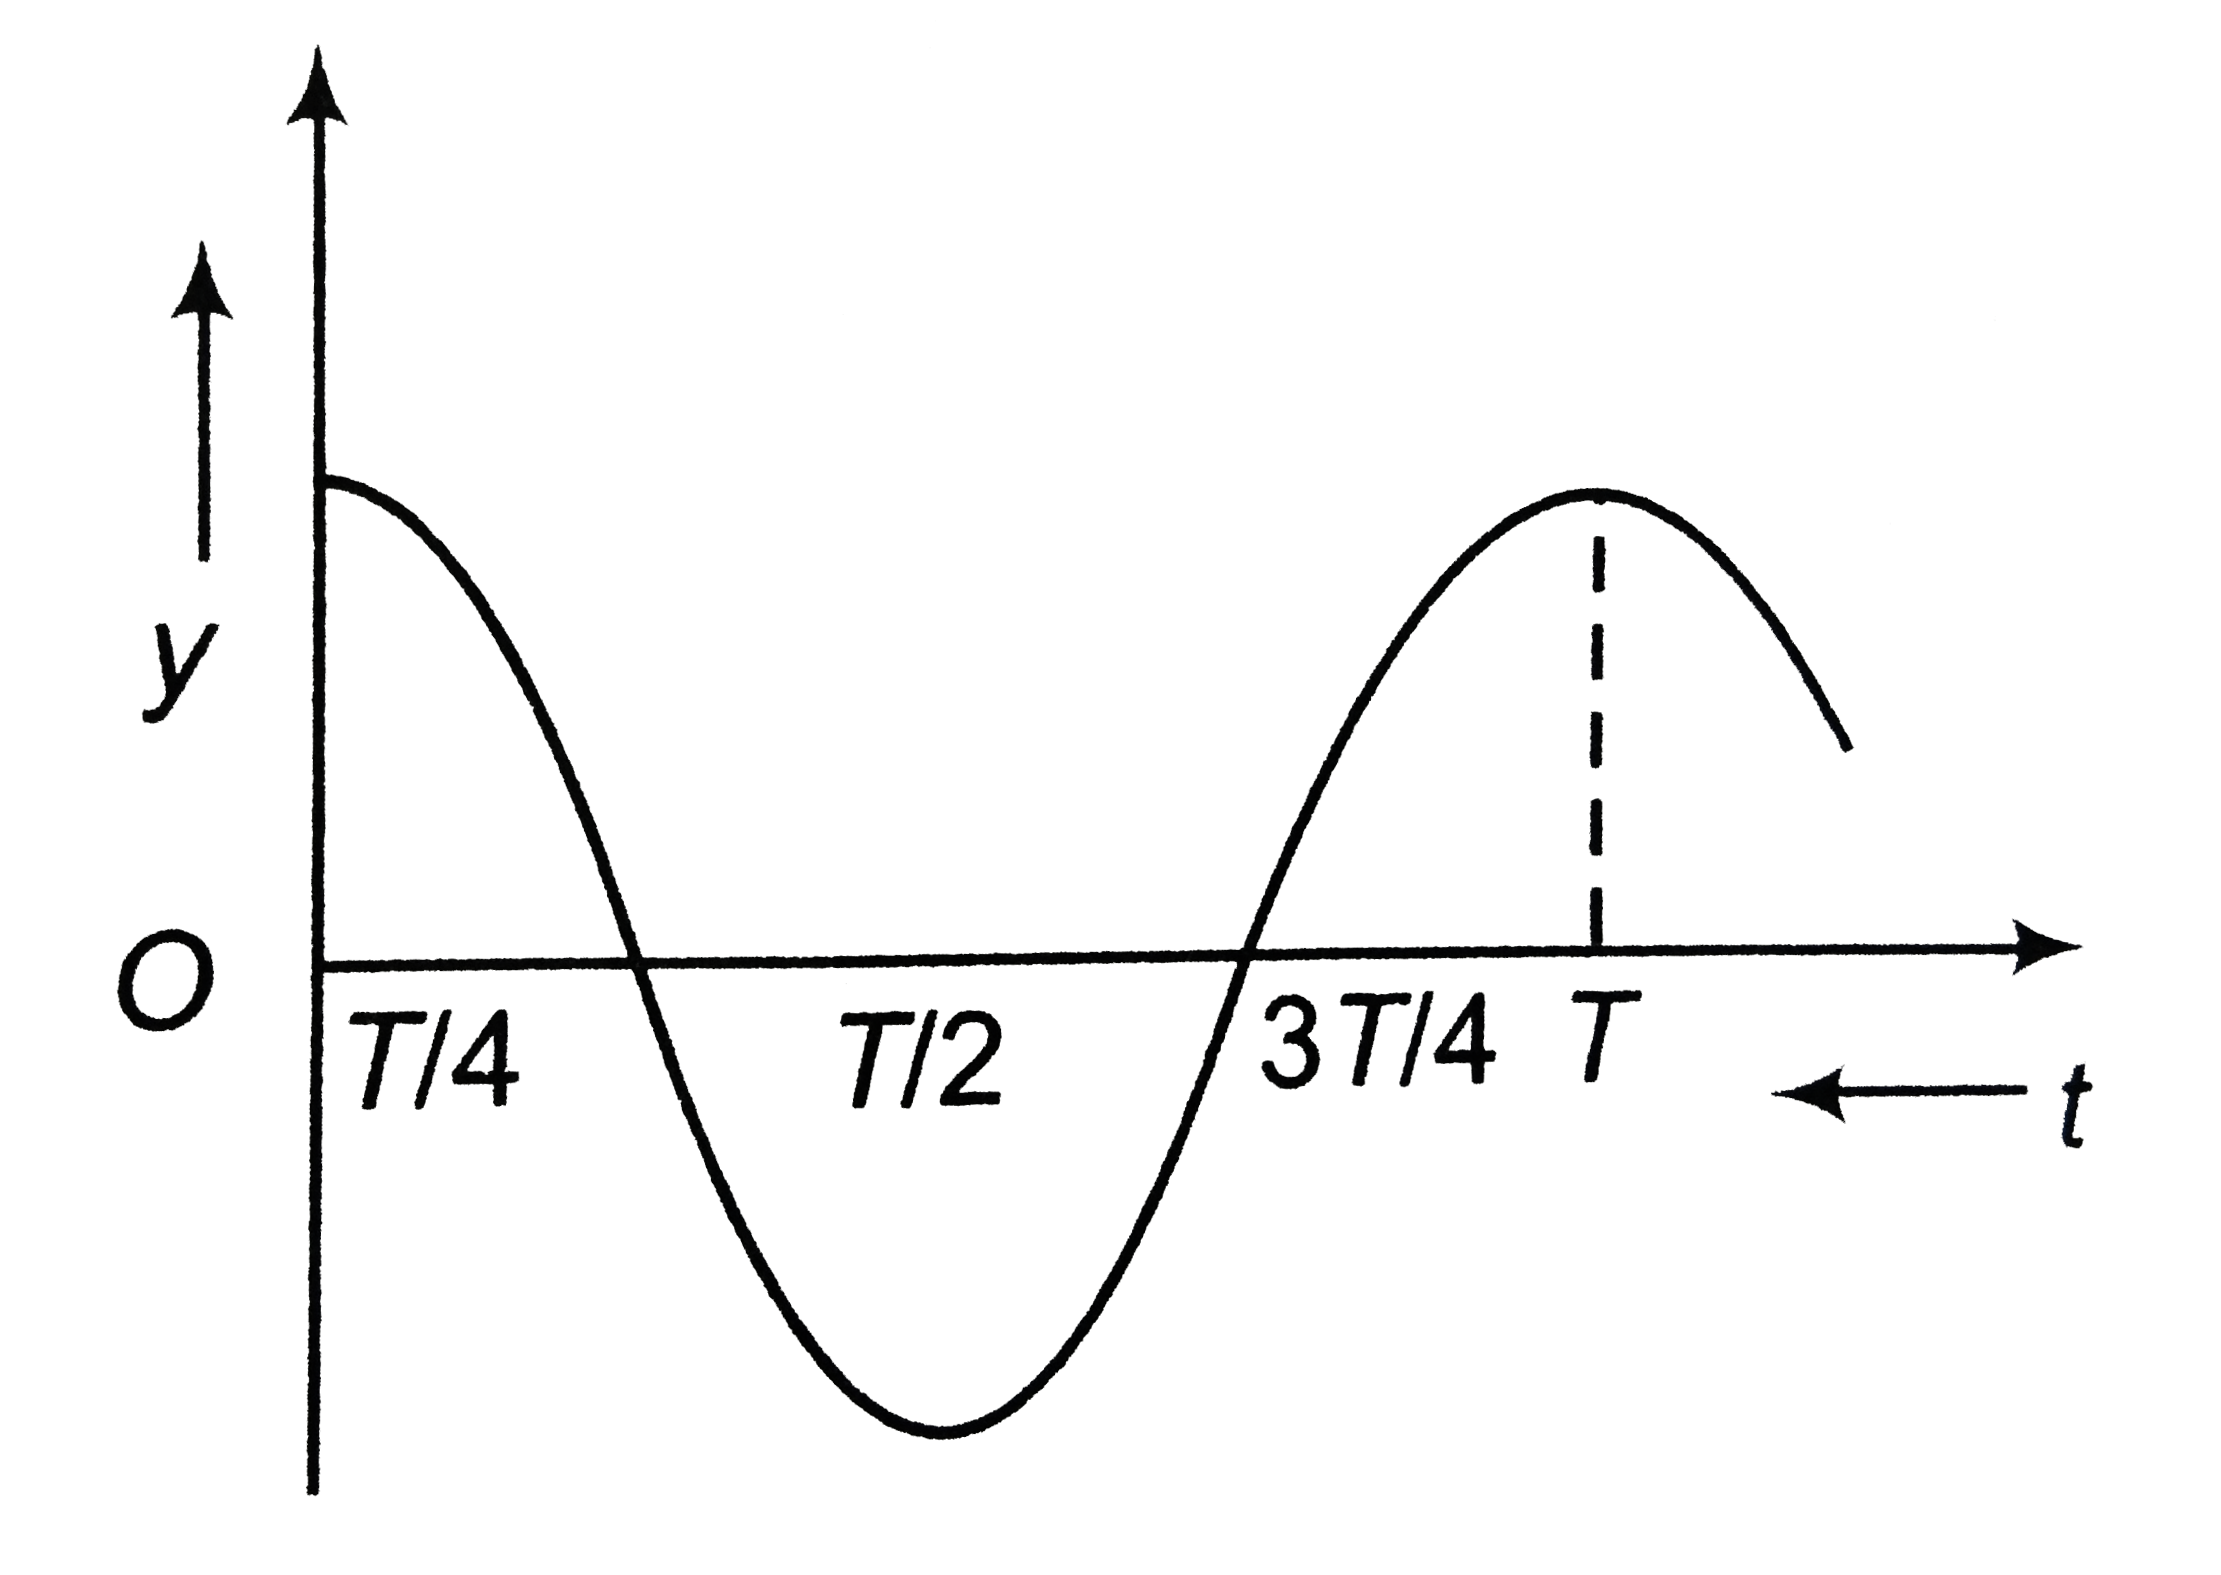
View SolutionThe displacement - time graph of a particle executing SHM is shown in figure. Which of the following statements is//are true ?
View SolutionThe displacement-time graphs of two particles P and Q are as shown in the figure. The ratio of their velocities VP and VQ will be

View SolutionThe displacement time graphs of two bodies A and B are shown in figure. The ratio of velocity of A to velocity of B,vA/vB is:
View Solution
