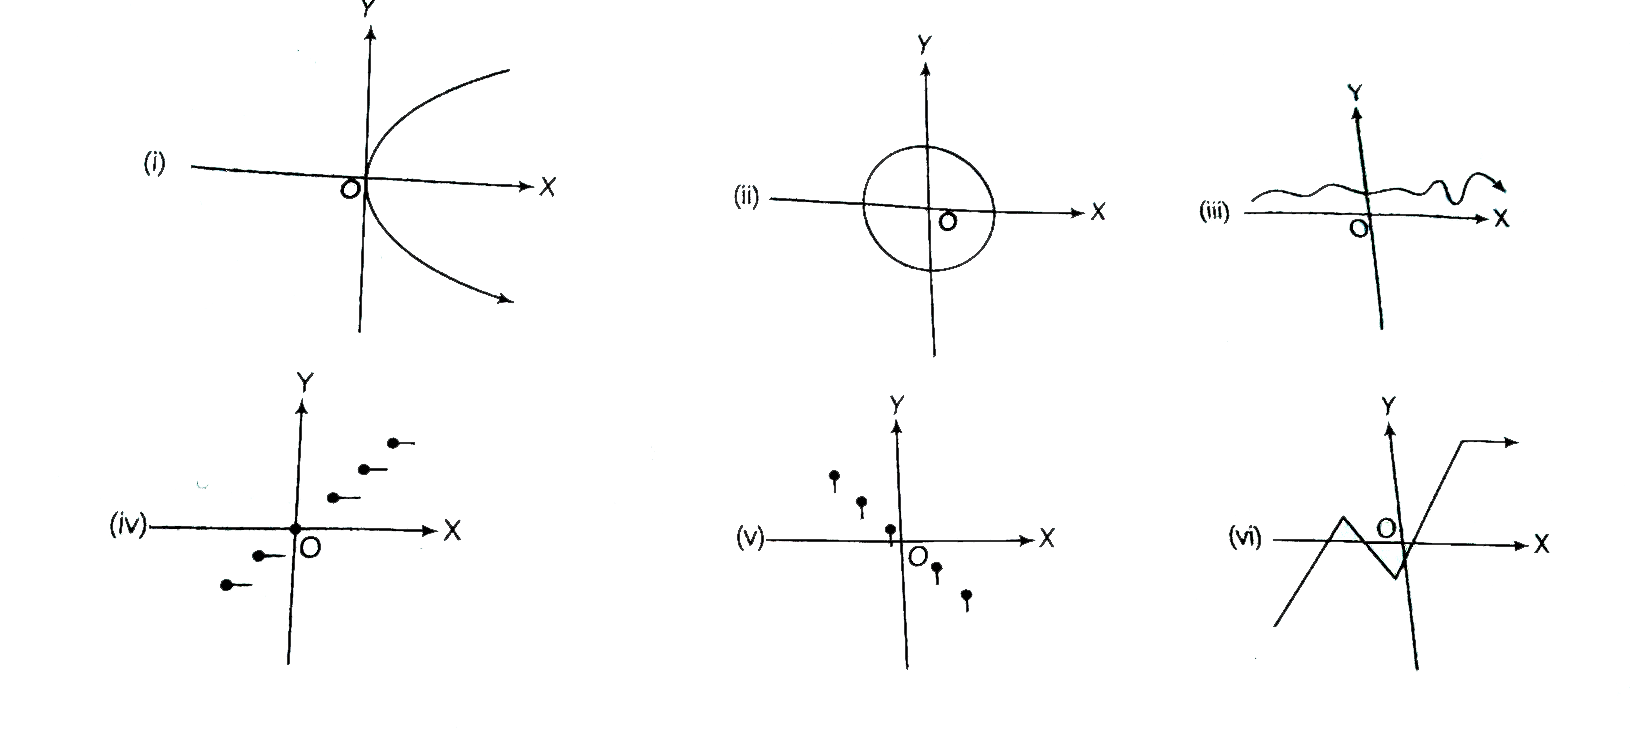
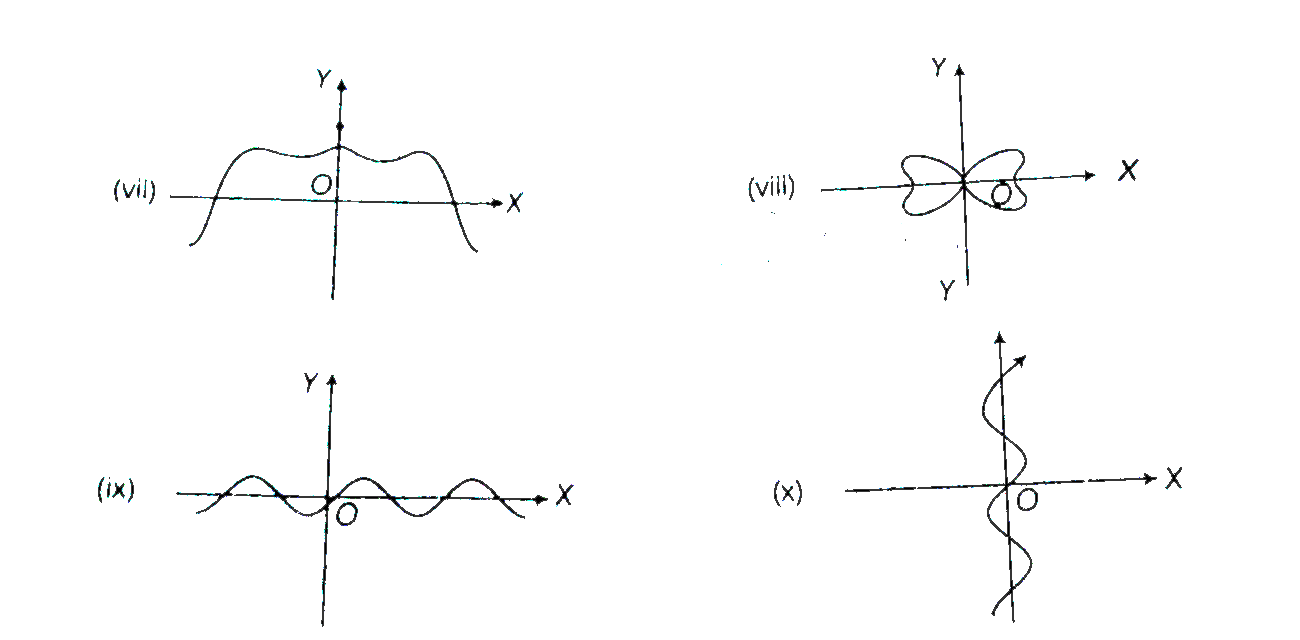
In which of the following graphs, the total change in momentum is zero ?
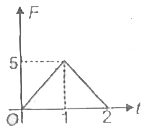
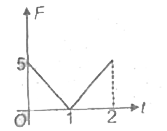
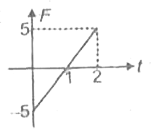
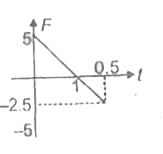
To determine in which of the given graphs the total change in momentum is zero, we will analyze the area under each force vs. time graph. The change in momentum (ΔP) is given by the integral of force (F) with respect to time (t), which is equal to the area under the force-time graph. If the total area is zero when considered algebraically (taking into account both positive and negative areas), then the change in momentum is also zero.
1. Understand the Relationship:
The change in momentum is given by the integral of force with respect to time:
ΔP=∫Fdt
This integral can be interpreted as the area under the force-time graph.
2. Identify the Graphs:
We are given multiple graphs (let's denote them as A, B, C, D) that represent force as a function of time.
3. Calculate Area for Each Graph:
- Graph A:
- The graph is above the time axis.
- Area = 12×base×height=12×2×5=5 square units (positive area).
- Graph B:
- The graph is also above the time axis and symmetric.
- Area = 12×1×5+12×1×5=5 square units (positive area).
- Graph C:
- This graph has both positive and negative areas.
- Positive area = 12×1×5=2.5 square units.
- Negative area = −12×1×5=−2.5 square units.
- Total area = 2.5−2.5=0 square units (net area is zero).
- Graph D:
- This graph has a positive area and a smaller negative area.
- Positive area = 12×1×5=2.5 square units.
- Negative area = −12×0.5×2.5=−0.625 square units.
- Total area = 2.5−0.625=1.875 square units (not zero).
4. Conclusion:
The only graph where the total area (and thus the change in momentum) is zero is Graph C.
Final Answer:
The correct option is C.
The change in momentum is given by the integral of force with respect to time:
ΔP=∫Fdt
This integral can be interpreted as the area under the force-time graph.
We are given multiple graphs (let's denote them as A, B, C, D) that represent force as a function of time.
- Graph A:
- The graph is above the time axis.
- Area = 12×base×height=12×2×5=5 square units (positive area).
- Graph B:
- The graph is also above the time axis and symmetric.
- Area = 12×1×5+12×1×5=5 square units (positive area).
- Graph C:
- This graph has both positive and negative areas.
- Positive area = 12×1×5=2.5 square units.
- Negative area = −12×1×5=−2.5 square units.
- Total area = 2.5−2.5=0 square units (net area is zero).
- Graph D:
- This graph has a positive area and a smaller negative area.
- Positive area = 12×1×5=2.5 square units.
- Negative area = −12×0.5×2.5=−0.625 square units.
- Total area = 2.5−0.625=1.875 square units (not zero).
The only graph where the total area (and thus the change in momentum) is zero is Graph C.
The correct option is C.
Topper's Solved these Questions
- LAWS OF MOTIONBOOK - AAKASH INSTITUTE ENGLISHCHAPTER - LAWS OF MOTIONEXERCISE - Assignment (SECTION-B)
44 Videos
- LAWS OF MOTIONBOOK - AAKASH INSTITUTE ENGLISHCHAPTER - LAWS OF MOTIONEXERCISE - Assignment (SECTION-C)
63 Videos
- LAWS OF MOTIONBOOK - AAKASH INSTITUTE ENGLISHCHAPTER - LAWS OF MOTIONEXERCISE - EXERCISE
69 Videos
- KINETIC THEORYBOOK - AAKASH INSTITUTE ENGLISHCHAPTER - KINETIC THEORYEXERCISE - EXERCISE (ASSIGNMENT) SECTION - D Assertion - Reason Type Questions
10 Videos
- MAGNETISM AND MATTER BOOK - AAKASH INSTITUTE ENGLISHCHAPTER - MAGNETISM AND MATTER EXERCISE - ASSIGNMENT (SECTION D)
26 Videos
Similar Questions
Knowledge Check
Which of the following graphs shows the relative change in the amount of mitochondrial DNA of a cell undergoing mitosis?
A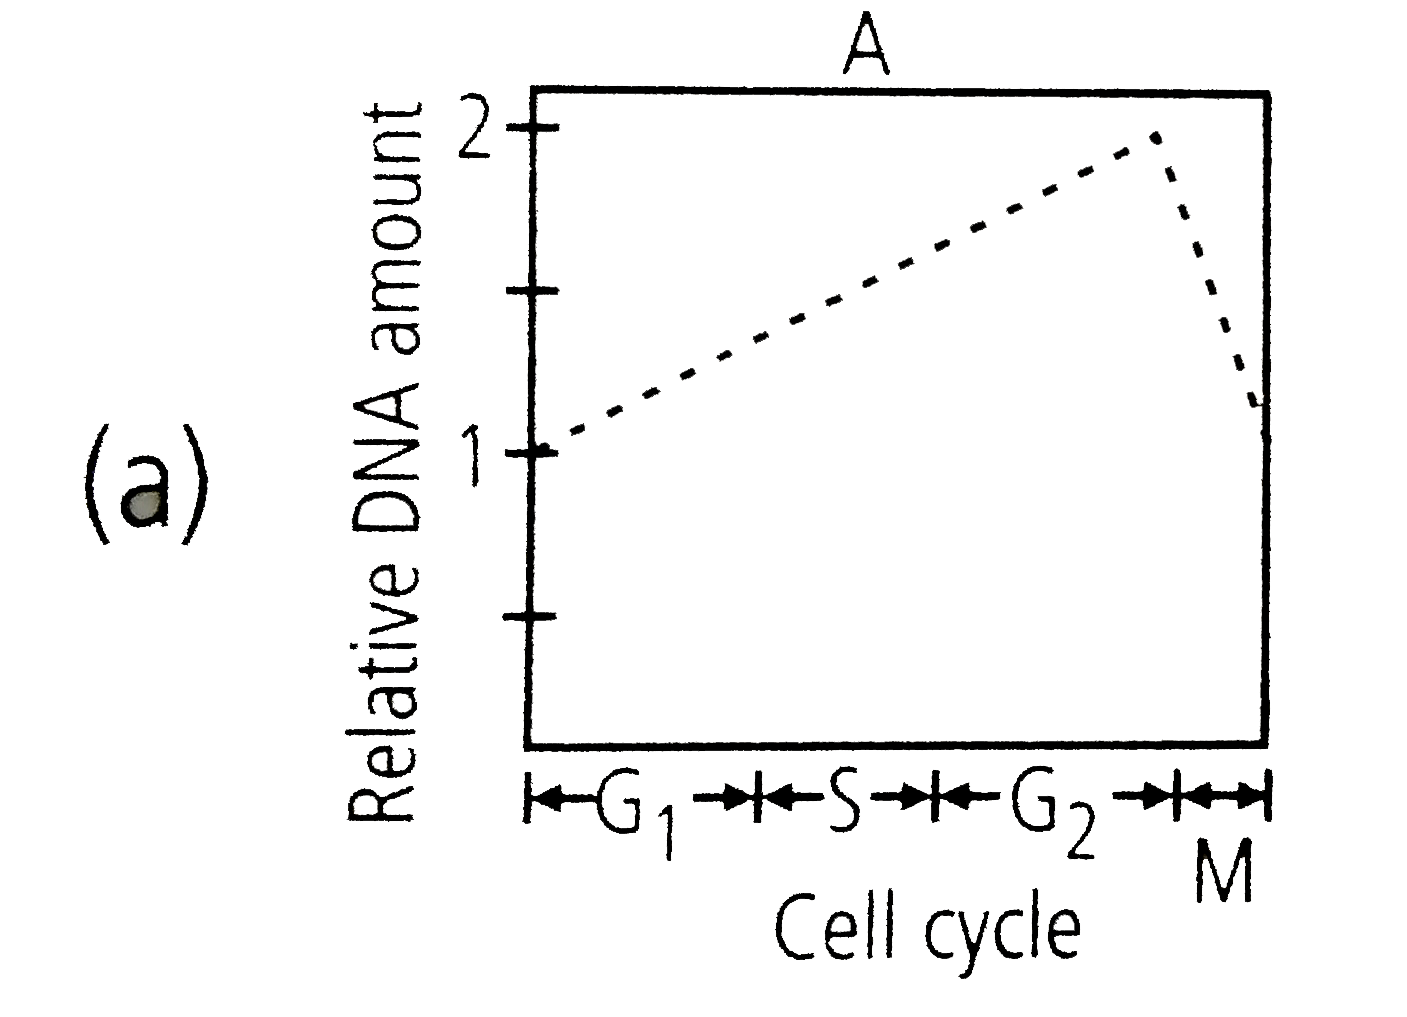 B
B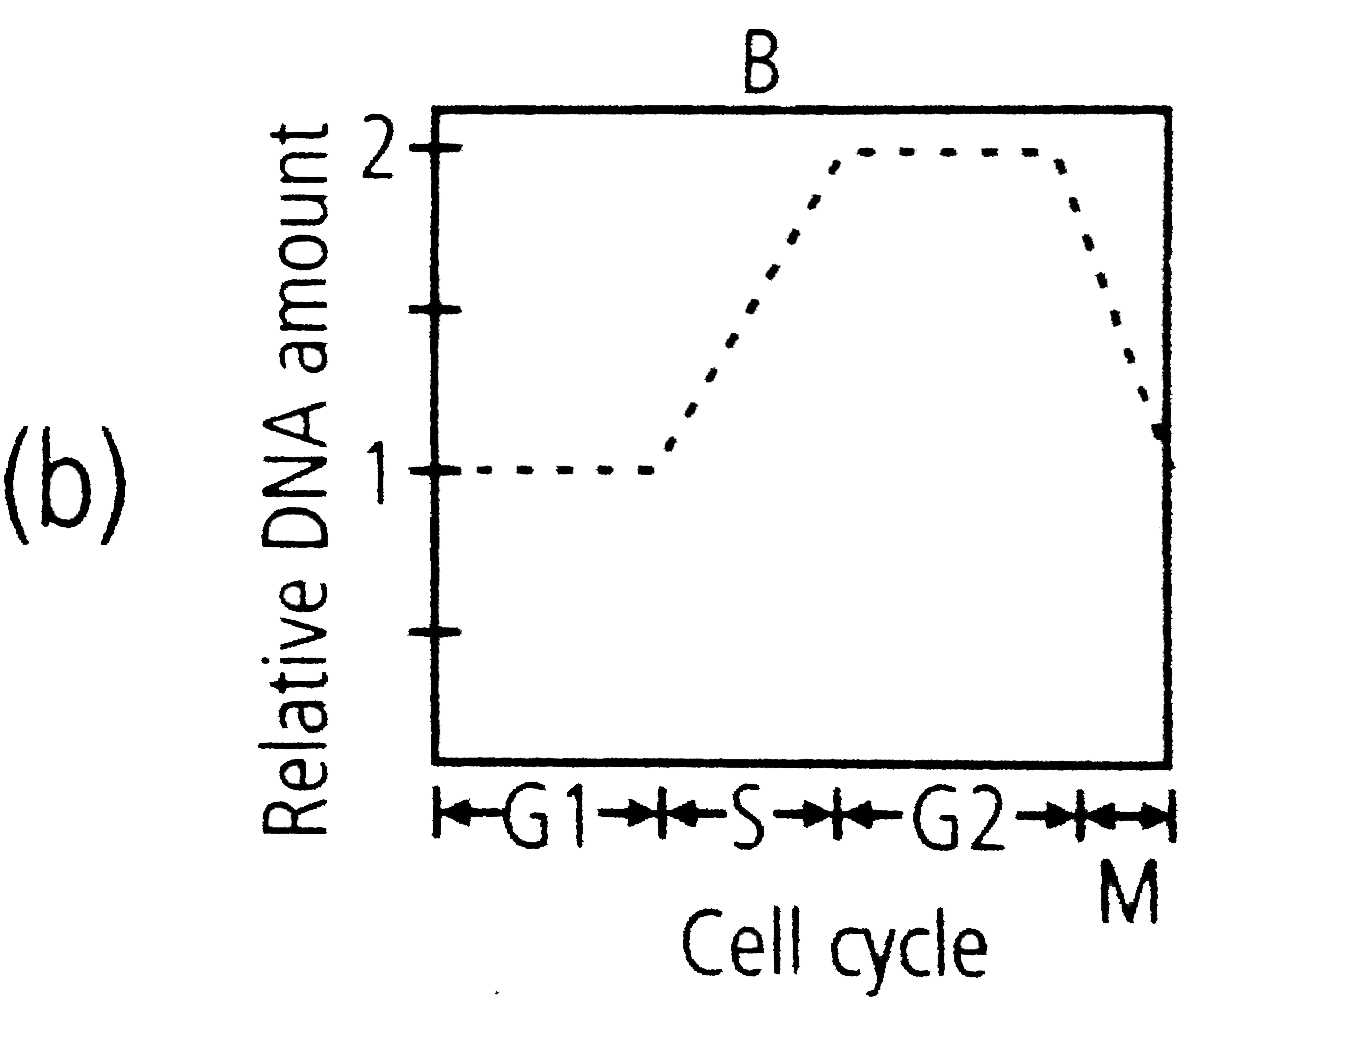 C
C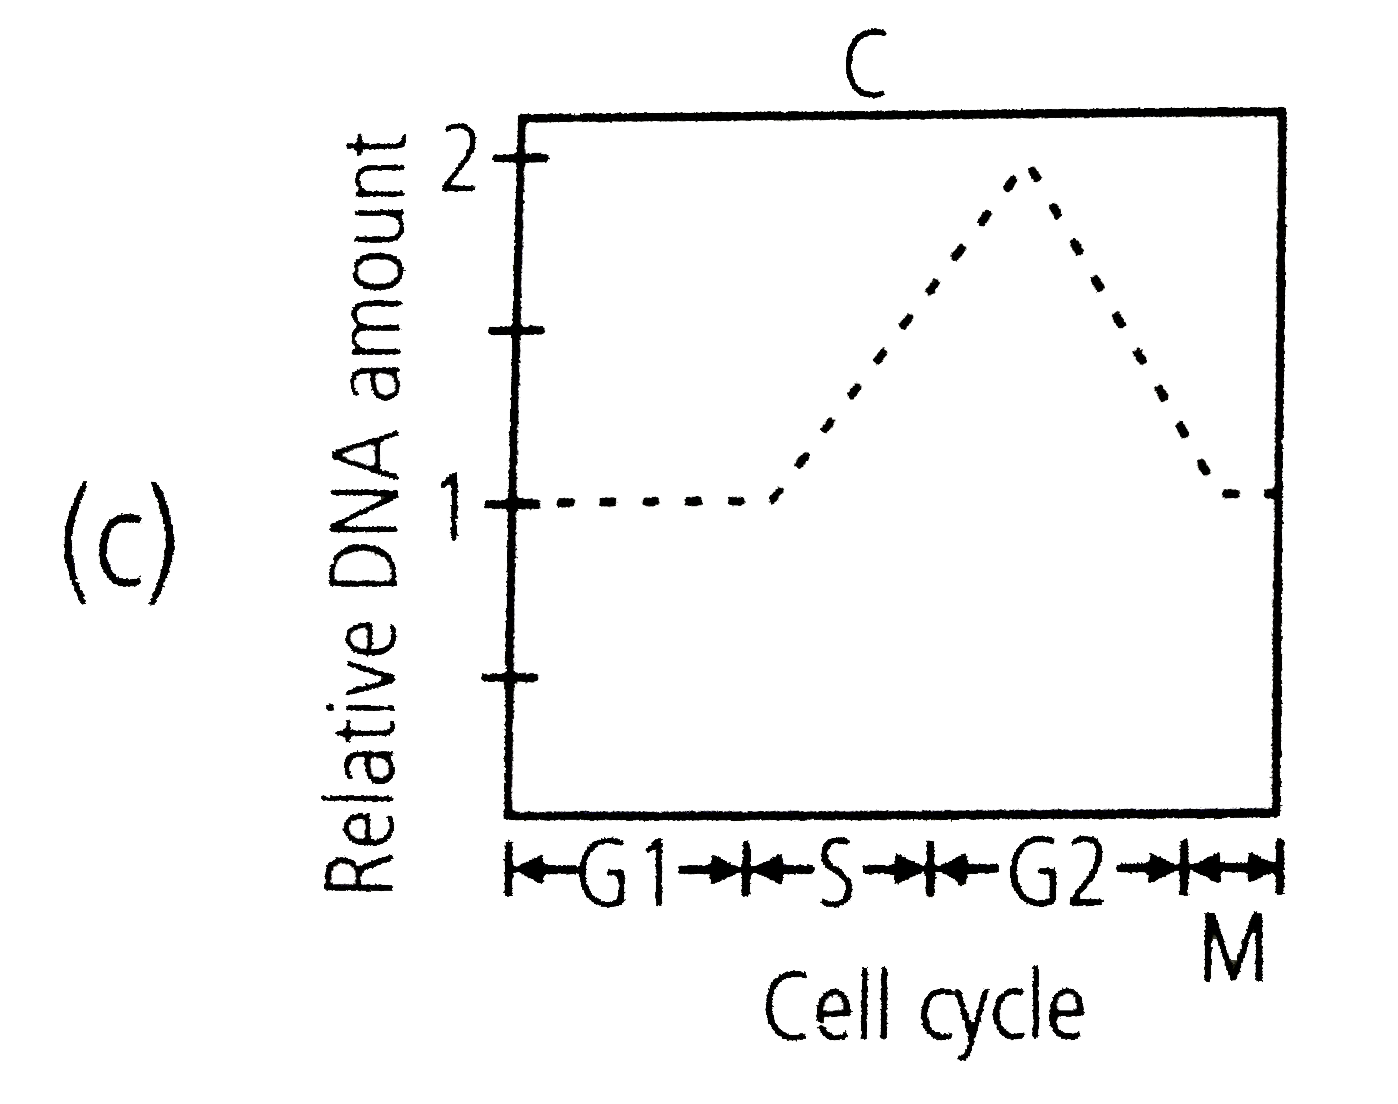 D
D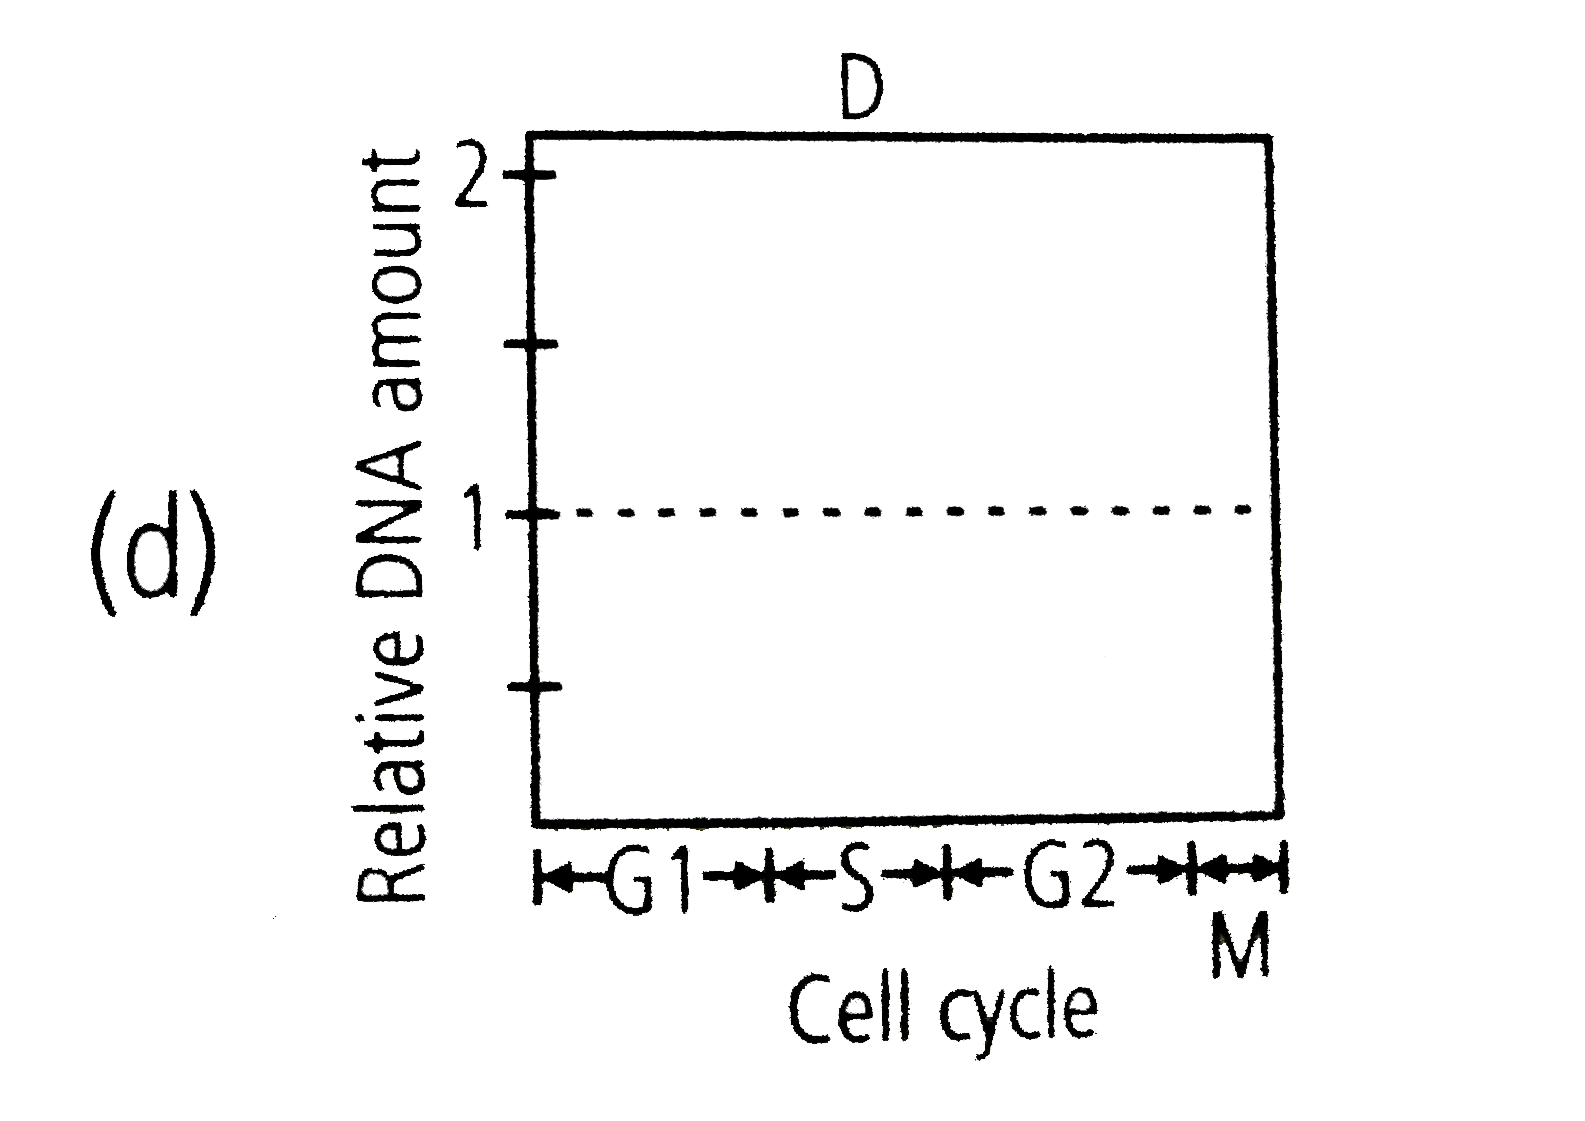
Which of the following graphs is NOT a function ?
A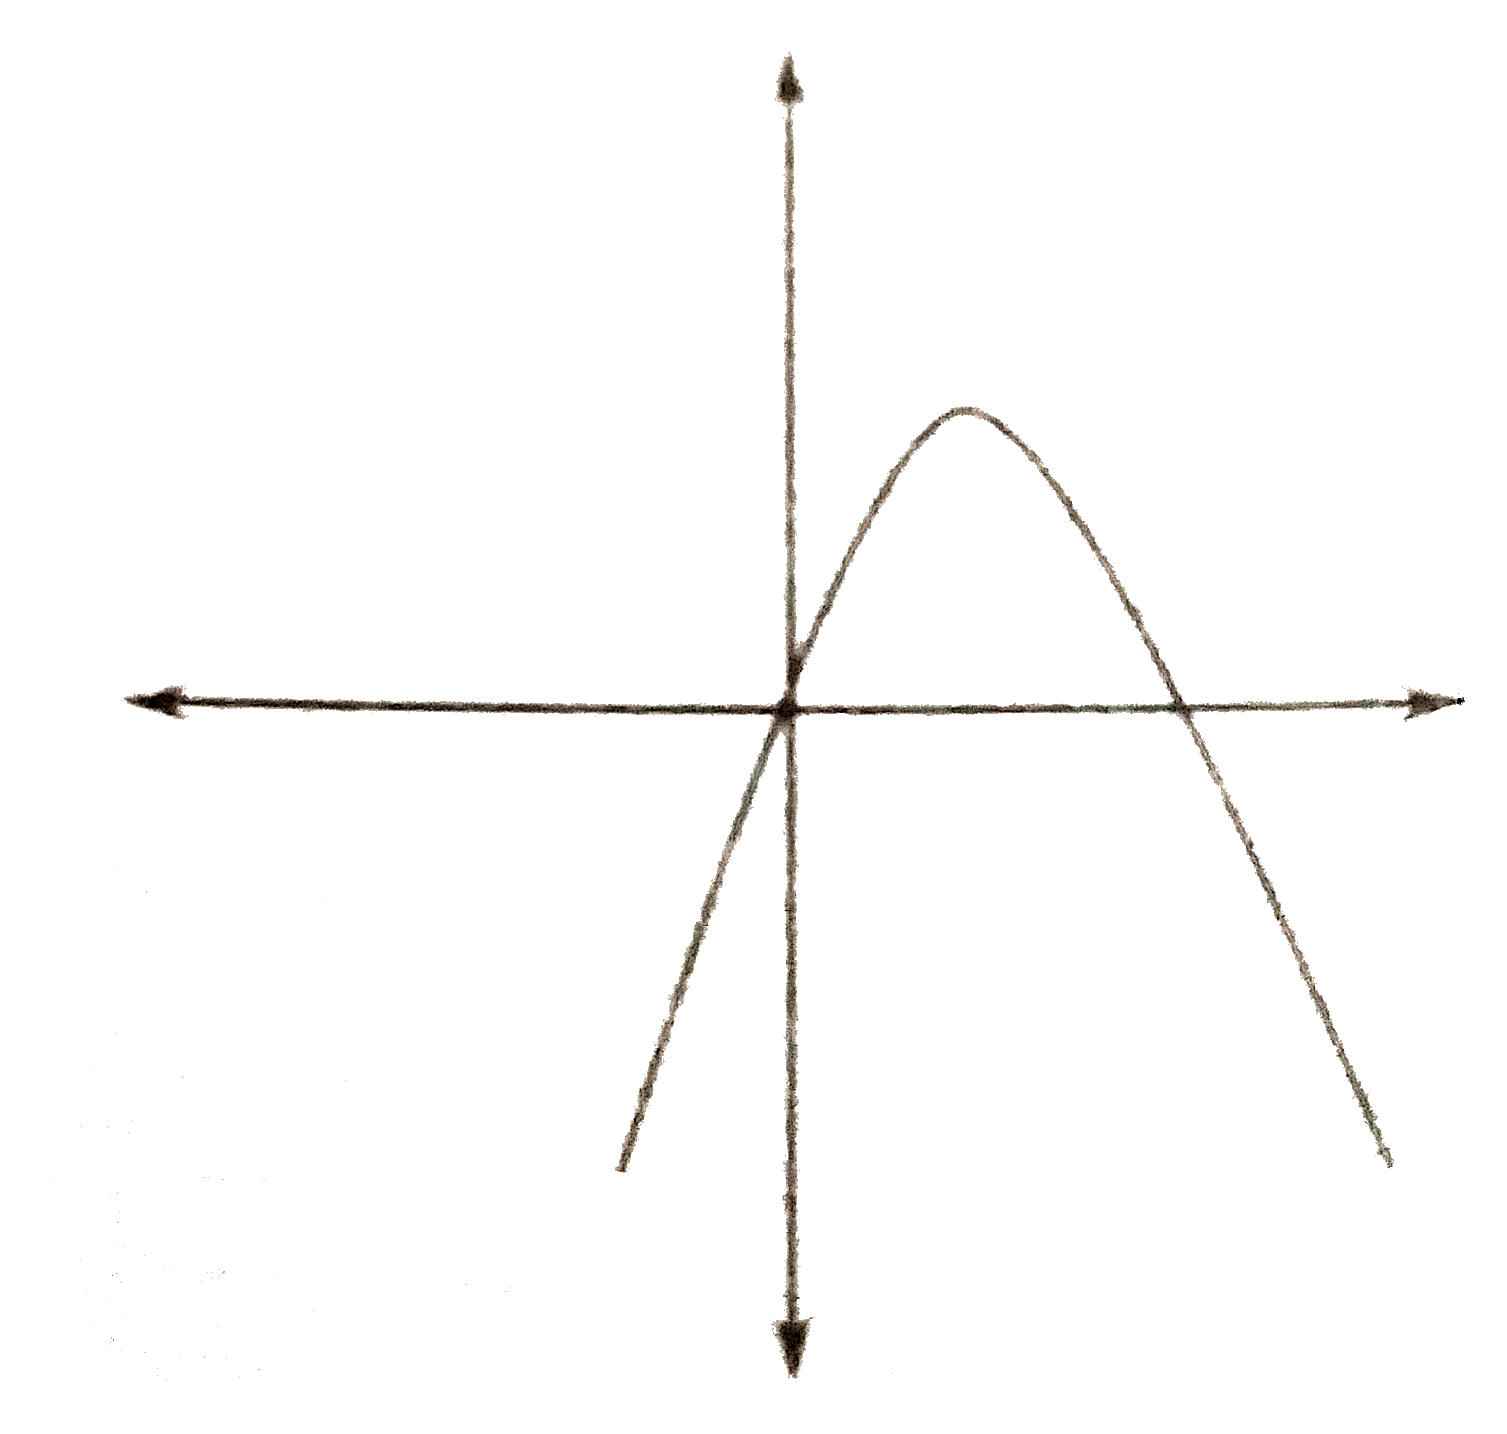 B
B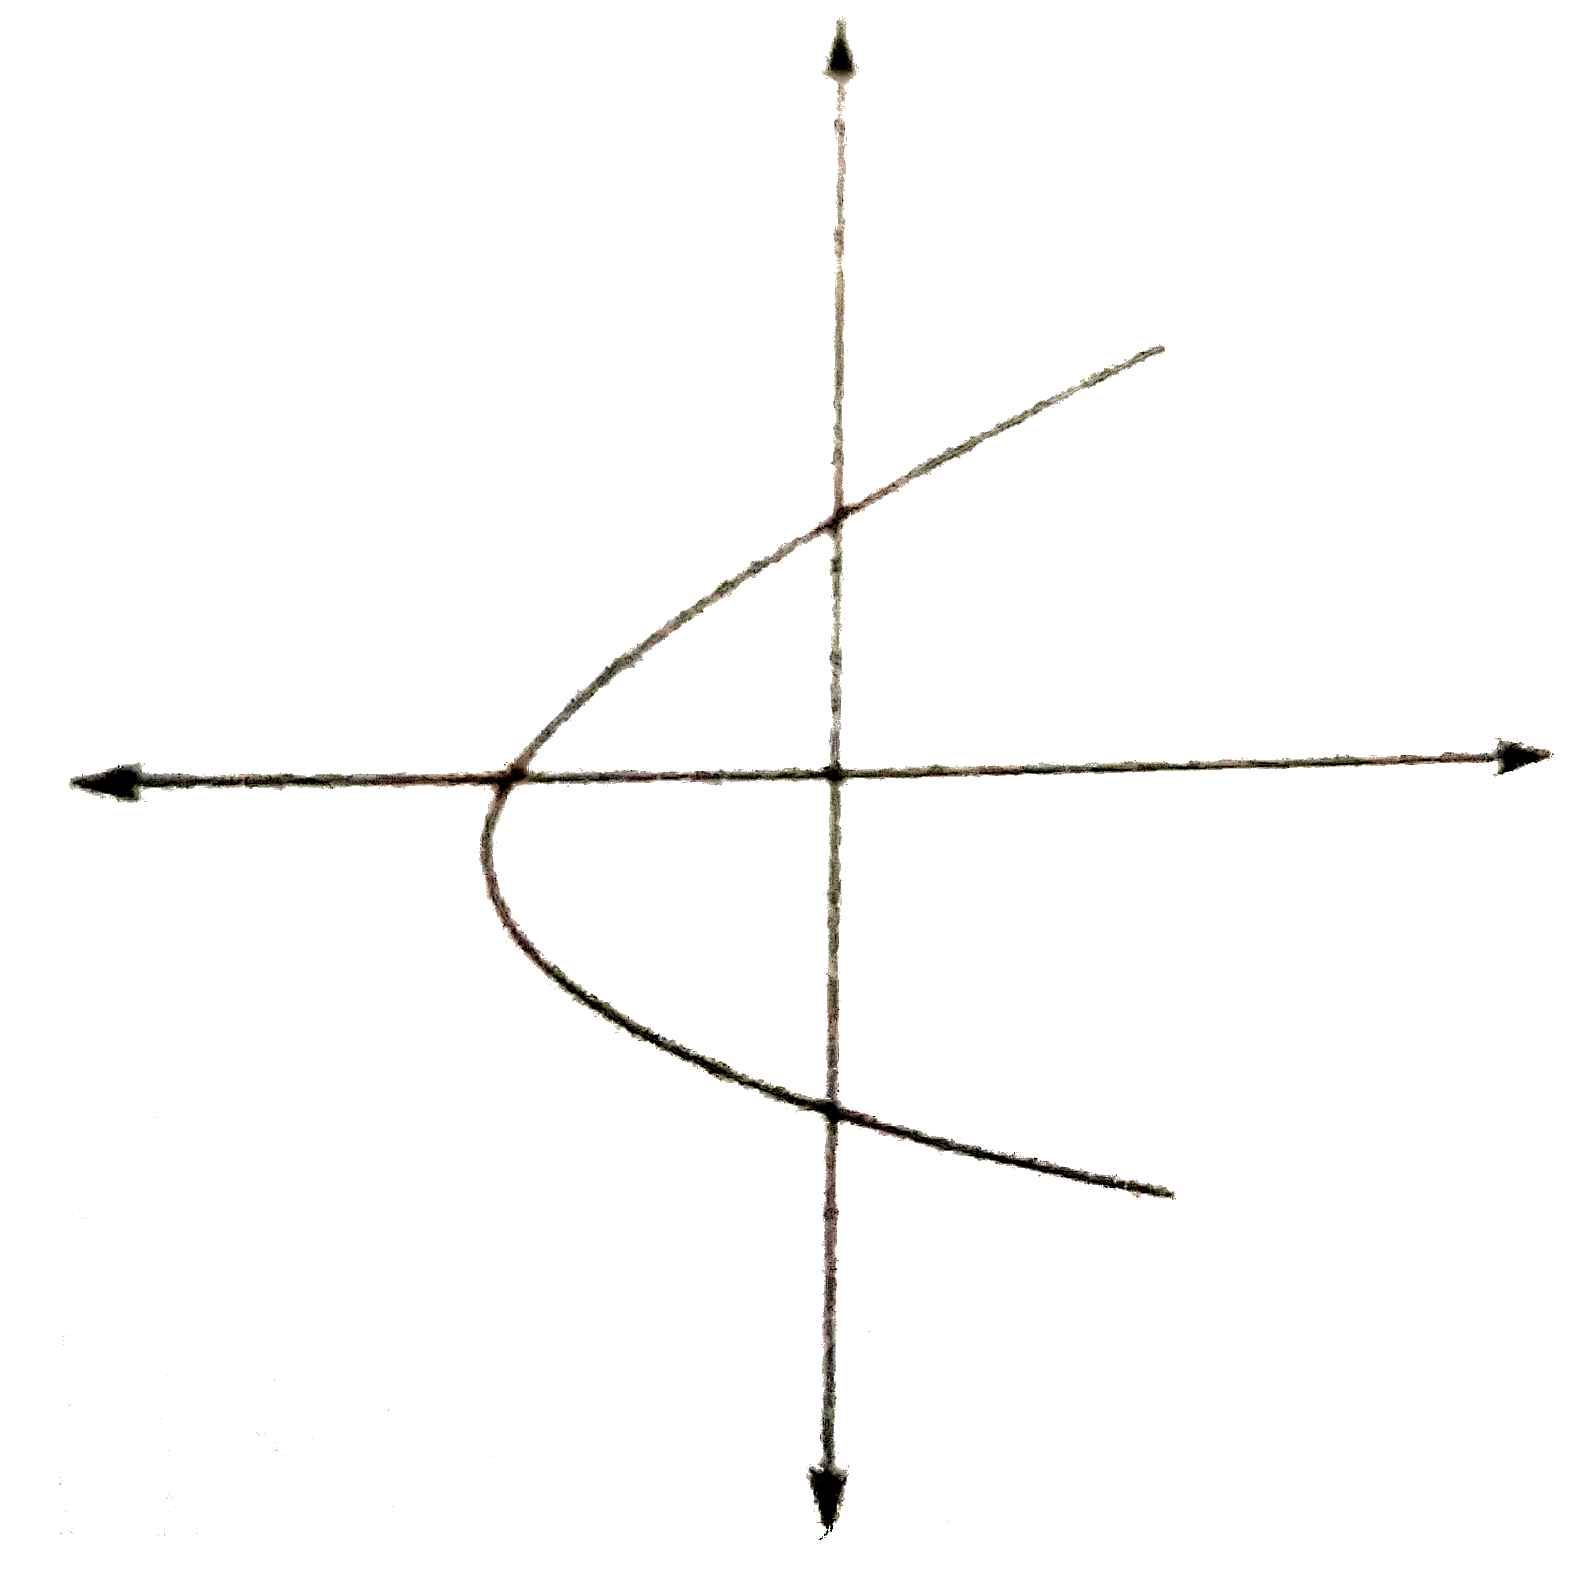 C
C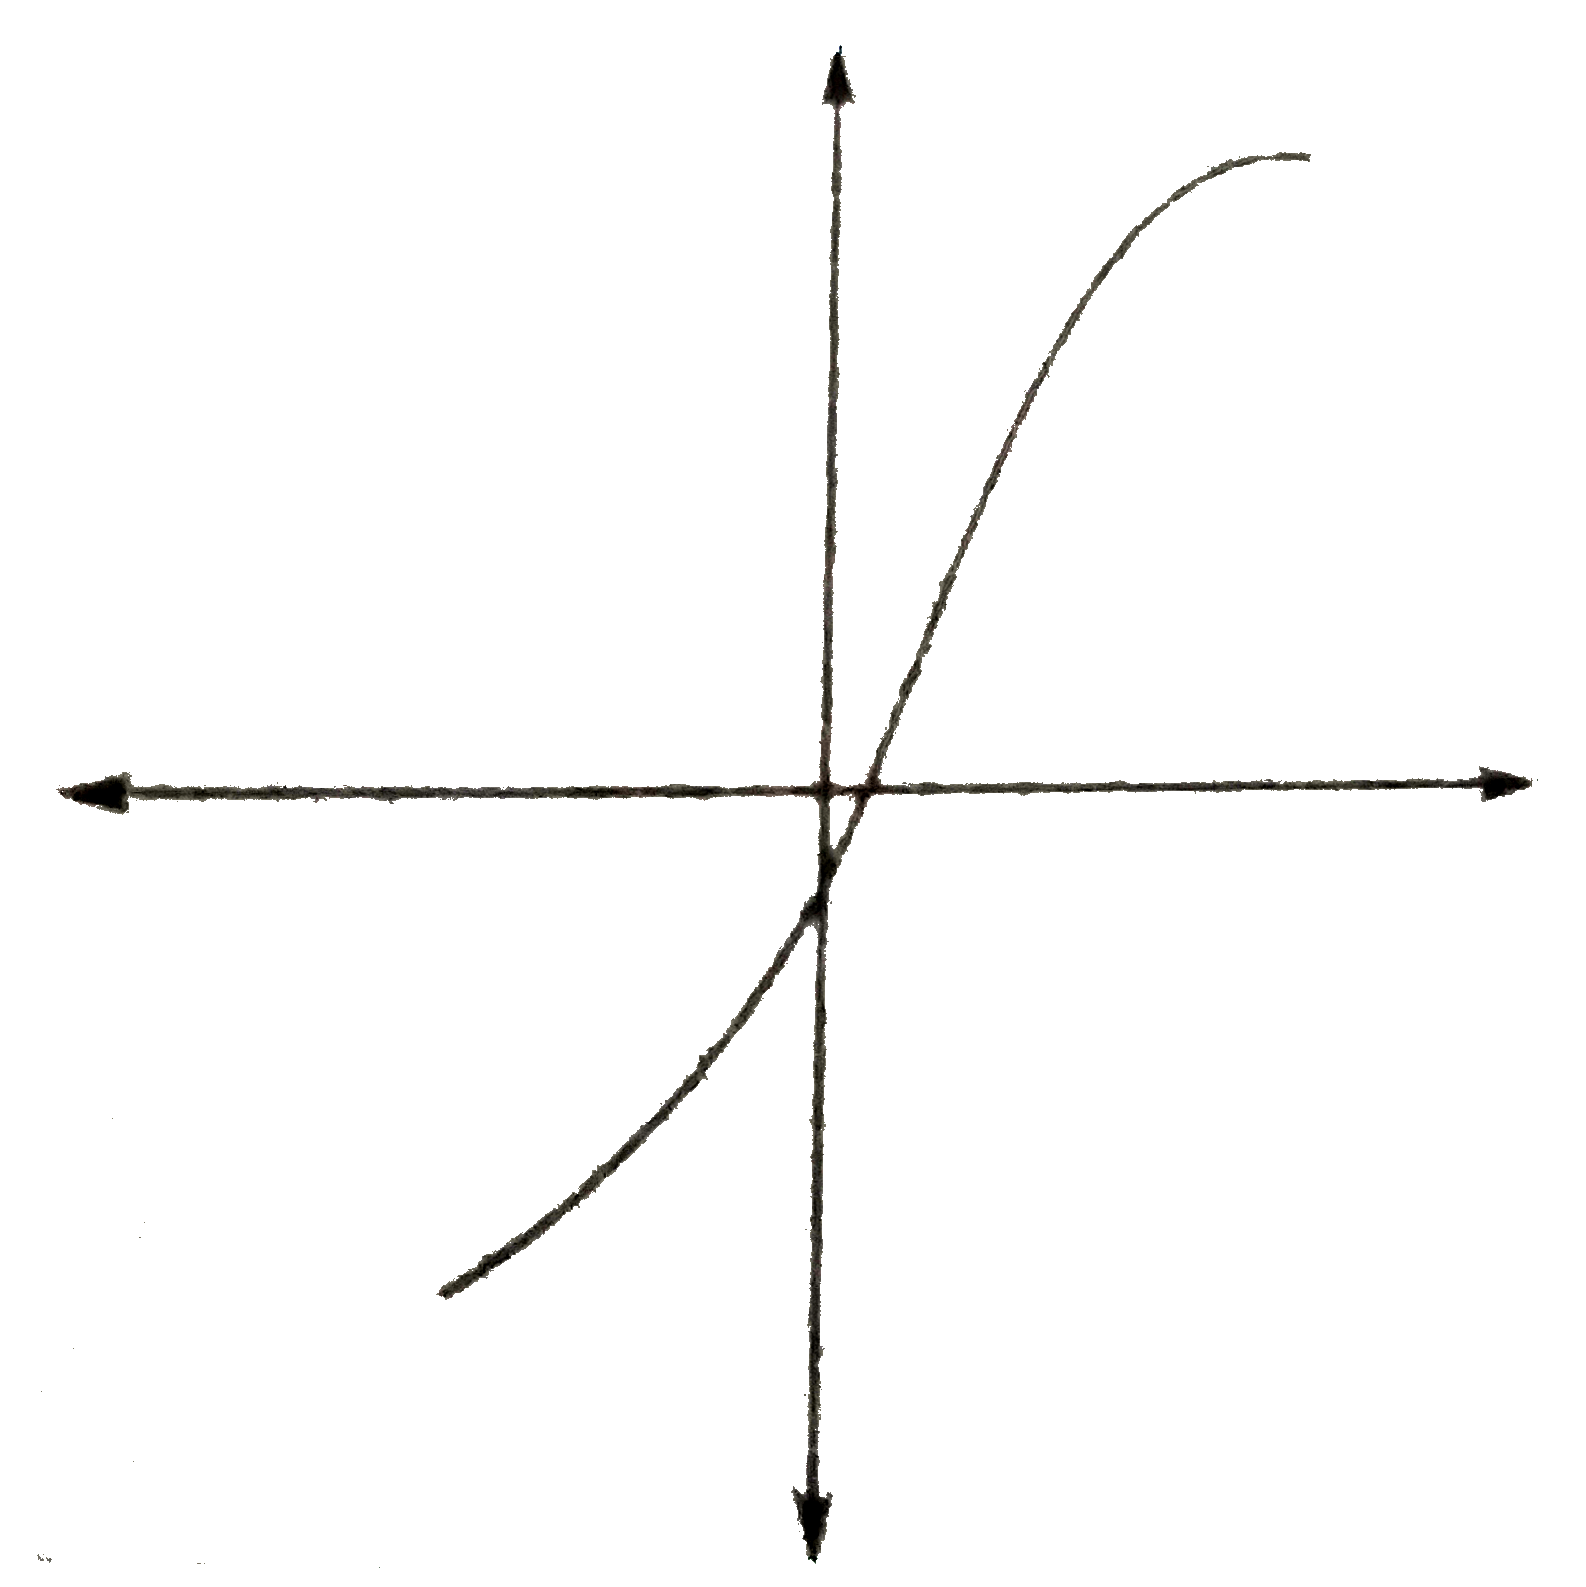 D
D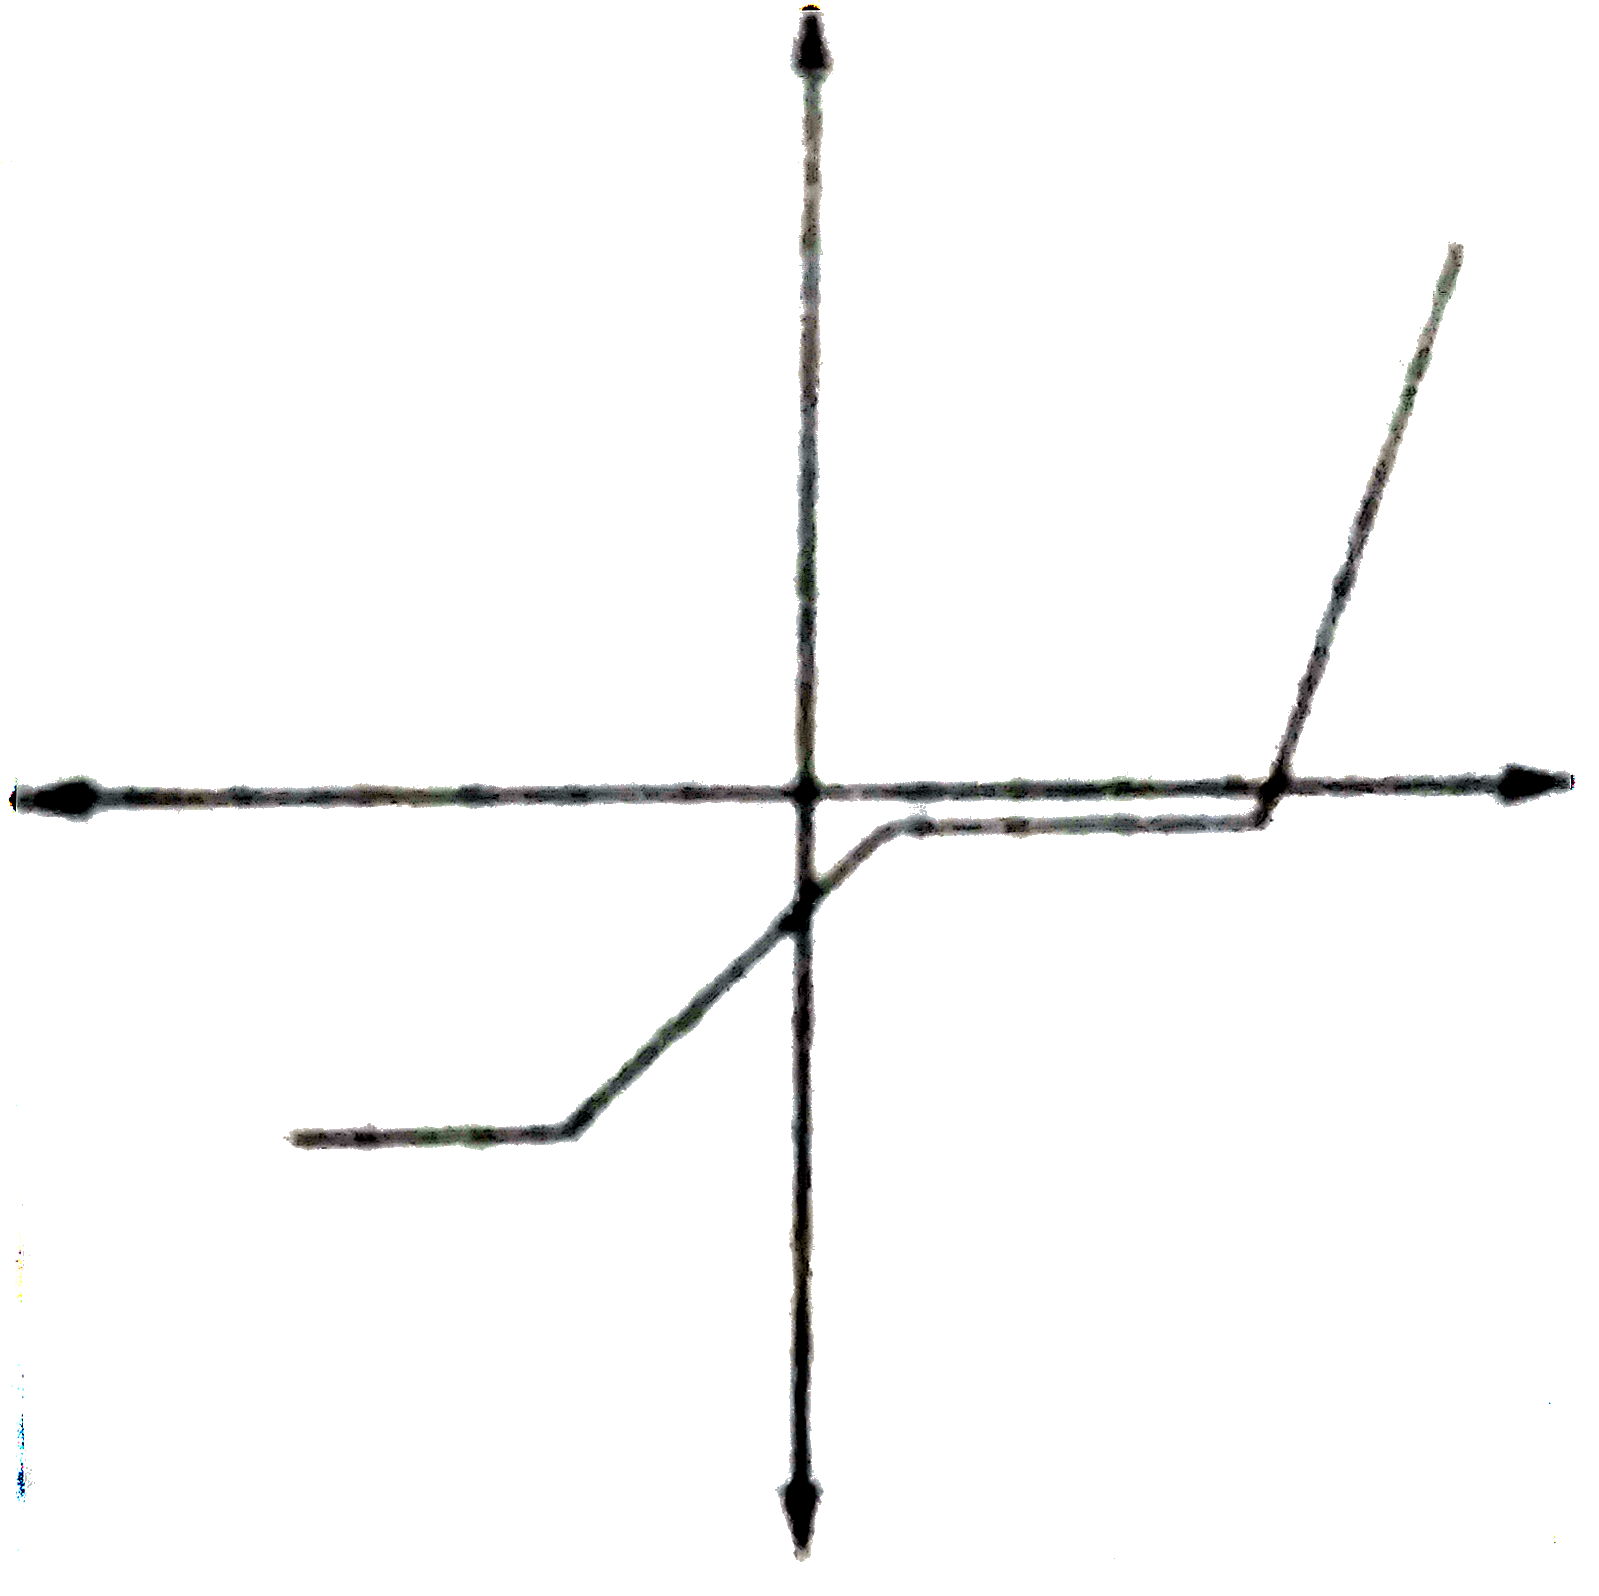
If function f has exactly two distinct real zeros, which of the following graphs could be the complete graph of f (x) ?
A B
B C
C D
D
Which of the following changes are the chemical changes?

View SolutionWhich of the following graph is correct for a zero order reaction ?
View SolutionThe linear momentum of a particle varies with time as p=a0+at+bt2. Which of the following graph represents force and time relation ?
View SolutionWhich physical quantities are expressed by the following ? (a) rate of change of angular momentum (b) moment of momentum
View SolutionWhich of the following graphs could not be the graph of a function?
View Solution

