The oscillation of a body on smooth horizontal surface is represented by the equation,x=Acosωt where ,x=displacement at time t
ω=frequency of oscillation
which one of the following graphs shows correctly the variation of a with t?
Here , a=acceleration at time t
T =time period


The correct Answer is:C
Step by step video & image solution for The oscillation of a body on smooth horizontal surface is represented by the equation,x=A"cos"omegat where ,x=displacement at time t omega=frequency of oscillation which one of the following graphs shows correctly the variation of a with t? Here , a=acceleration at time t T =time period by Physics experts to help you in doubts & scoring excellent marks in Class 12 exams.
Updated on:21/07/2023Topper's Solved these Questions
- OSCILLATIONSBOOK - AAKASH INSTITUTE ENGLISHCHAPTER - OSCILLATIONSEXERCISE - Assignment (Section D) (ASSERTION-REASON TYPE QUESTIONS)
13 Videos
- OSCILLATIONSBOOK - AAKASH INSTITUTE ENGLISHCHAPTER - OSCILLATIONSEXERCISE - Assignment (Section - B) (OBJECTIVE TYPE QUESTIONS)
30 Videos
- NUCLEIBOOK - AAKASH INSTITUTE ENGLISHCHAPTER - NUCLEIEXERCISE - ASSIGNMENT (SECTION-D)
10 Videos
- PHYSICAL WORLDBOOK - AAKASH INSTITUTE ENGLISHCHAPTER - PHYSICAL WORLDEXERCISE - ASSIGNMENT (Section-B)
4 Videos
Similar Questions
The oscillation of a body on a smooth horizental surface is respresented by the equation
X=Acos(ωt)
where one of the following graph shown correctly the variation a with t?
View SolutionThe graph shown the variation with times t of the velocity v of an object . Which one of the following graphs best represents the variation of acceleration a of the object with time t?

View Solution
Knowledge Check

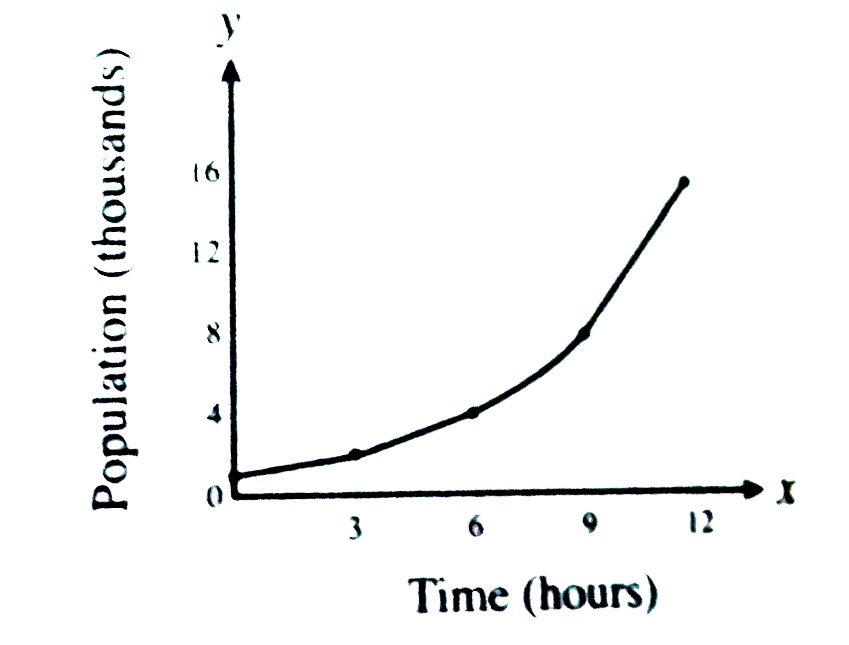
The graph above shows the size of a certain population after time t. Which of the following equations correctly shows y as a function of t ?Ay=t3By=1.000−2t3Cy=3t2Dy=1,000t-2,000
Which of the following x-t graphs represents the distance-time variation of a body released from the top of a buiding?
View SolutionA simple harmonic motion is represented by x(t)=sin2ωt−2cos2ωt. The angular frequency of oscillation is given by
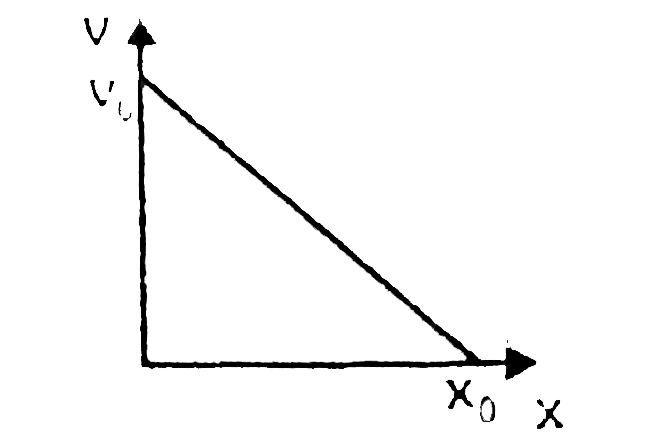
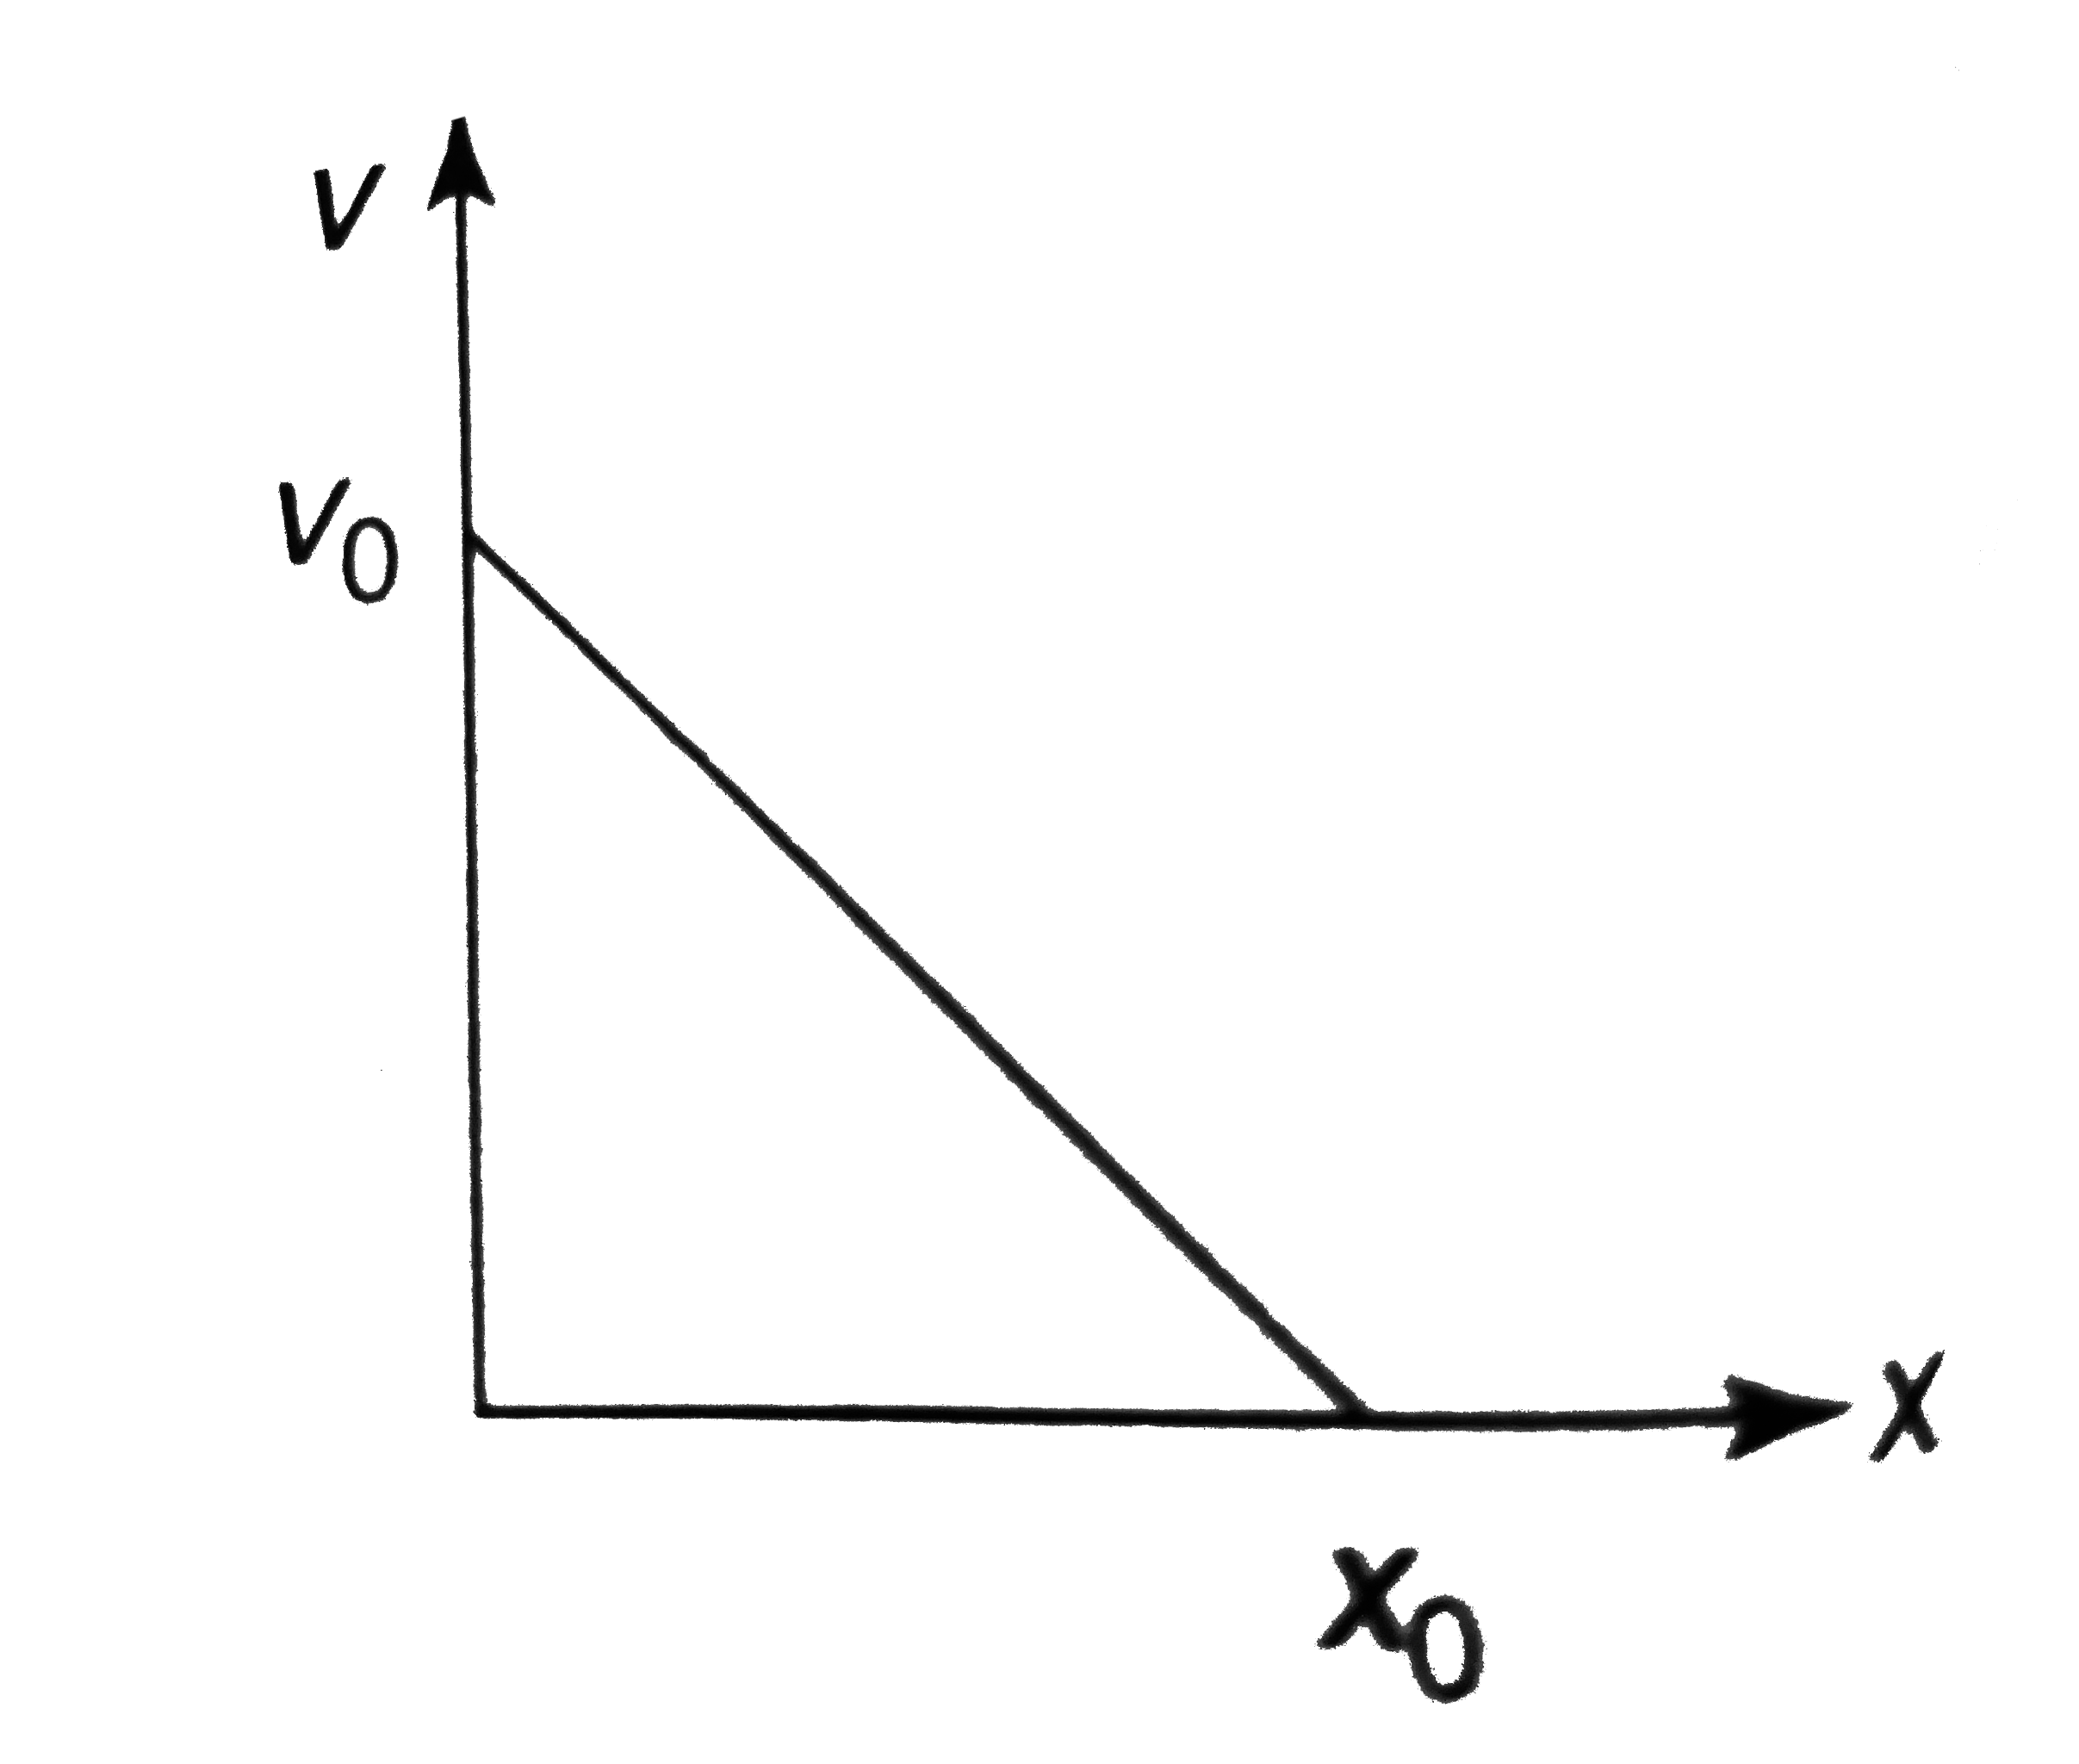
View SolutionThe given graph shows the variation of velocity with displacement. Which one of the graph given below correctly represents the variation of acceleration with displacement :-

View SolutionThe given graph shows the variation of velocity with displacement. Which one of the graphs given below correctly represents the variation of acceleration with displacement ?

View SolutionIf x denotes displacement in time t and x=a cost, then acceleration is :-
View SolutionThe SHM of a particle is given by the equation x=2sinωt+4cosωt. Its amplitude of oscillation is
View SolutionIf s=et (sin t - cos t) is the equation of motion of a moving particle, then acceleration at time t is given by
View Solution
