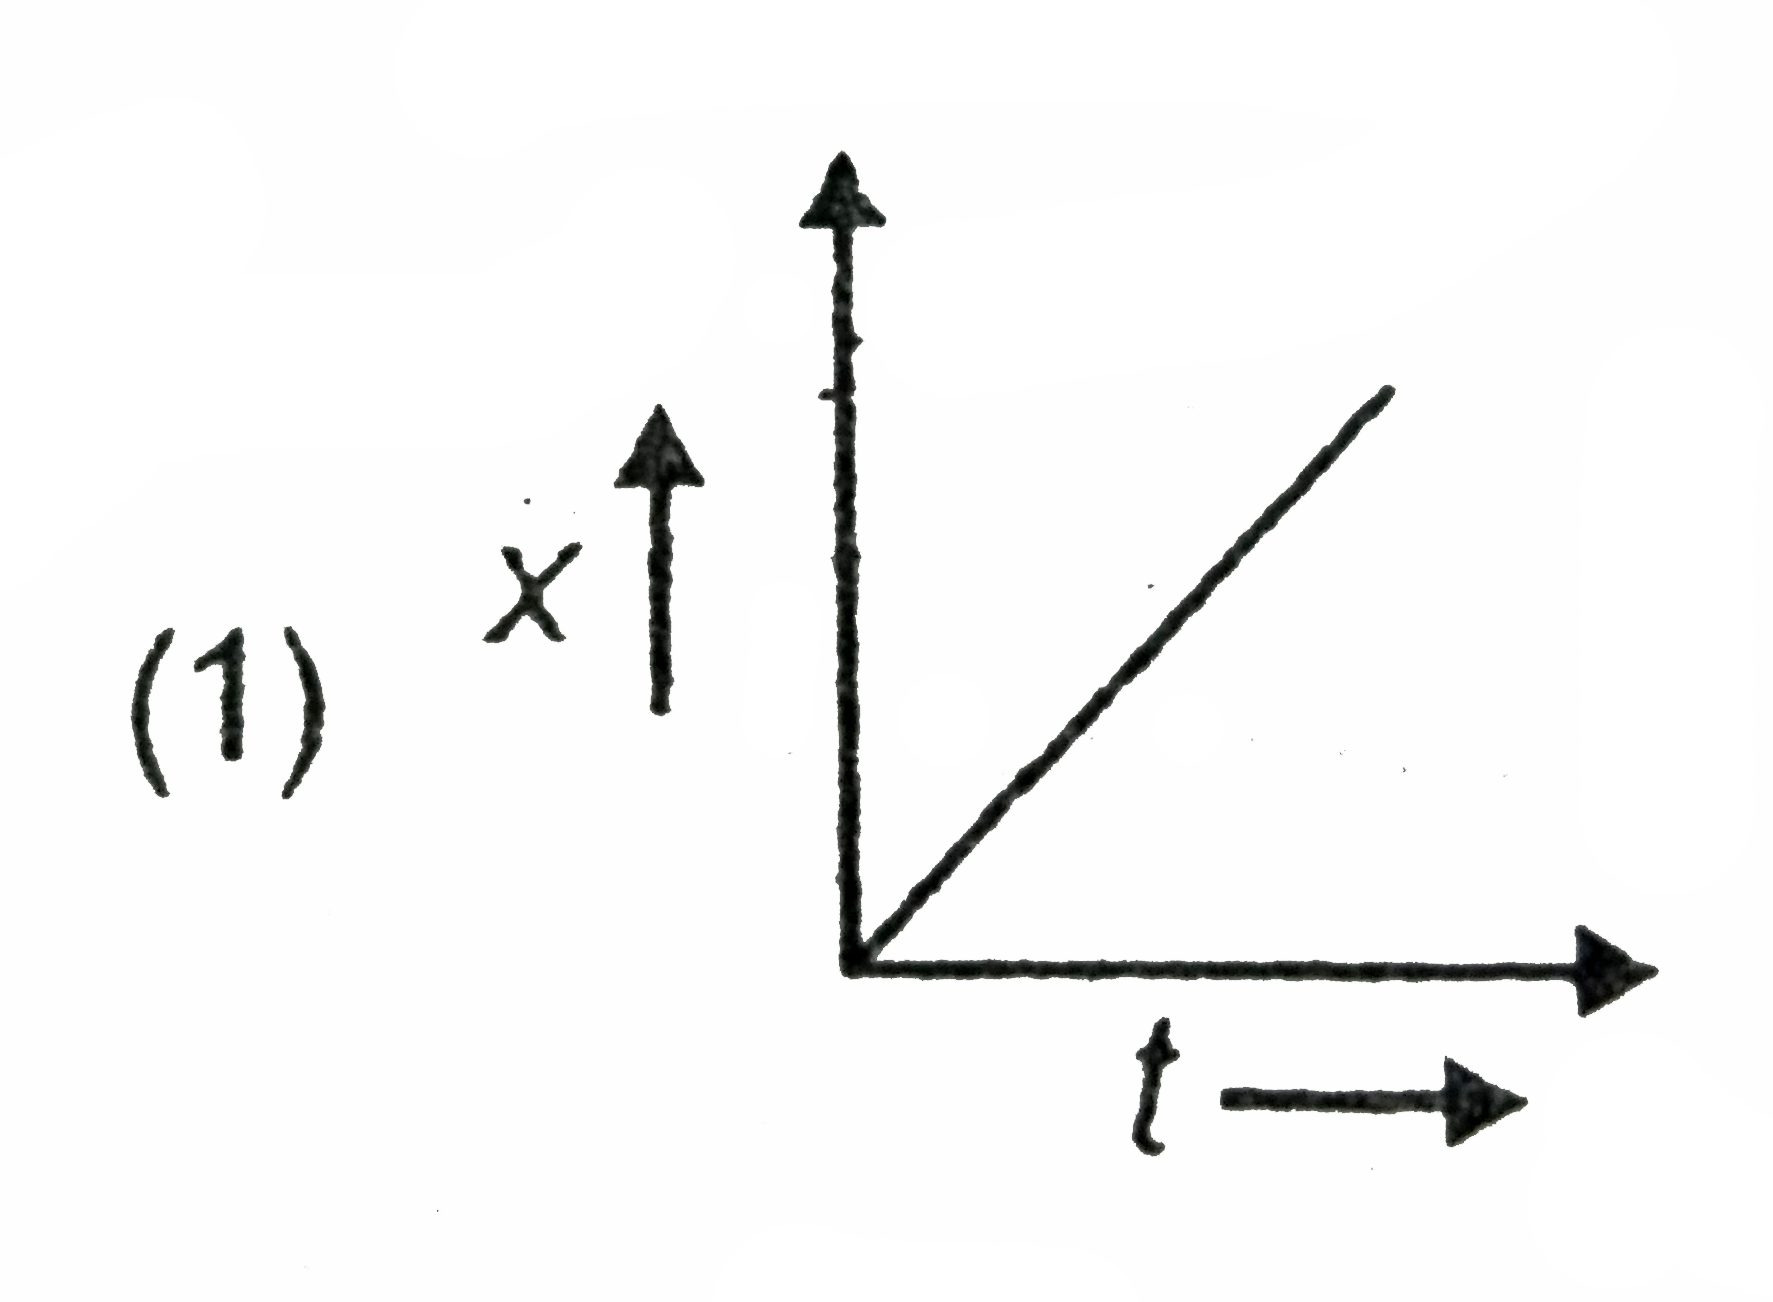
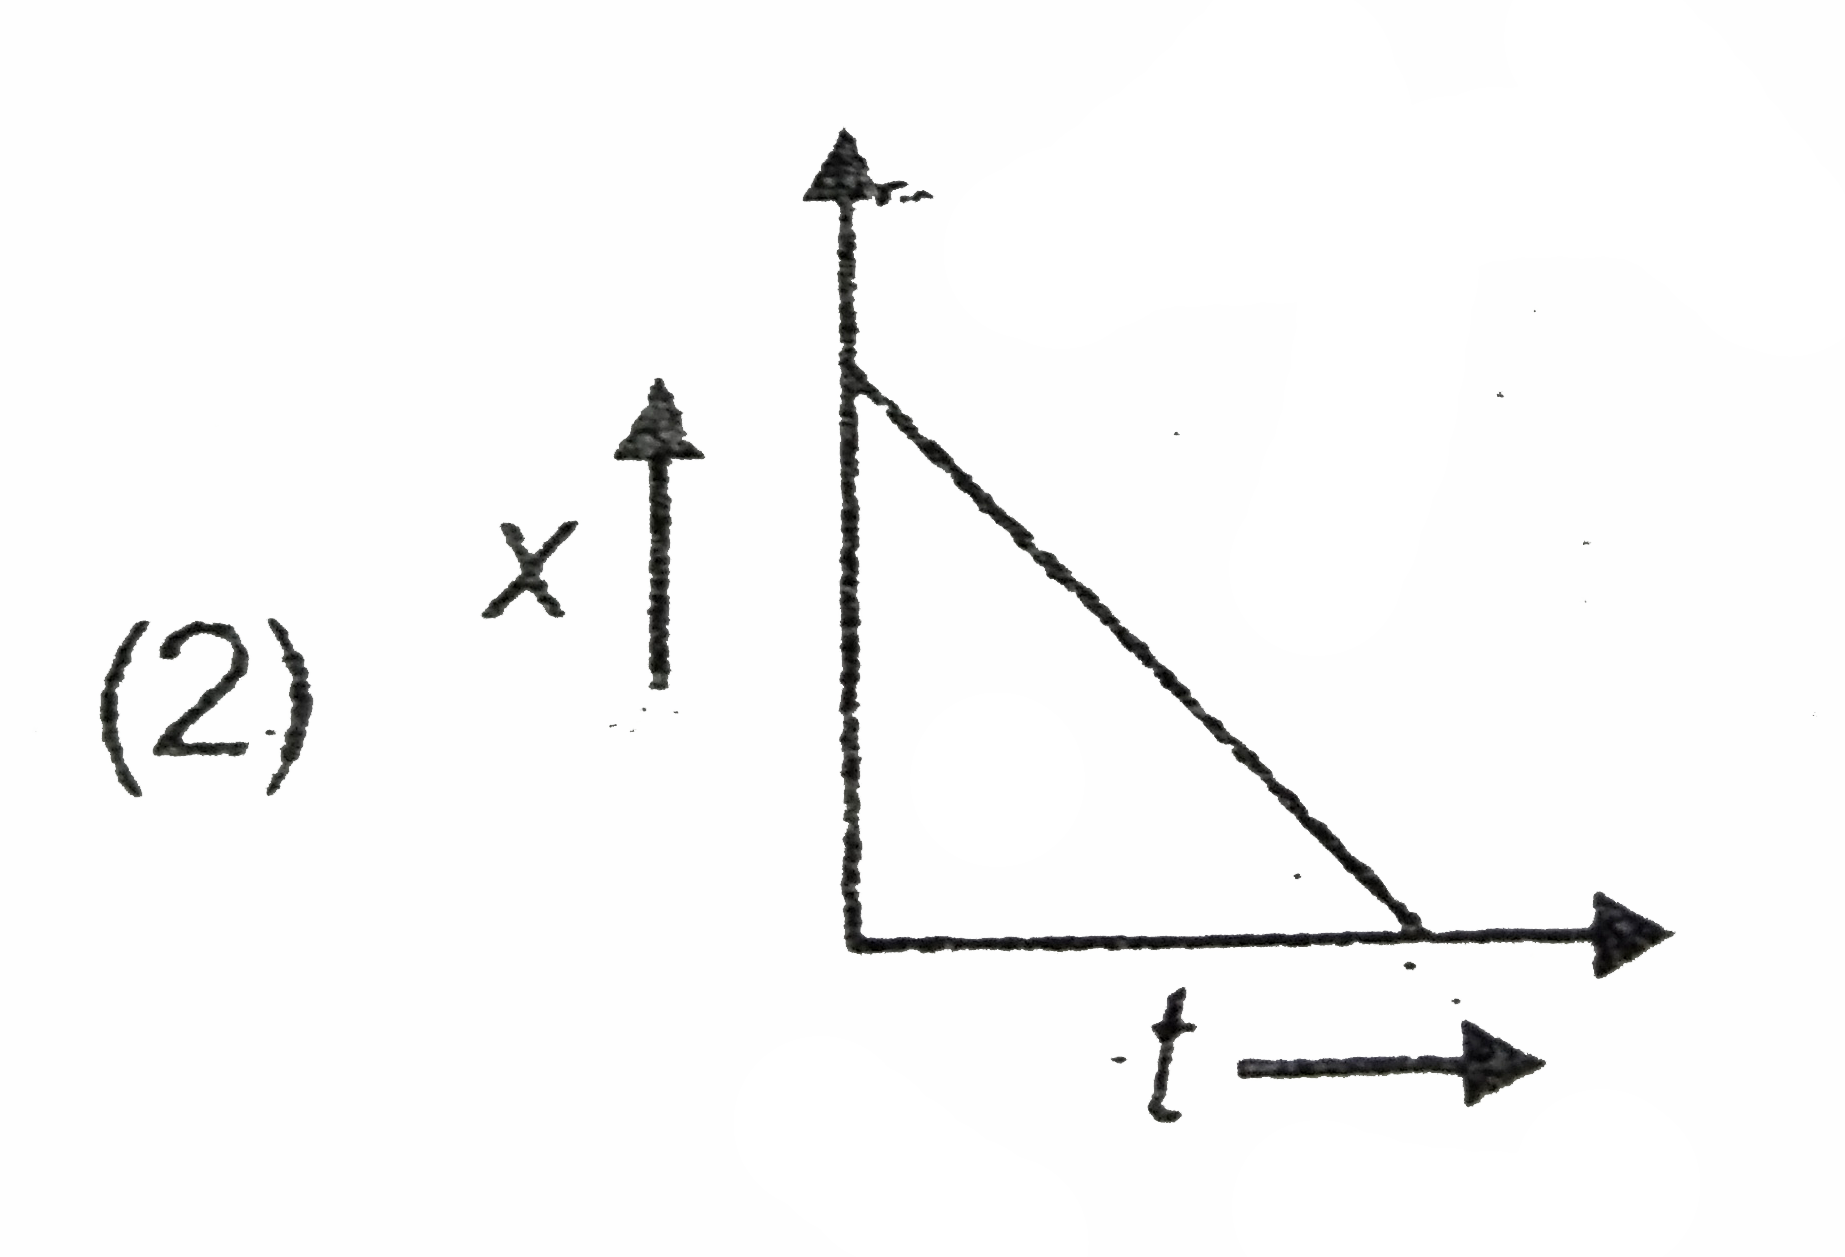
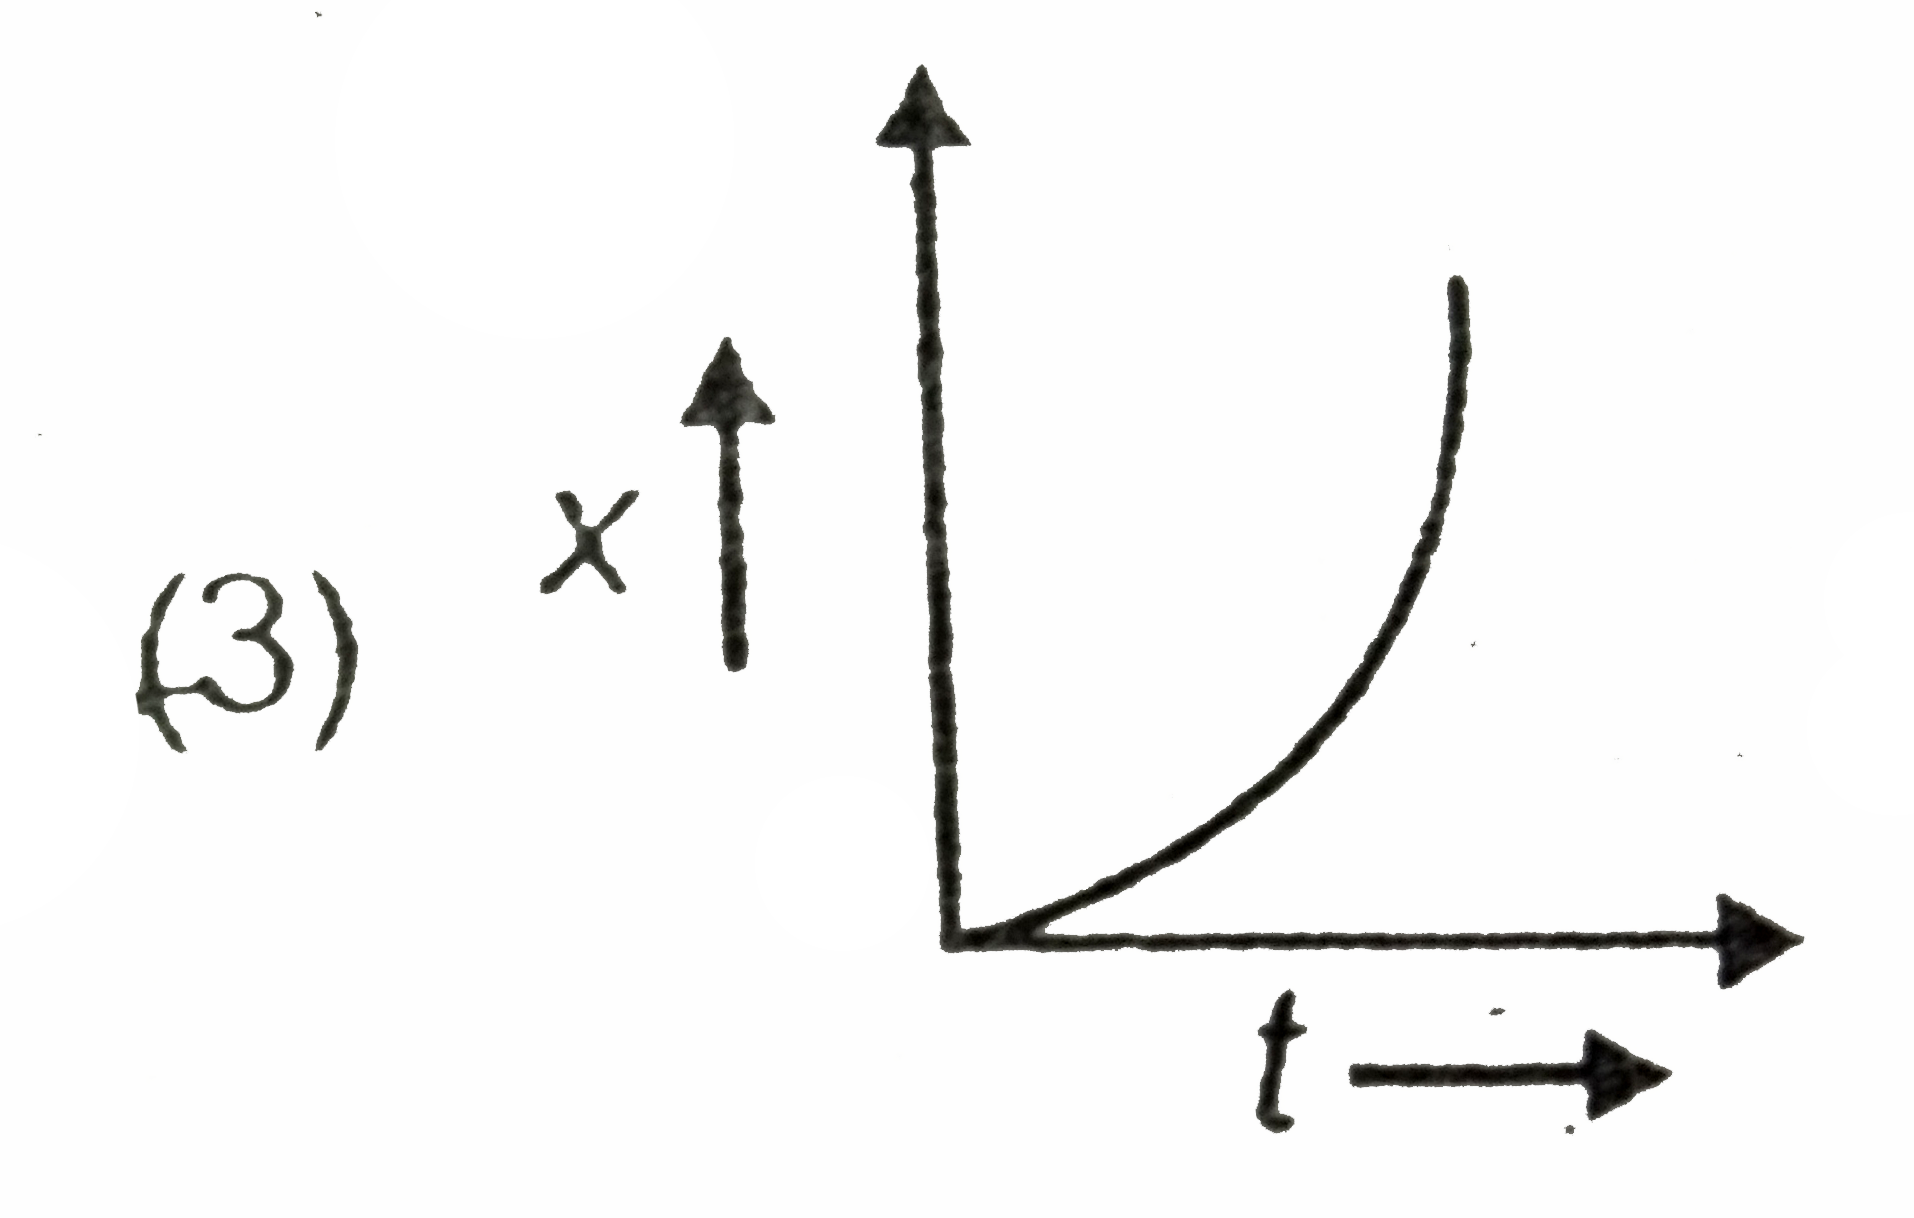
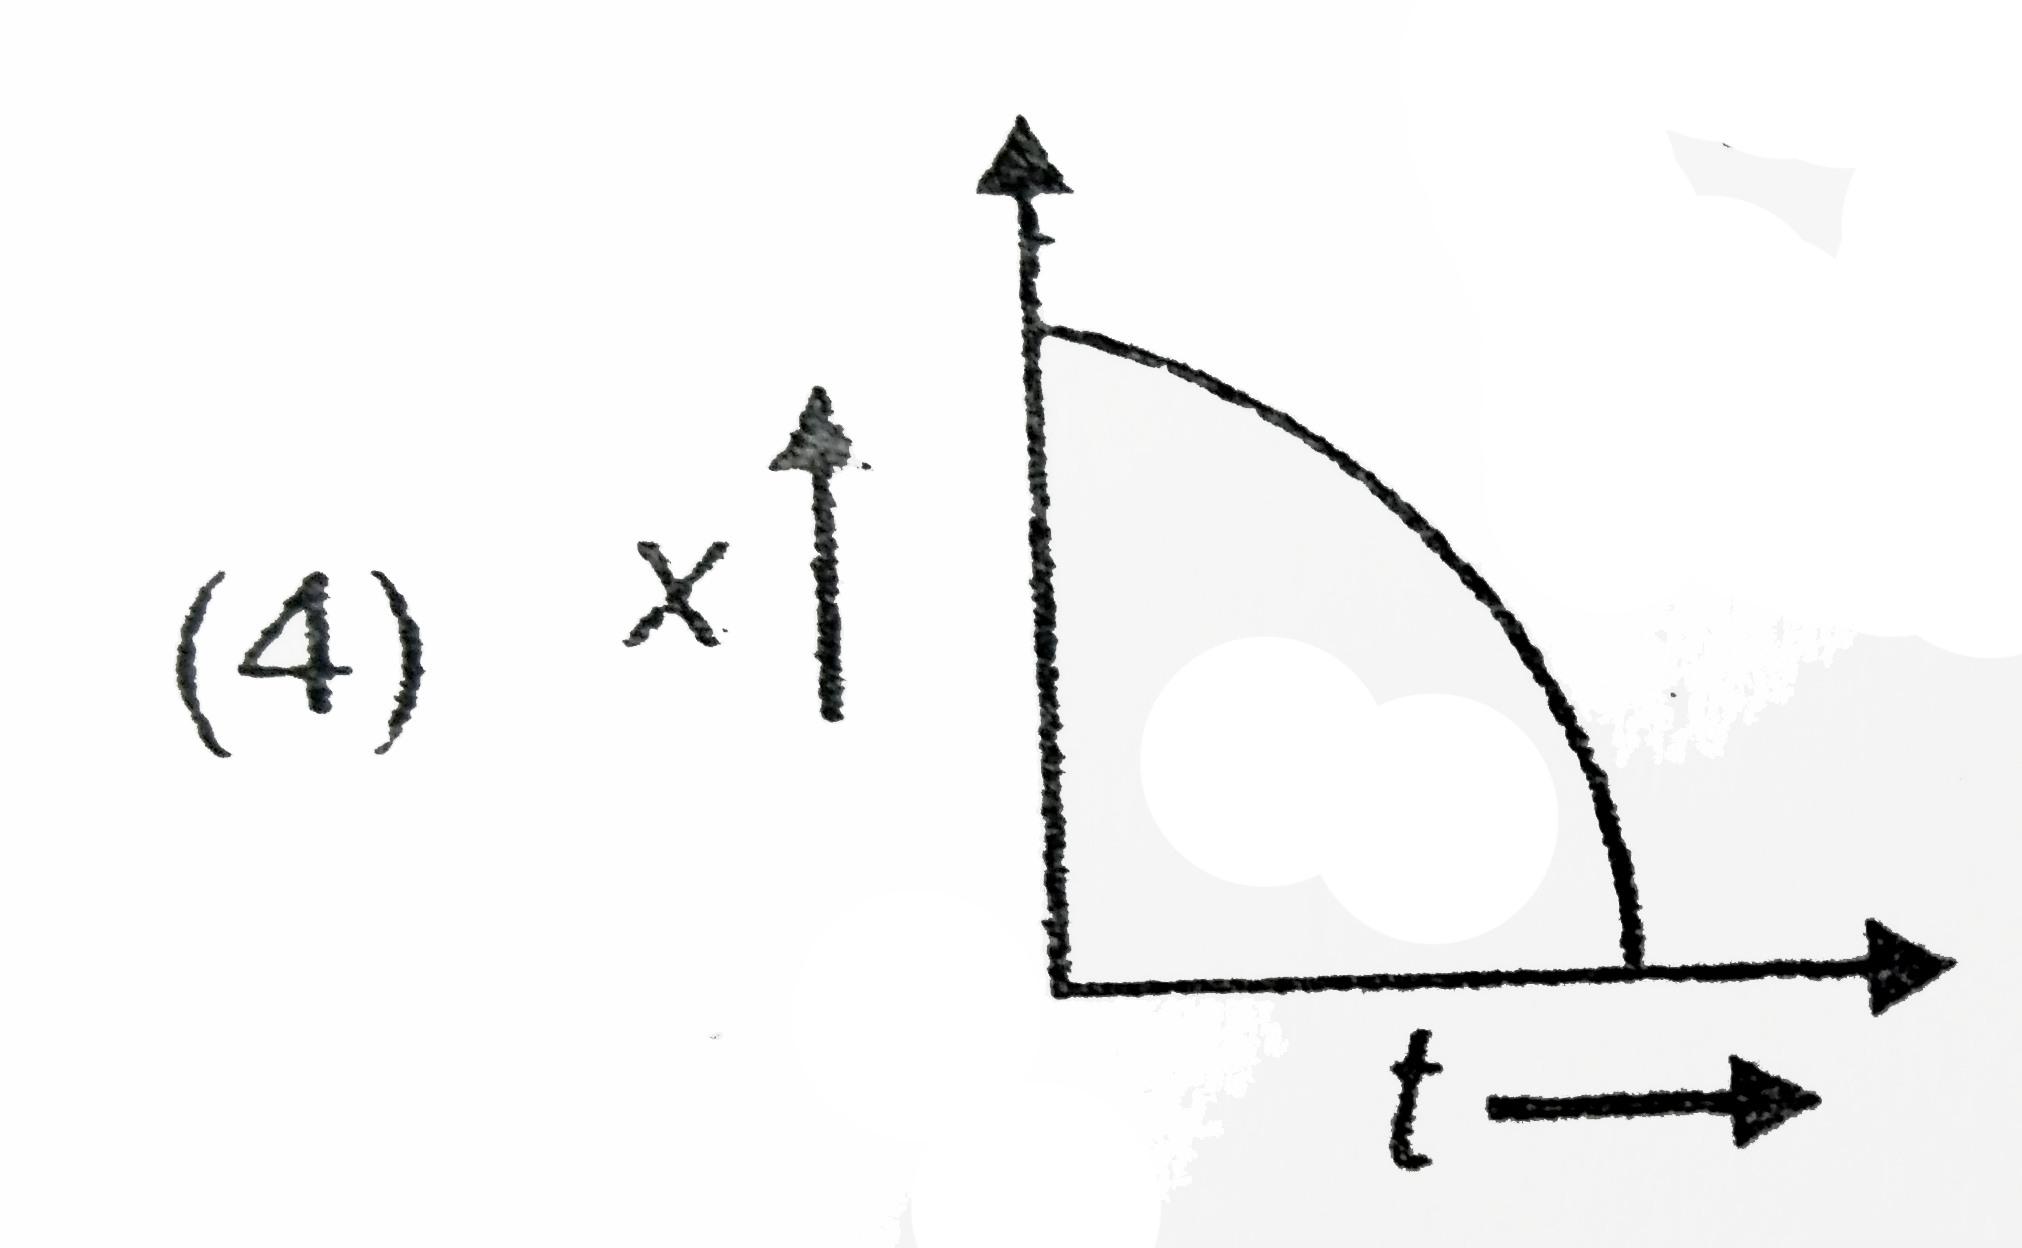
Which of the following x-t graphs represents the distance-time variation of a body released from the top of a buiding?
The correct Answer is:C
To determine which x-t graph represents the distance-time variation of a body released from the top of a building, we can analyze the motion of the body under the influence of gravity. Here’s a step-by-step solution:
Step 1: Understand the Motion
When a body is released from the top of a building, it is in free fall. This means it experiences constant acceleration due to gravity (approximately 9.81m/s2 downward).
Hint: Remember that free fall implies constant acceleration.
Step 2: Identify the Initial Conditions
Since the body is released (not thrown), its initial velocity (u) is 0 m/s. The only force acting on it is gravity.
Hint: The initial velocity is crucial for determining the shape of the graph.
Step 3: Use the Kinematic Equation
The displacement (x) of the body can be described by the kinematic equation:
x=ut+12at2
Substituting u=0 and a=g (acceleration due to gravity):
x=0⋅t+12gt2=12gt2
Hint: Recognize that this equation is quadratic in form.
Step 4: Analyze the Graph
The equation x=12gt2 indicates that the displacement x is proportional to the square of the time t. The graph of a quadratic equation is a parabola that opens upwards.
Hint: Look for a parabolic shape in the options provided.
Step 5: Eliminate Incorrect Options
- The first two options are straight lines, which represent uniform motion (constant velocity), so they cannot represent a body in free fall.
- The fourth option shows distance decreasing with time, which is not possible for a body in free fall.
Hint: Distance can only increase or remain constant; it cannot decrease in this scenario.
Step 6: Identify the Correct Option
The only option left that shows a parabolic curve and represents increasing distance over time is the third option.
Hint: Confirm that the graph matches the expected behavior of the body in free fall.
Conclusion
The correct x-t graph that represents the distance-time variation of a body released from the top of a building is Option 3.
---
When a body is released from the top of a building, it is in free fall. This means it experiences constant acceleration due to gravity (approximately 9.81m/s2 downward).
Since the body is released (not thrown), its initial velocity (u) is 0 m/s. The only force acting on it is gravity.
The displacement (x) of the body can be described by the kinematic equation:
x=ut+12at2
Substituting u=0 and a=g (acceleration due to gravity):
x=0⋅t+12gt2=12gt2
The equation x=12gt2 indicates that the displacement x is proportional to the square of the time t. The graph of a quadratic equation is a parabola that opens upwards.
- The first two options are straight lines, which represent uniform motion (constant velocity), so they cannot represent a body in free fall.
- The fourth option shows distance decreasing with time, which is not possible for a body in free fall.
The only option left that shows a parabolic curve and represents increasing distance over time is the third option.
The correct x-t graph that represents the distance-time variation of a body released from the top of a building is Option 3.
Topper's Solved these Questions
- MOTION IN STRAIGHT LINEBOOK - AAKASH INSTITUTE ENGLISHCHAPTER - MOTION IN STRAIGHT LINEEXERCISE - Assignment (SECTION - B)
19 Videos
- MOTION IN STRAIGHT LINEBOOK - AAKASH INSTITUTE ENGLISHCHAPTER - MOTION IN STRAIGHT LINEEXERCISE - Assignment (SECTION - C)
7 Videos
- MOTION IN STRAIGHT LINEBOOK - AAKASH INSTITUTE ENGLISHCHAPTER - MOTION IN STRAIGHT LINEEXERCISE - Try Yourself
40 Videos
- MOTION IN A STRAIGHT LINEBOOK - AAKASH INSTITUTE ENGLISHCHAPTER - MOTION IN A STRAIGHT LINEEXERCISE - ASSIGNMENT (SECTION - D)
15 Videos
- MOVING CHARGE AND MAGNESIUMBOOK - AAKASH INSTITUTE ENGLISHCHAPTER - MOVING CHARGE AND MAGNESIUMEXERCISE - SECTION D
16 Videos
Similar Questions
Knowledge Check
Which of the following x-t graphs does not represent periodic motion?
A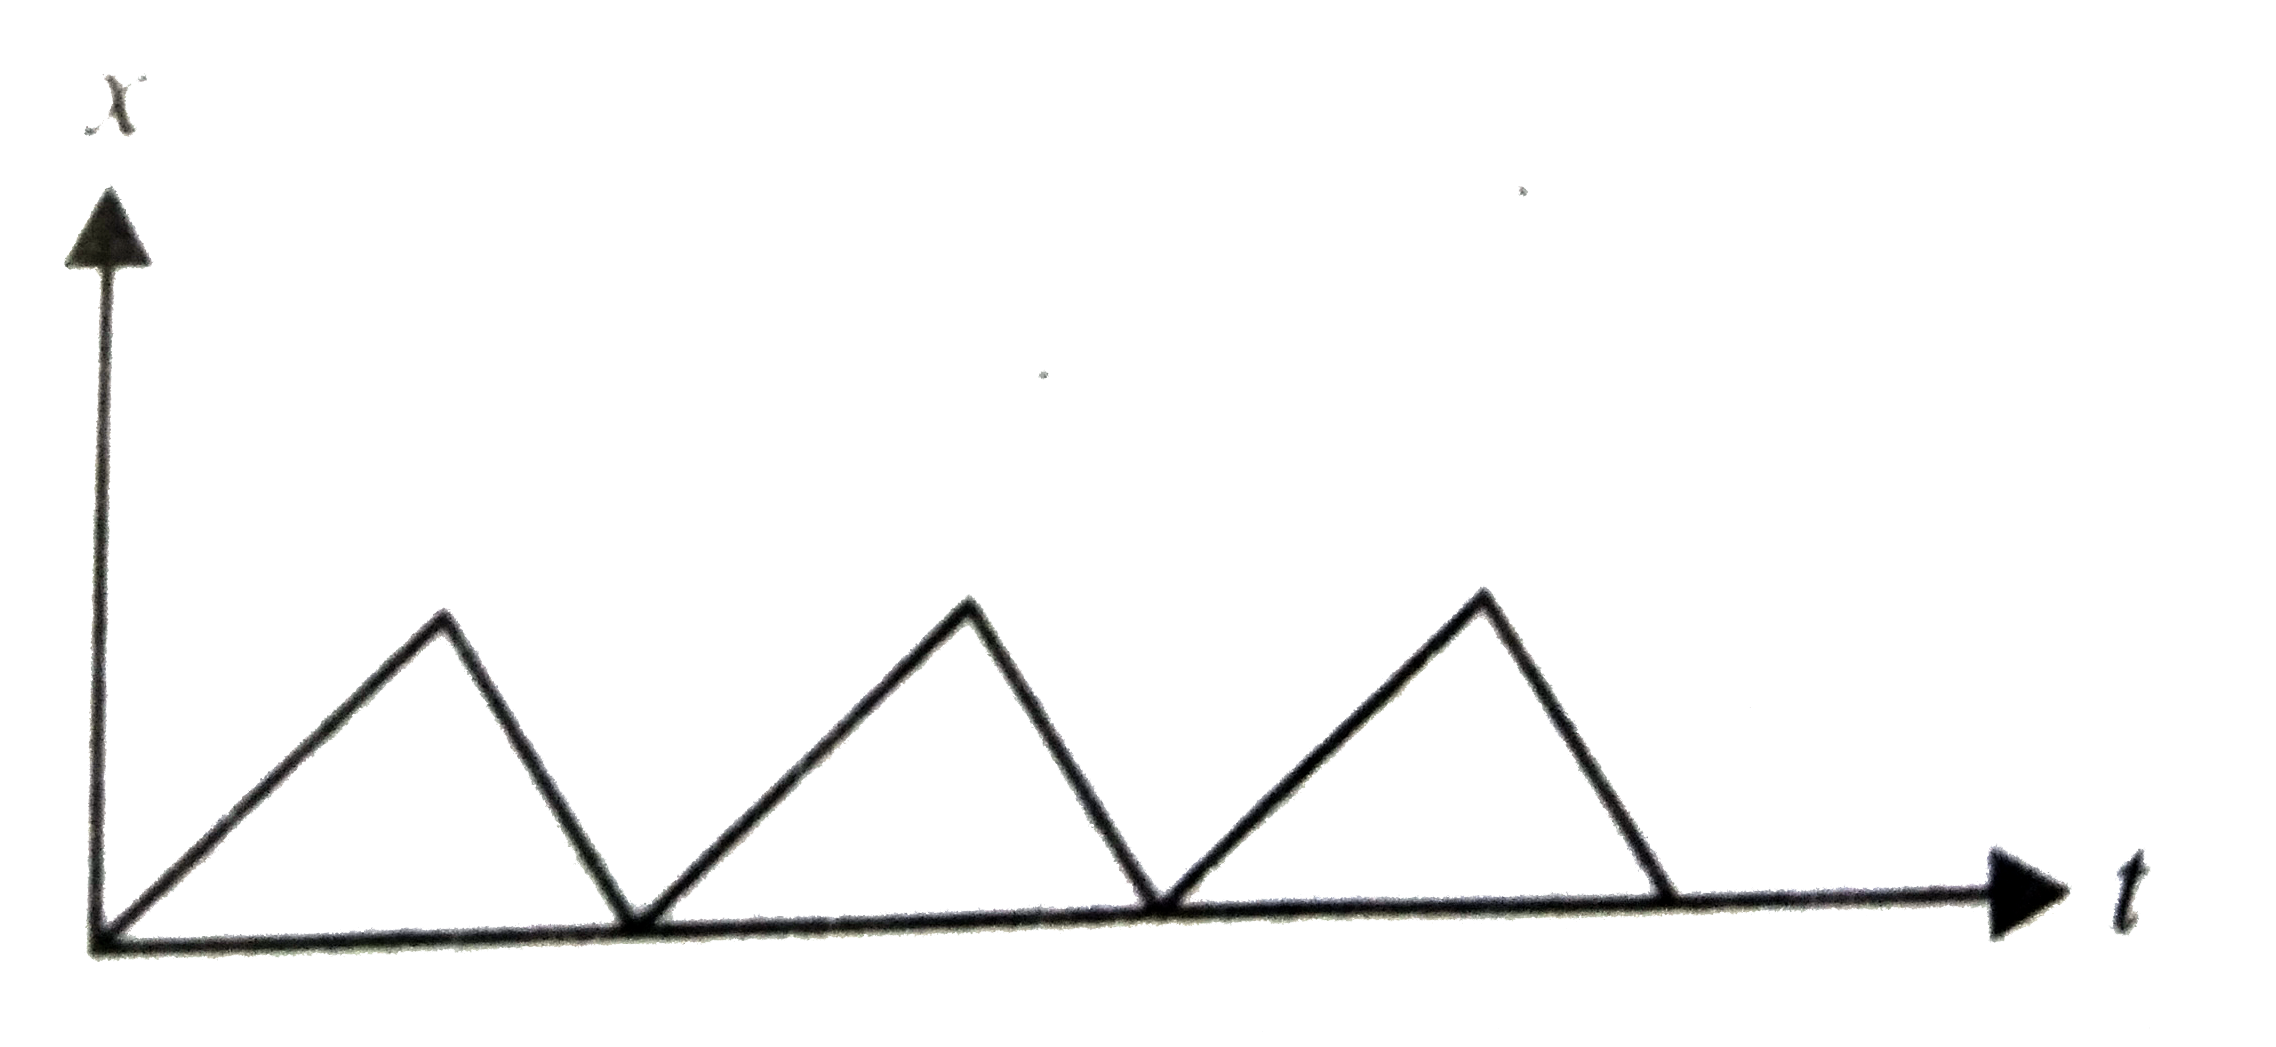 B
B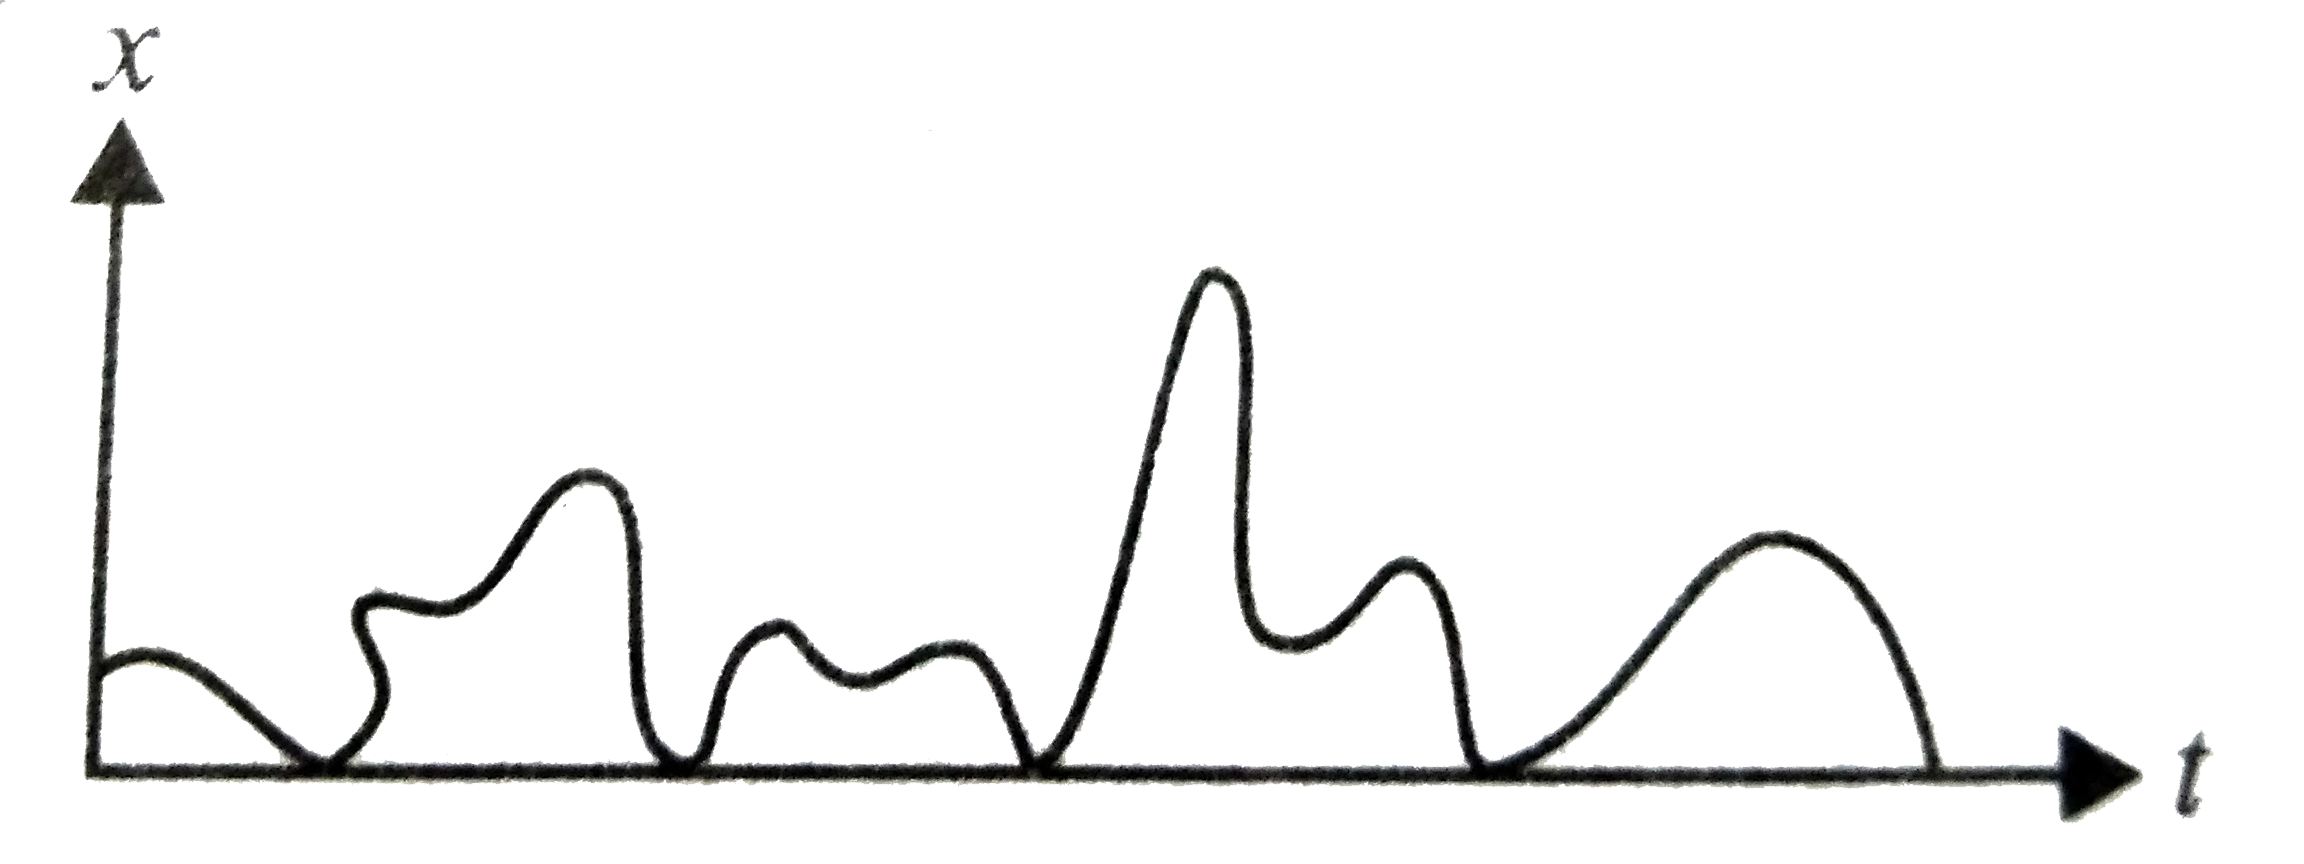 C
C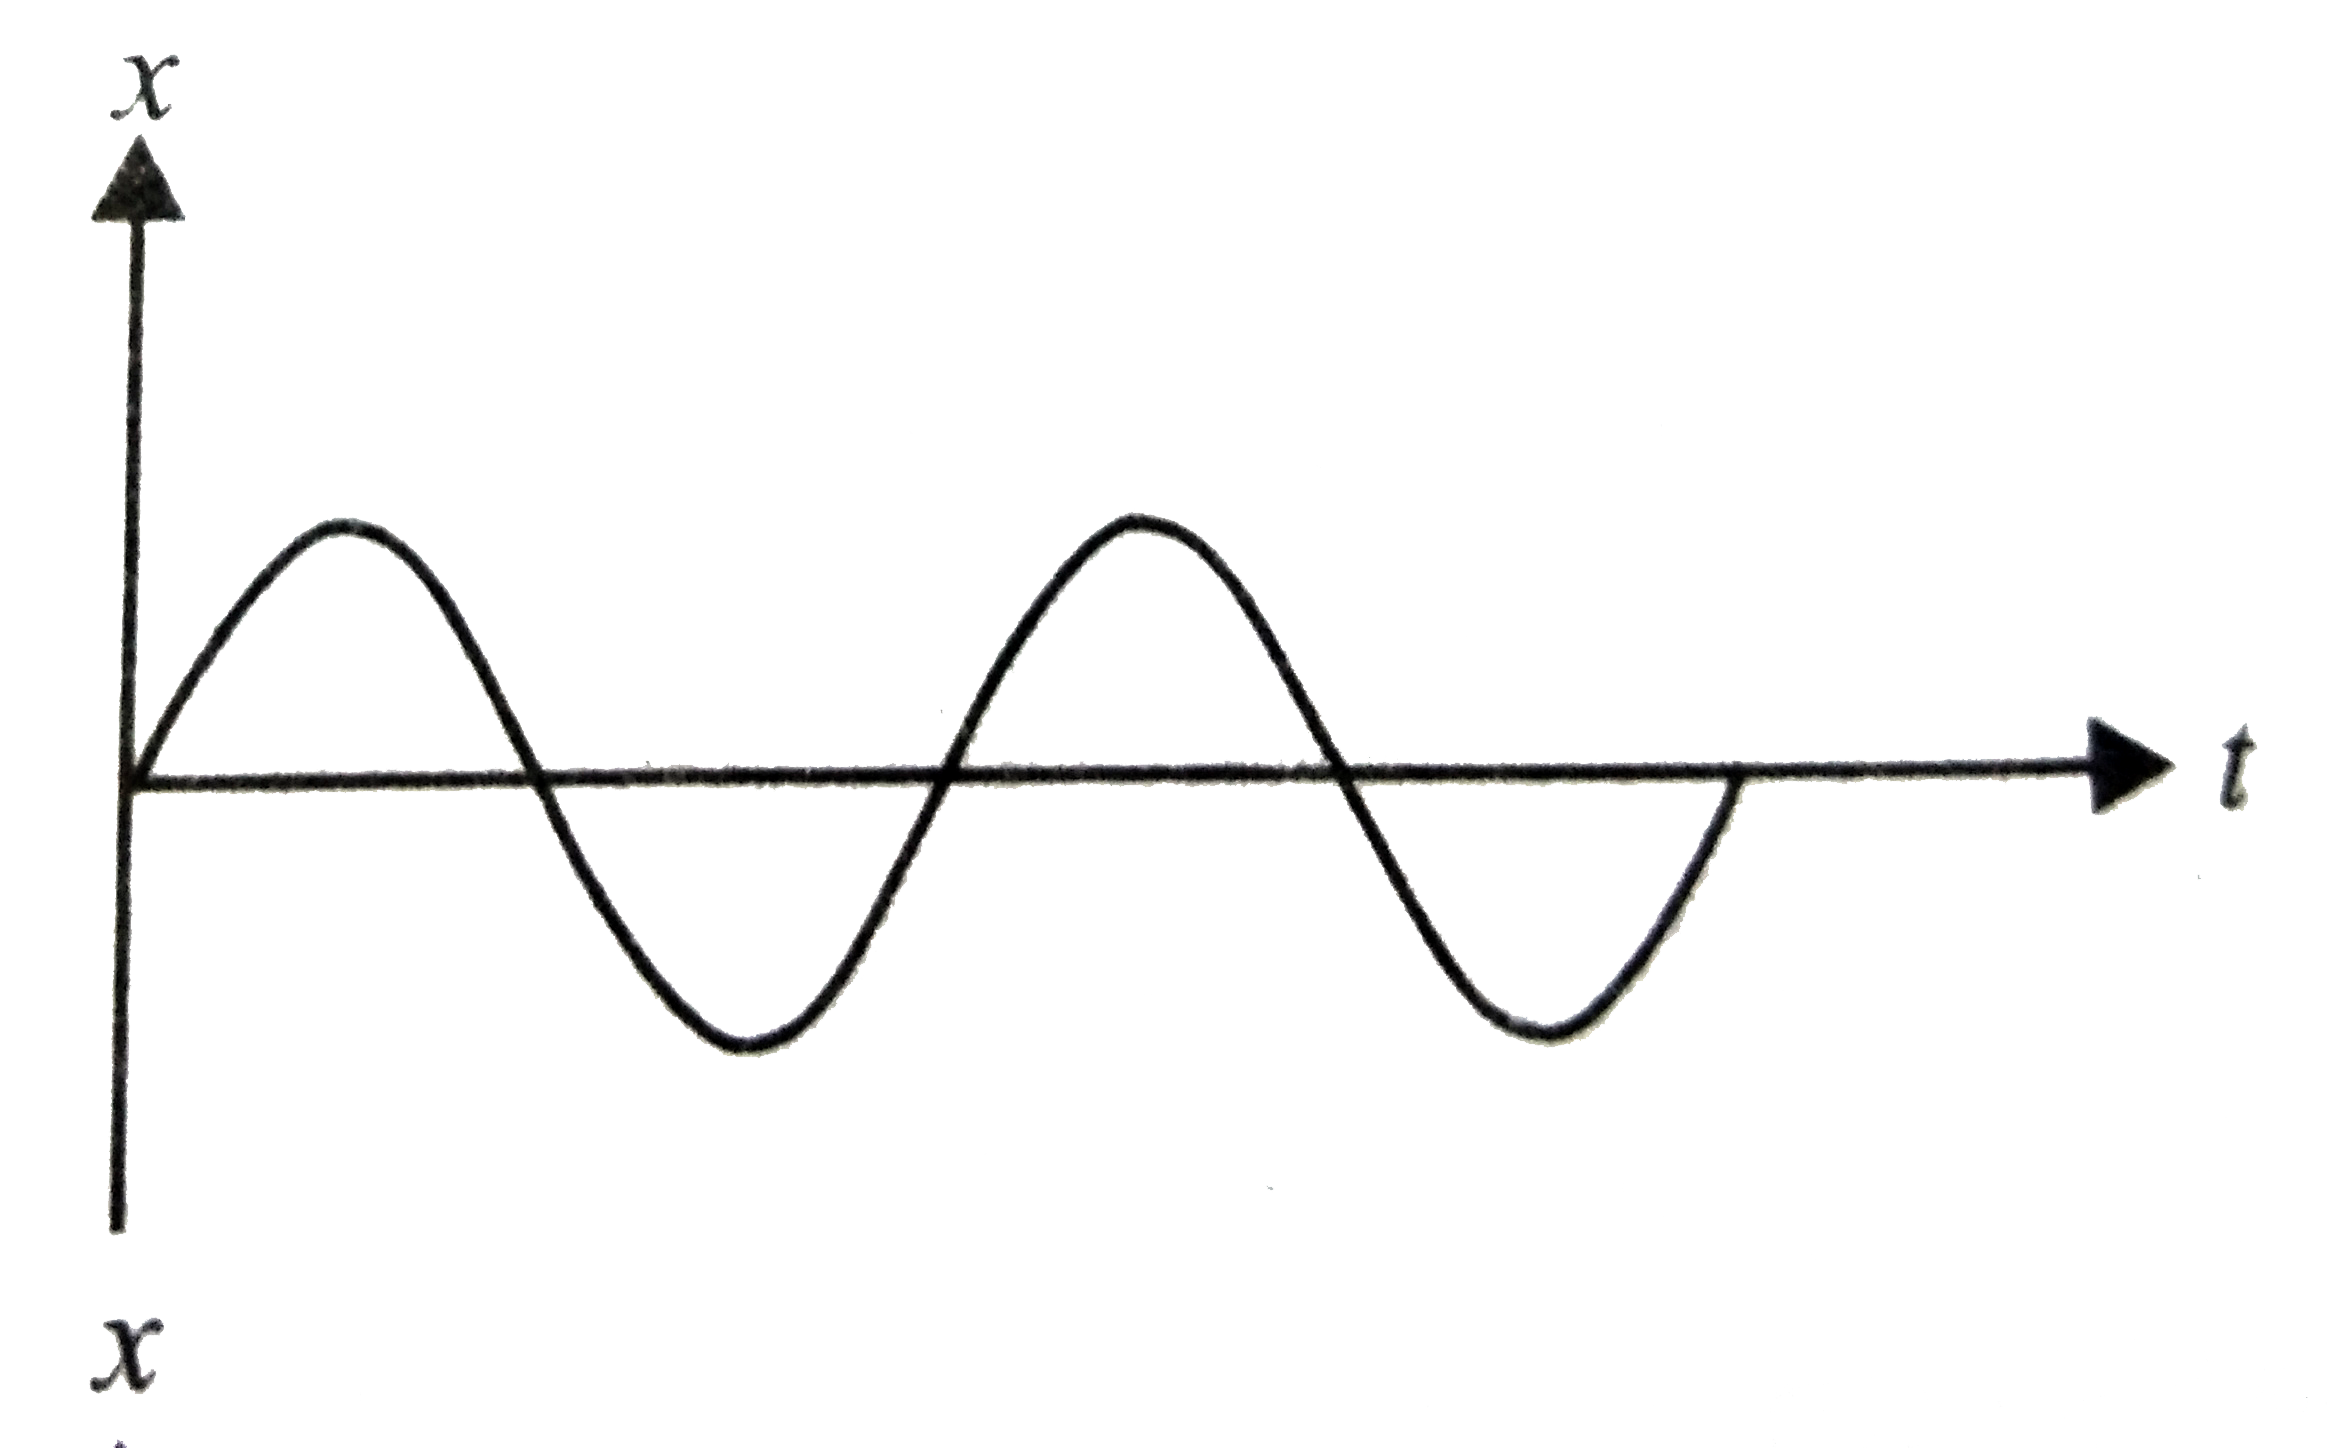 D
D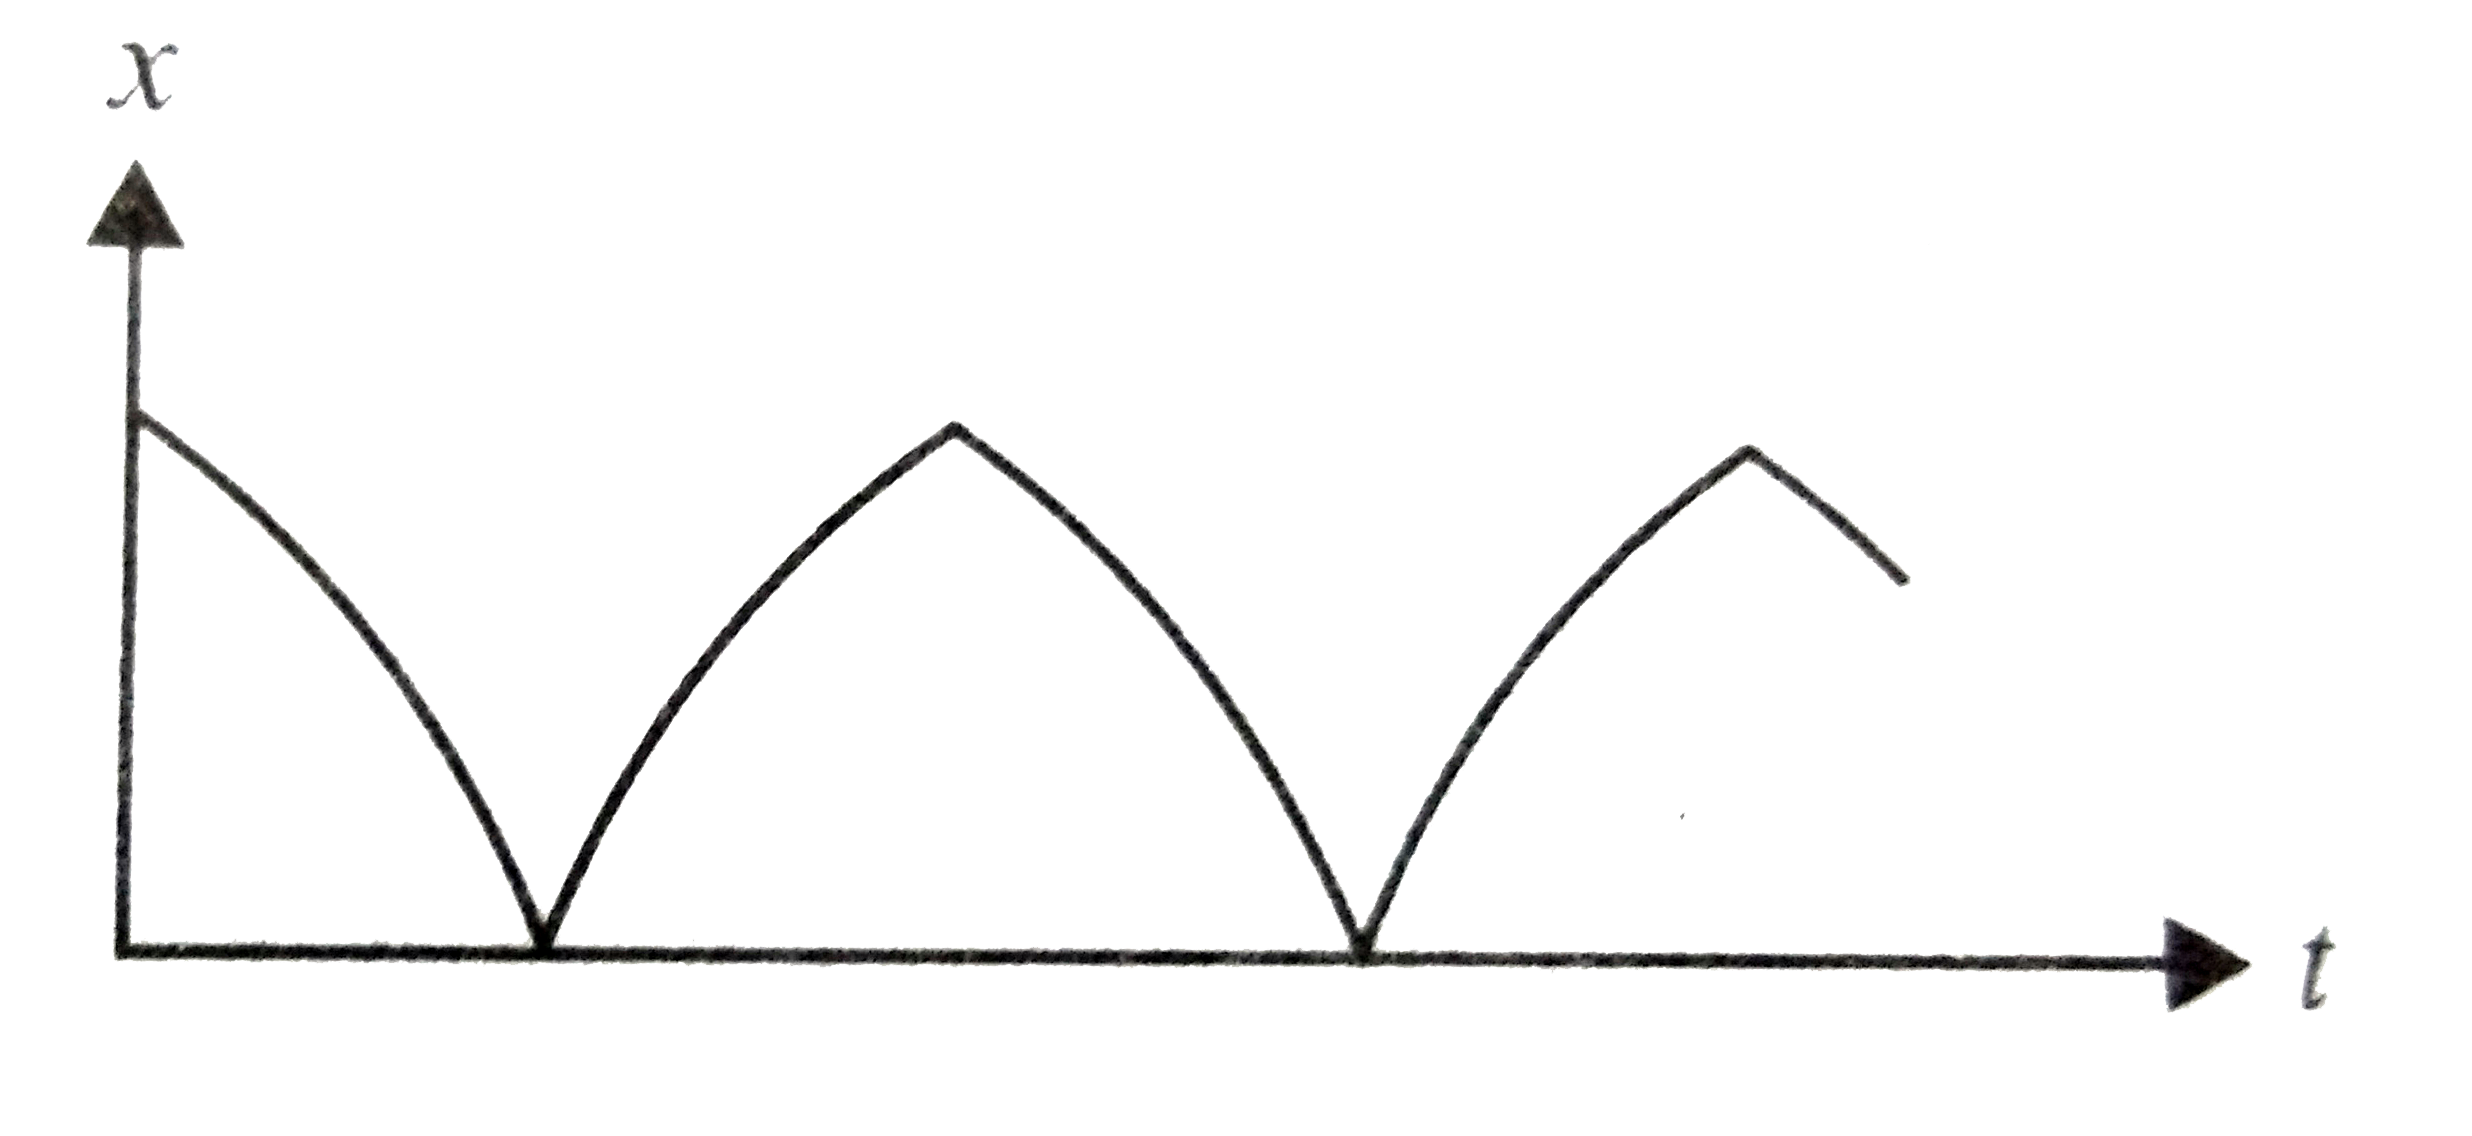
Which of the following graphs represent the correct variation of inductive reactance XL with frequency υ?
A B
B C
C D
D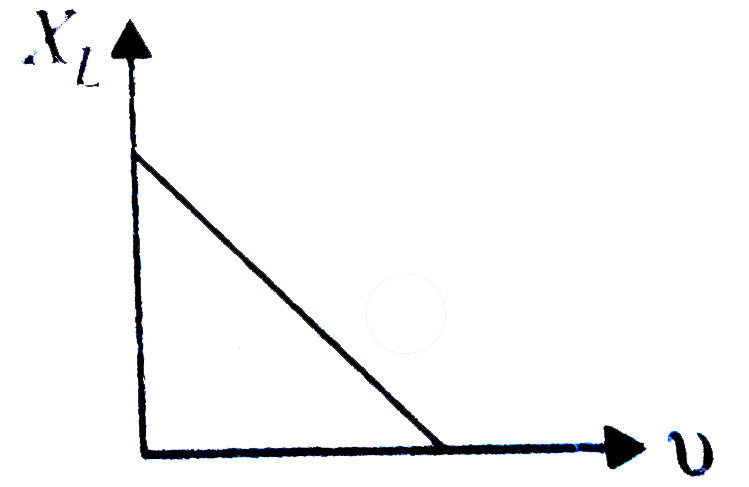
Which of the following graph correctly represents velocity-time relationship for a particle released from rest to fall freely under gravity ?
View SolutionWhich of the following graphs best represents the variation of acceleration 'a' with displacement x?
View SolutionWhich one of the following graphs represents the variation of electric field with distance r from the centre of a charged spherical conductor of radius R?
View SolutionWhich of the following graph represents the variation of resistivity (ρ) with temperature (T) for copper?
View SolutionAt time t=0, some radioactive gas is injected into a sealed vessel. At time T, some more of the same gas is injected into the same vessel. Which one of the following graphs best represents the variation of the logarithm of the activity A of the gas with time t?
View SolutionWhich of the following distance time graphs is possible ?
View Solution
