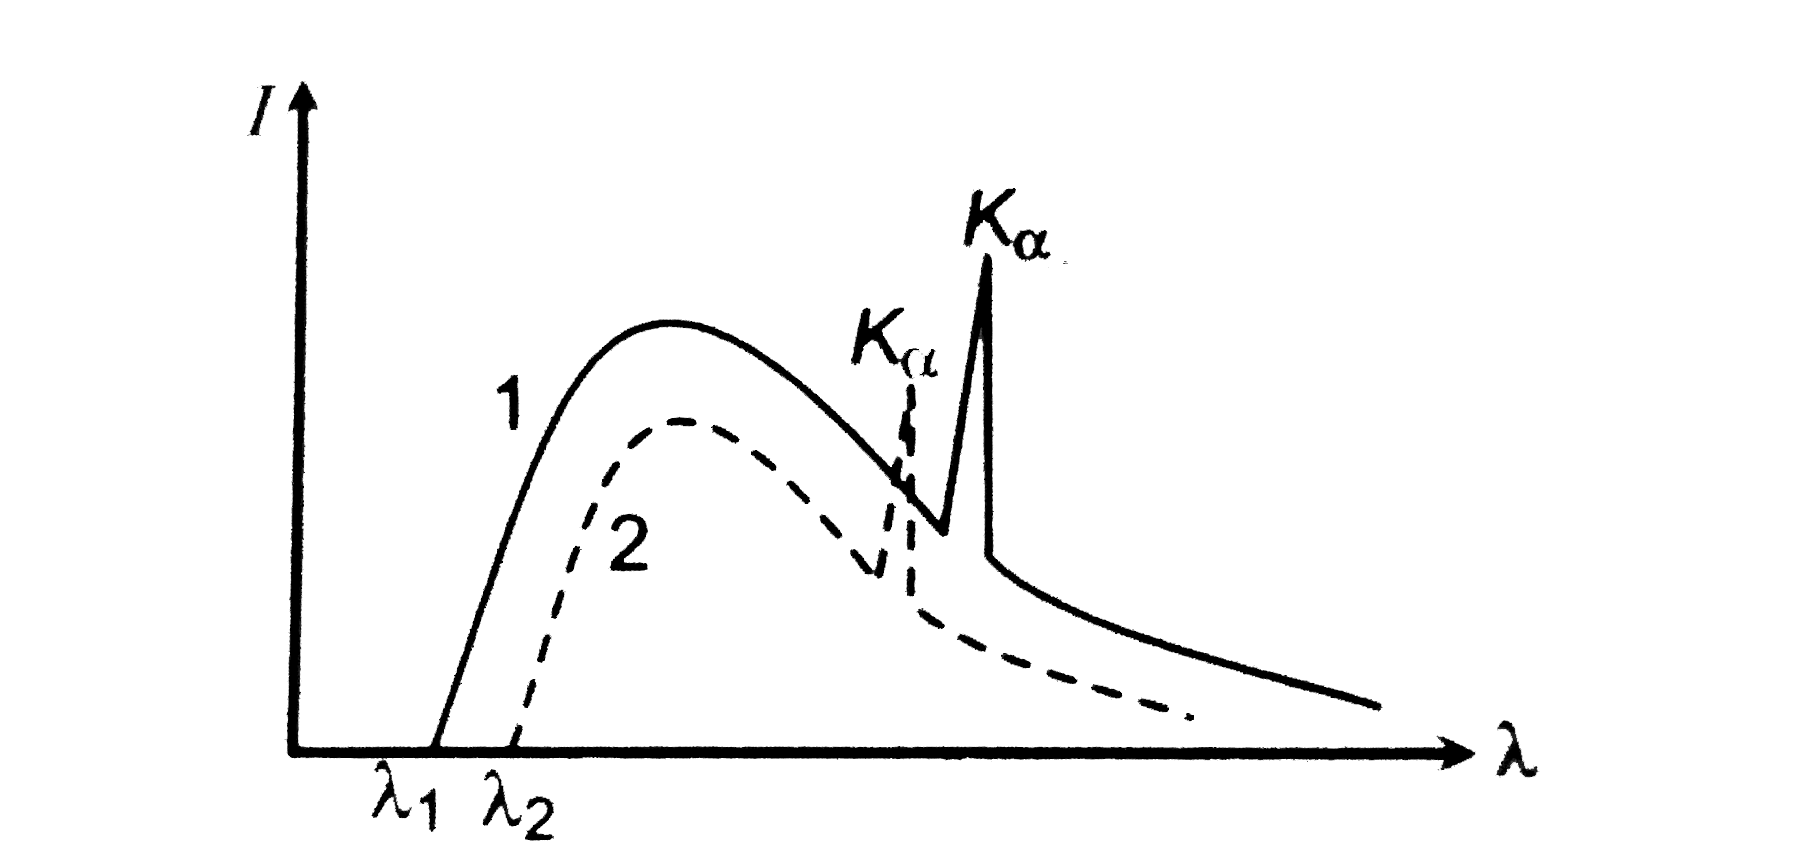
The intensity distribution of X-rays from two Coolidge tubes operated at different voltages V1 and V2 and using different target materials of atomic numbers Z1 and Z2 is shown in the figure which one of the following inequalities is true?

V1>V2,Z1<Z2
V1>V2,Z1>Z2
V1<V2,Z1>Z2
V1=V2,Z1<Z2
(1)
Similar Questions
The intensity distribution of X - rays from two Coolidge tubes operated on different voltages V1 and V2 and using is shown in the figure . Which one of the following inequalities is true ?
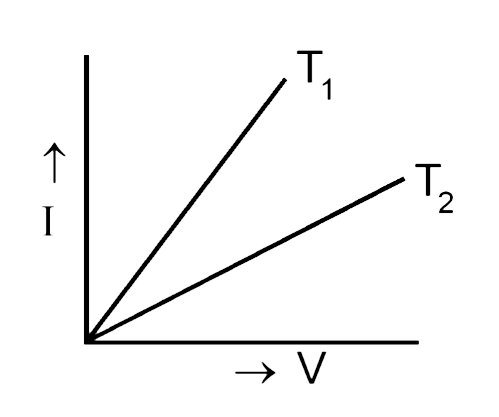
View SolutionI-V graph for a metallie wire at two different tempearture, T1andT2 is as shown in the figure. Which of the two temperatures is lower and why ?

View Solution
Knowledge Check
The voltage V and current I v graphs for a conductor at two different temperatures T1andT2 are shown in the figure. The relation between T1andT2 is
 AT1>T2BT1<T2CT1=T2DT1=1T2
V vs T curves at different pressures P1 and P2 for an ideal gas are shown below:

Which one of the following is correct?
View SolutionIf z1 and z2 are two complex numbers such that ∣∣∣z1−z21−¯z1z2∣∣∣=1, then which one of the following is true?
View SolutionThe current (I) and voltage (V) graphs for a given metallic wire at two different temperature (T1) and (T2) are shown in fig. It is concluded that
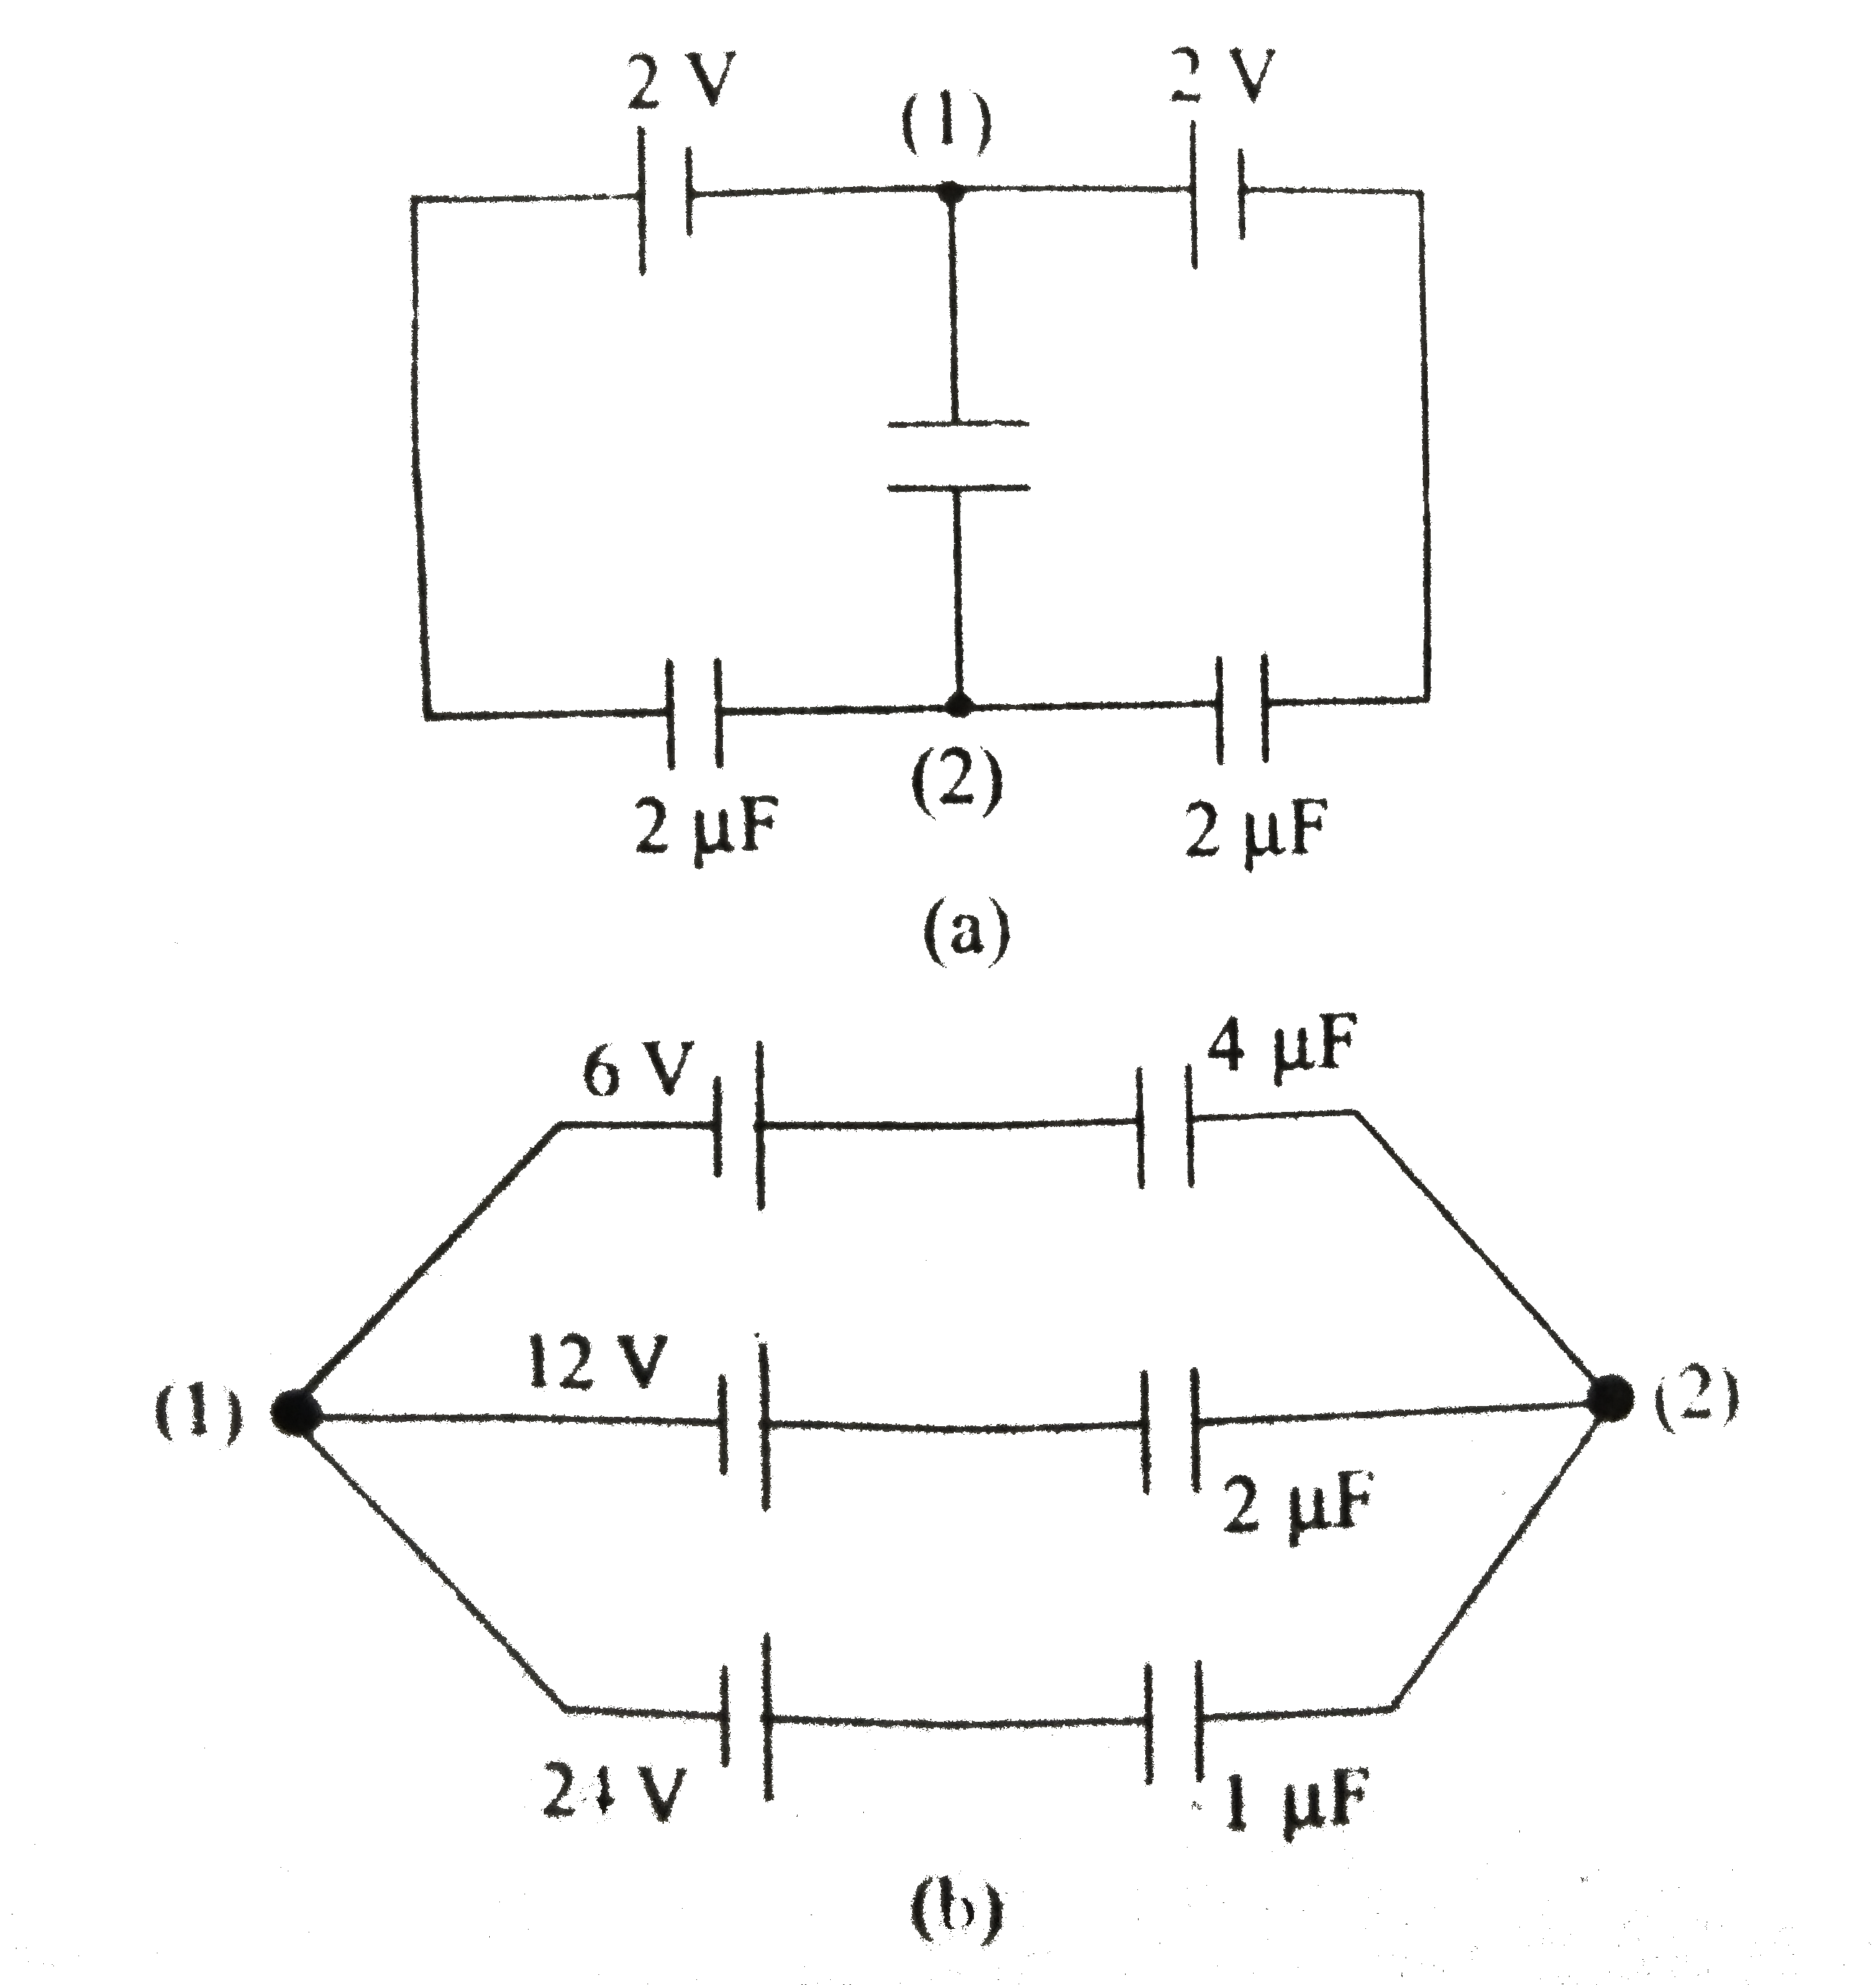
View SolutionFind the potential difference Va−Vb between the points (1) and (2) shown in each part of Fig.
View SolutionIf during an isothermal process certain gas is expanded from V1 to V2 . Then, which of the following would be true?
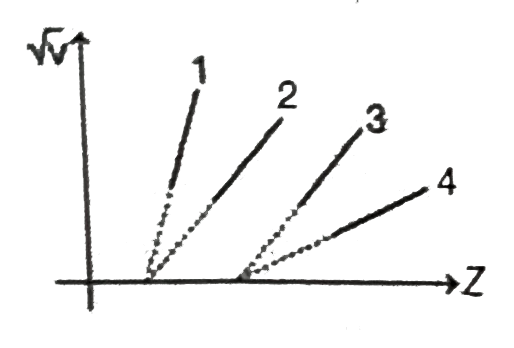
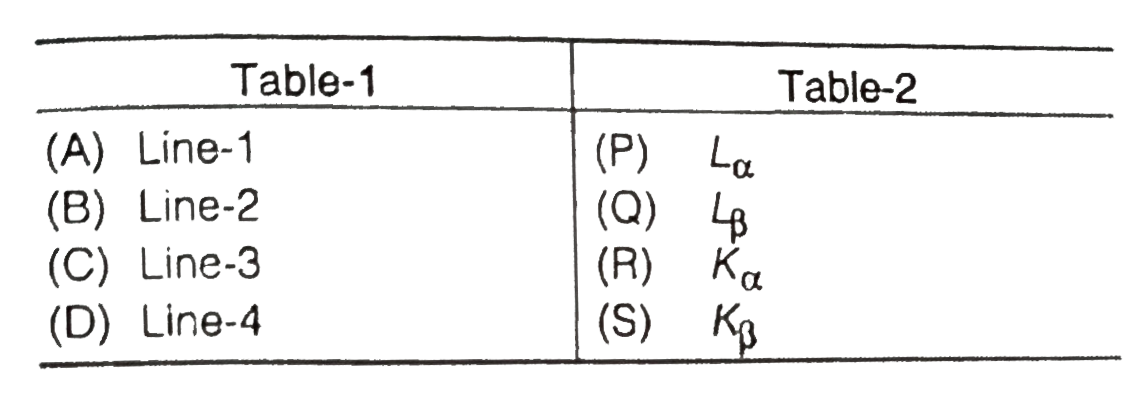
View Solution√v versus Z graph for dcharacteristic X-rays is as shown in figure. Match the following
View SolutionIf the points z1,z2,z3 are the vertices of an equilateral triangle in the Argand plane, then which one of the following is not correct?
View Solution
