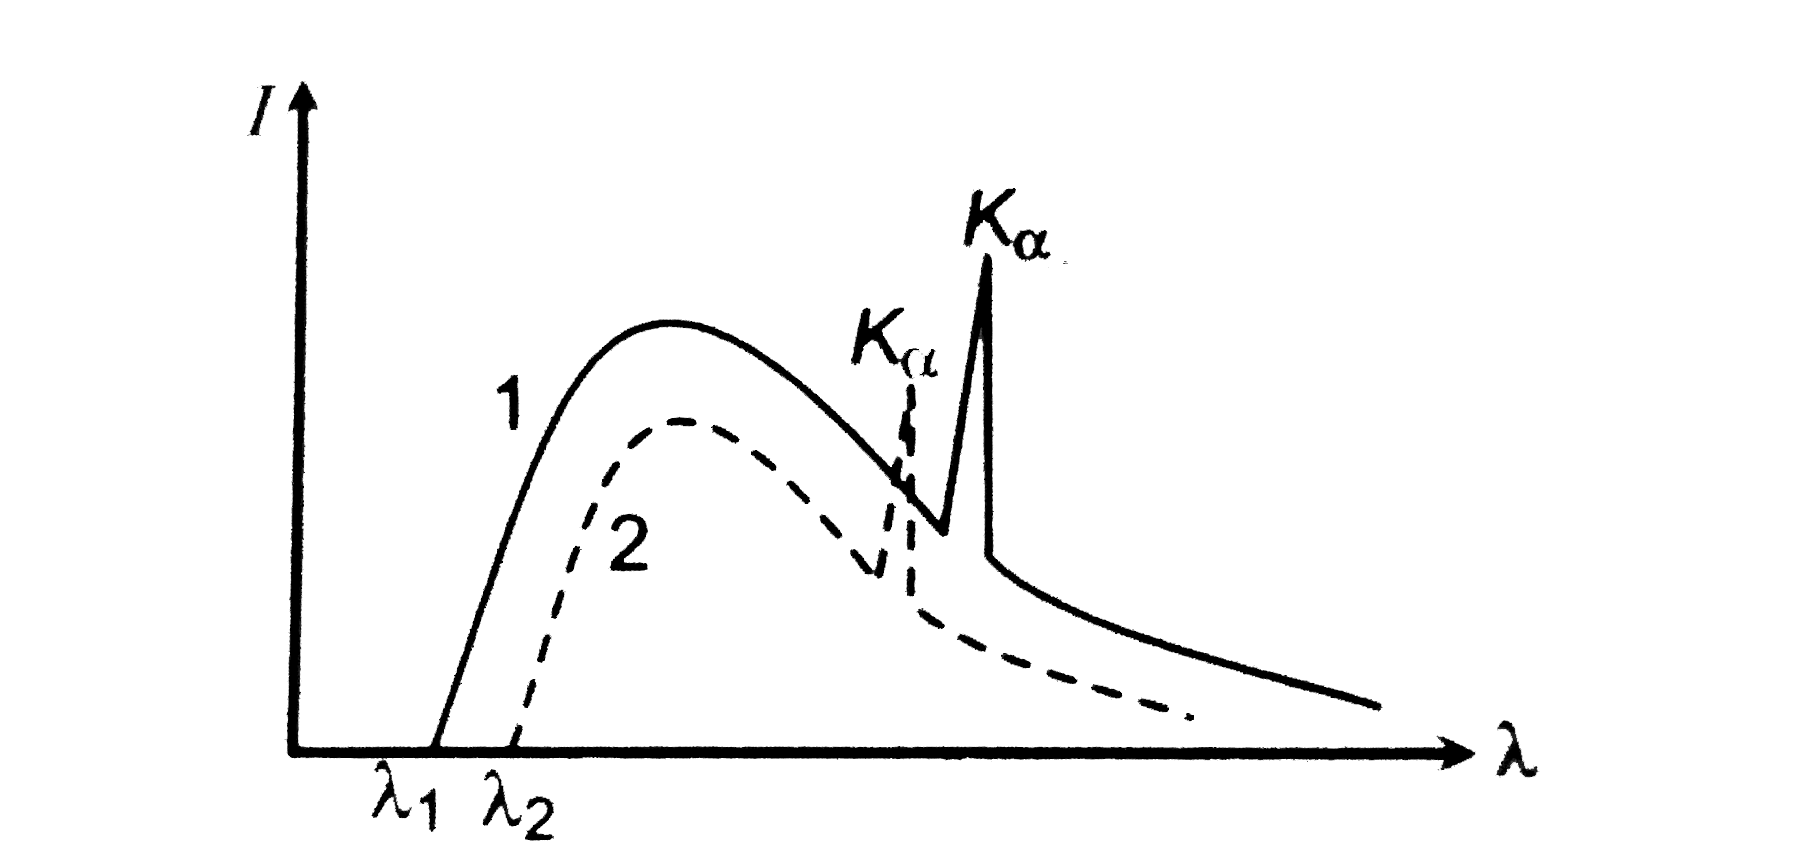
The intensity distribution of - rays from two Coolidge tubes operated on different voltages and and using is shown in the figure . Which one of the following inequalities is true ?
The correct Answer is:A
Step by step video & image solution for The intensity distribution of X - rays from two Coolidge tubes operated on different voltages V_(1) and V_(2) and using is shown in the figure . Which one of the following inequalities is true ? by Physics experts to help you in doubts & scoring excellent marks in Class 12 exams.
Updated on:21/07/2023Topper's Solved these Questions
- ATOMIC PHYSICSBook:CENGAGE PHYSICS ENGLISHChapter:ATOMIC PHYSICSExercise:dpp 4.2
Explore 15 Videos
- ALTERNATING CURRENTBook:CENGAGE PHYSICS ENGLISHChapter:ALTERNATING CURRENTExercise:Single Correct
Explore 10 Videos
- CAPACITOR AND CAPACITANCEBook:CENGAGE PHYSICS ENGLISHChapter:CAPACITOR AND CAPACITANCEExercise:Integer
Explore 5 Videos
Similar Questions
The intensity distribution of X-rays from two Coolidge tubes operated at different voltages V1 and V2 and using different target materials of atomic numbers Z1 and Z2 is shown in the figure which one of the following inequalities is true?

View SolutionA ray of light is incident in situation as shown in figure.
_S01_055_Q01.png)
Which of the following statements is/are true?
View Solution
Knowledge Check
The voltage V and current I v graphs for a conductor at two different temperatures T1andT2 are shown in the figure. The relation between T1andT2 is
 AT1>T2BT1<T2CT1=T2DT1=1T2
The graph of y=f(x) is shown to the right. If f(−1)=v, then which one of the following could be the value of f(v) ?
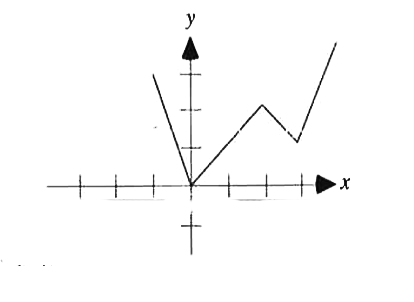 A0B1C2D2.5
I-V graph for a metallie wire at two different tempearture, T1andT2 is as shown in the figure. Which of the two temperatures is lower and why ?

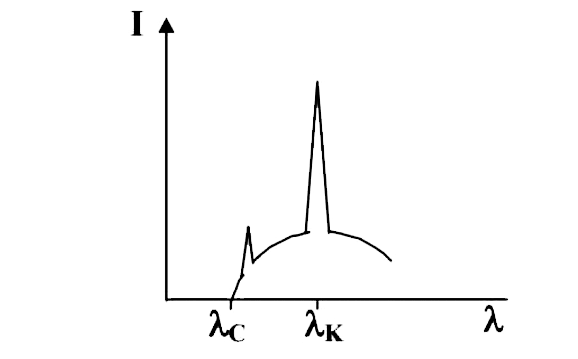
View SolutionThe intensity of X- ray from a coolidge tube is plotted againest wavelength λ as shown in the figure . The minimum wavelength found λc and the wavelength of theka line is λk, As the accelerating voliage is increase
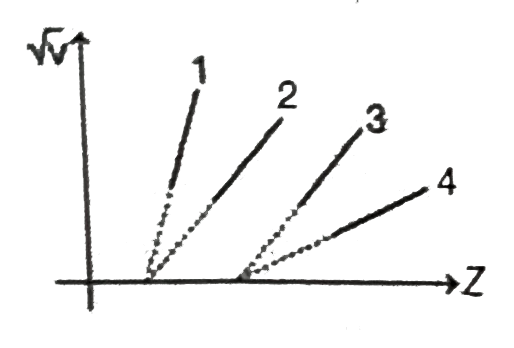
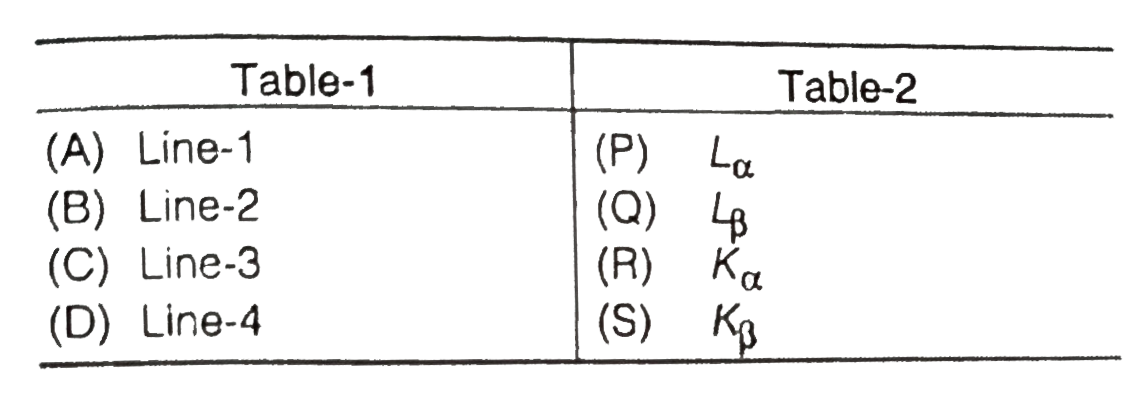
View Solution√v versus Z graph for dcharacteristic X-rays is as shown in figure. Match the following
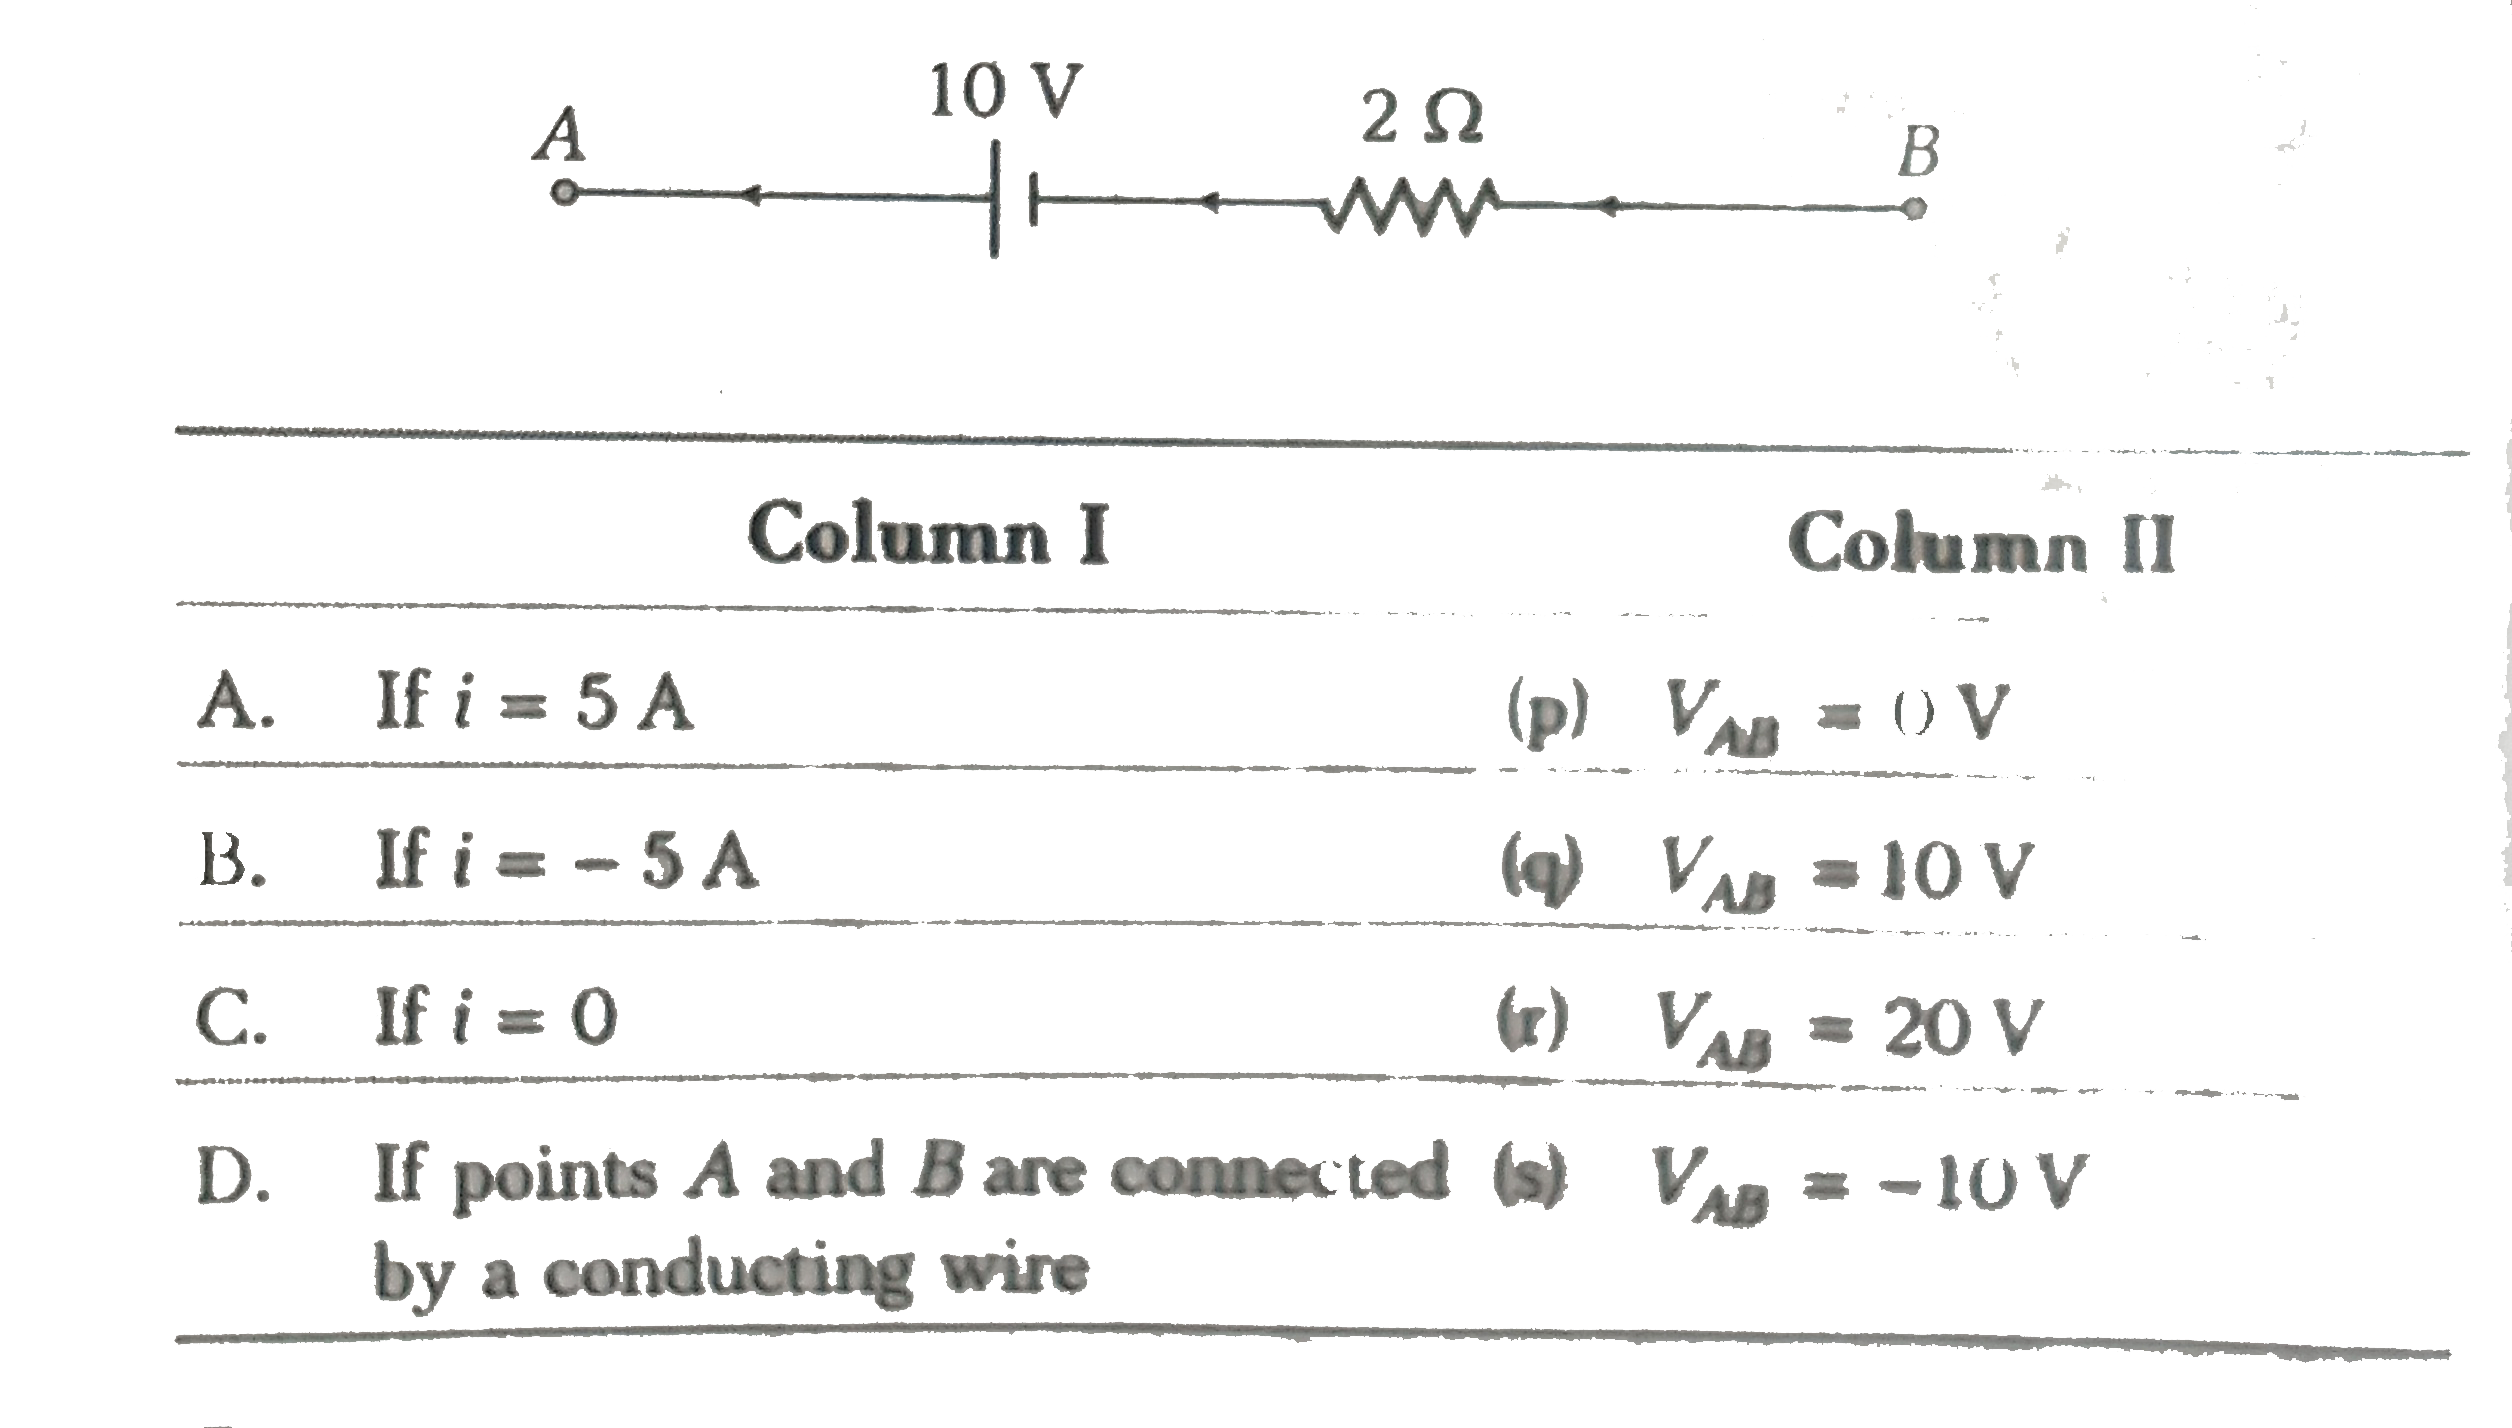
View SolutionIn the part of circuit shown in figure, match the following two columns for VAB
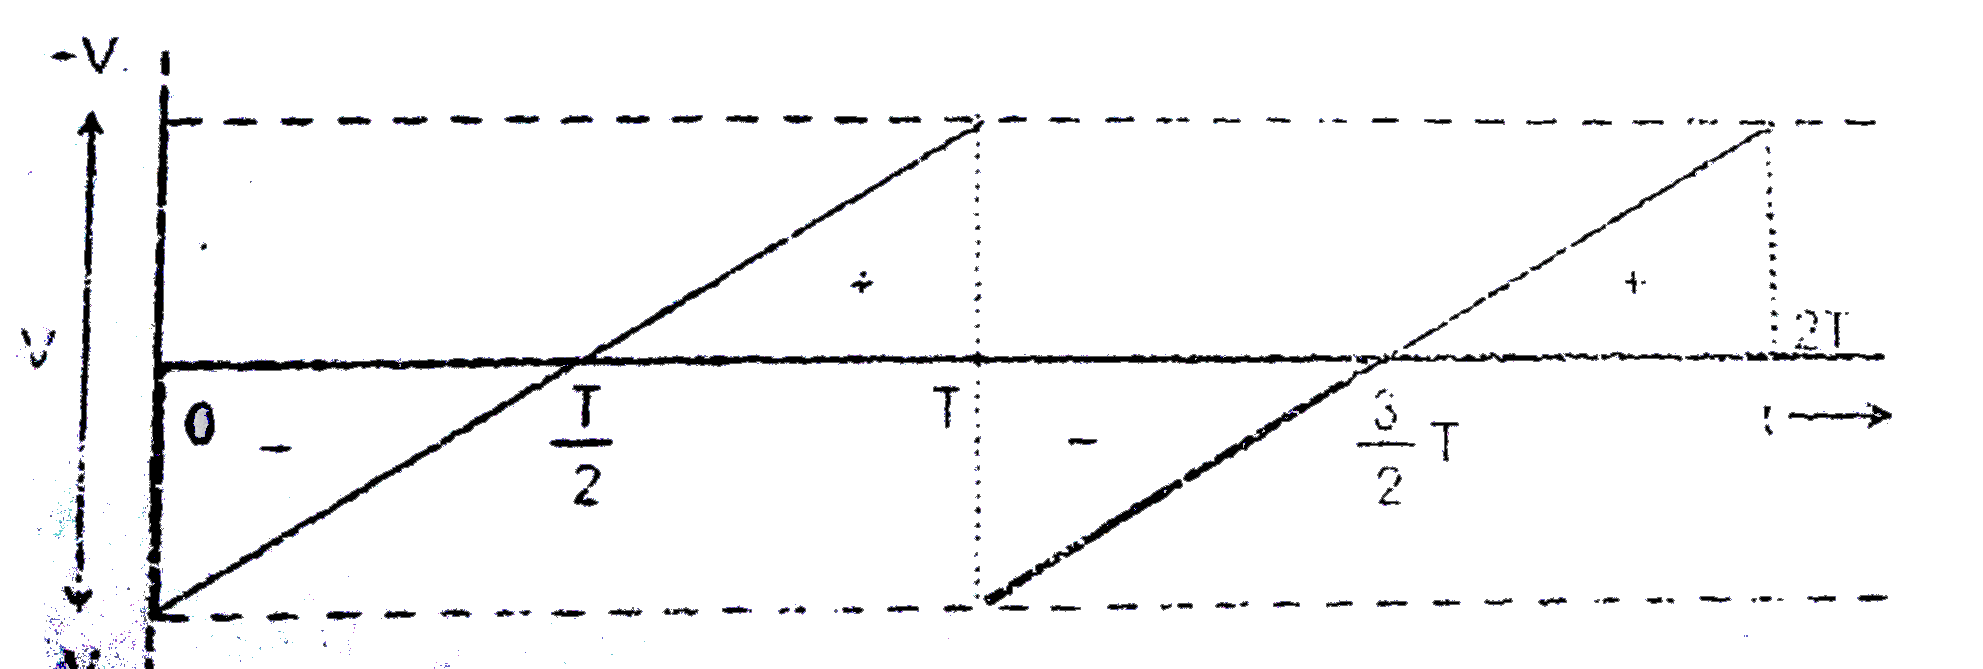
View SolutionFind the aveage for the saw-tooth voltage of peak value V0 from t=0 to t=2T as shown in figure.
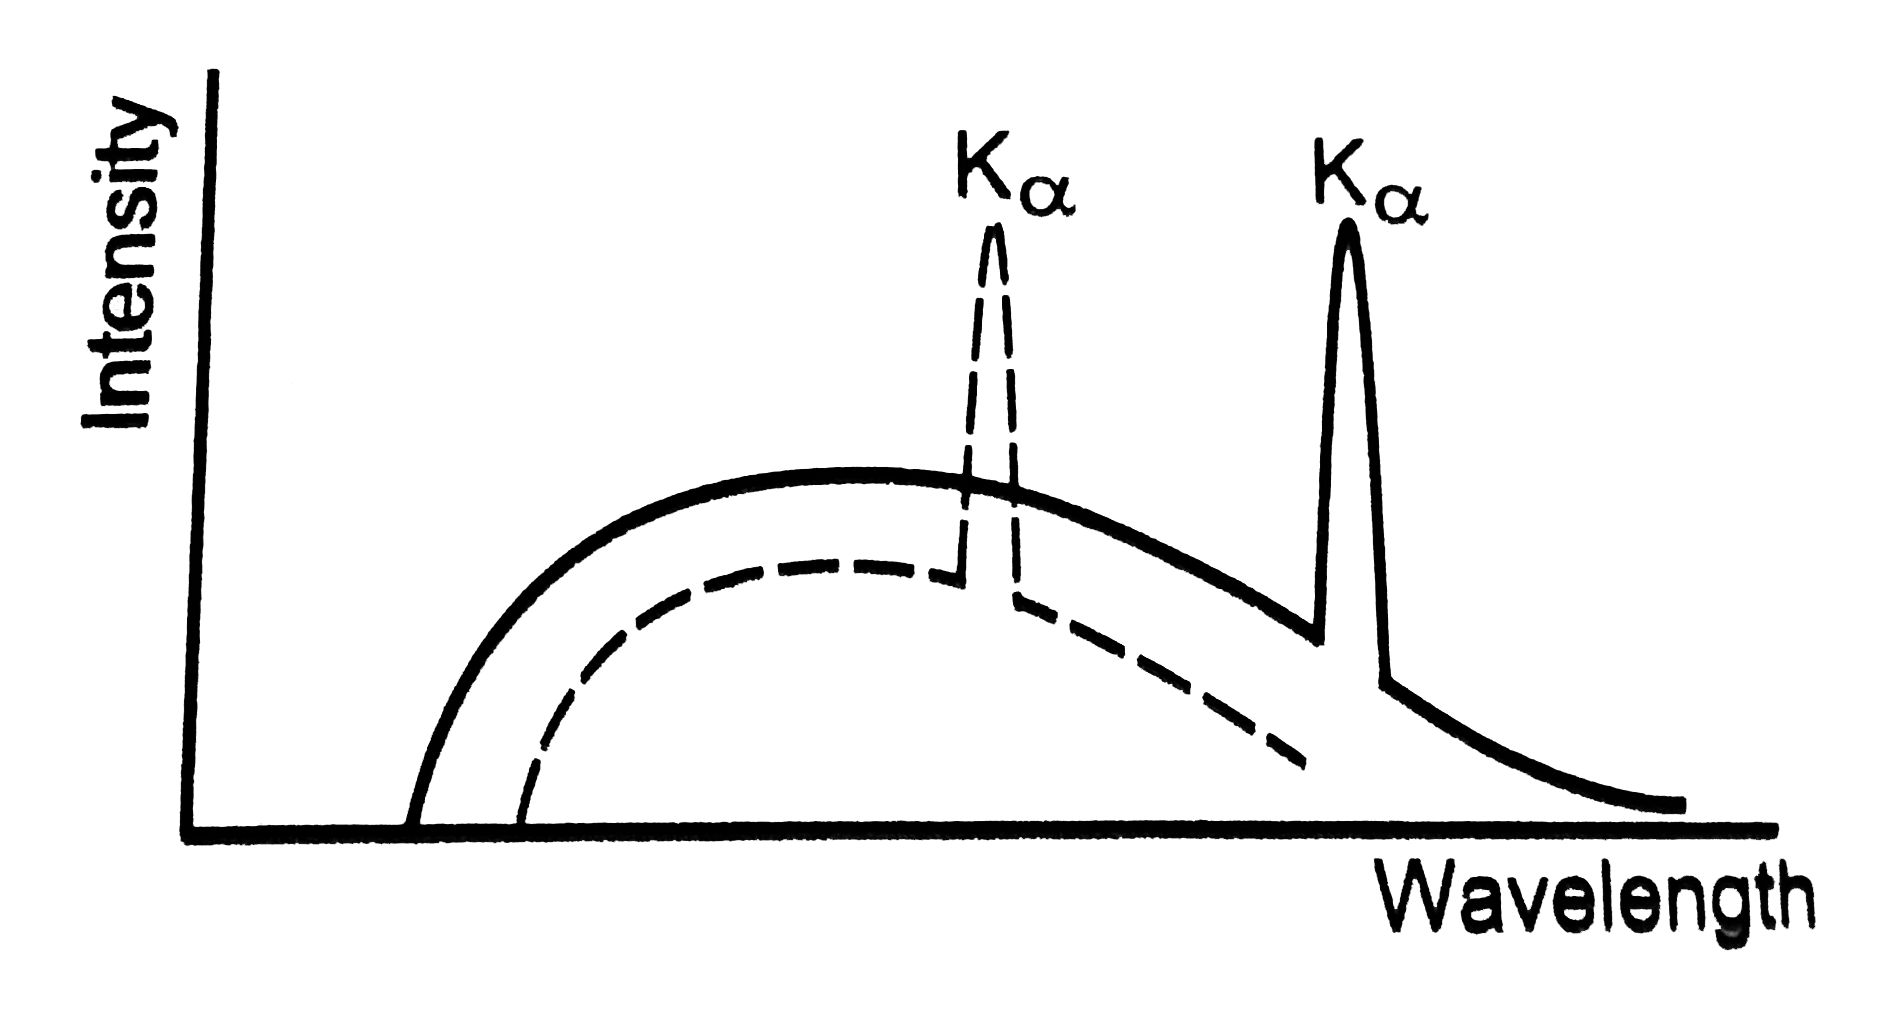
View SolutionFigure shows the intensity-wavelength relations of X-rays coming from two different Coolidge tube. The solid curve represents the relation for the tube A in which the potential difference between the target and the filament is Va and the atomic number of the target material is ZA. These quantities are Vβ and Zβ for the other tube. Then,
View Solution